
Recommended
Recommended
More Related Content
Similar to Statistics chapter 3 key concepts measures center variation relative standing
Similar to Statistics chapter 3 key concepts measures center variation relative standing (20)
More from opilipets
Recently uploaded
Recently uploaded (20)
Statistics chapter 3 key concepts measures center variation relative standing
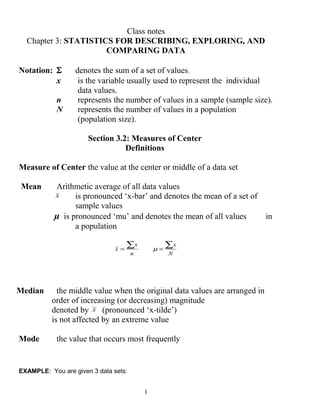
- 1. Class notes Chapter 3: STATISTICS FOR DESCRIBING, EXPLORING, AND COMPARING DATA Notation: Σ denotes the sum of a set of values. x is the variable usually used to represent the individual data values. n represents the number of values in a sample (sample size). N represents the number of values in a population (population size). Section 3.2: Measures of Center Definitions Measure of Center the value at the center or middle of a data set Mean Arithmetic average of all data values x is pronounced ‘x-bar’ and denotes the mean of a set of sample values µ is pronounced ‘mu’ and denotes the mean of all values in a population n x x ∑= N x∑=µ Median the middle value when the original data values are arranged in order of increasing (or decreasing) magnitude denoted by x~ (pronounced ‘x-tilde’) is not affected by an extreme value Mode the value that occurs most frequently EXAMPLE: You are given 3 data sets: 1
- 2. SAMPLE 1 SAMPLE 2 SAMPLE 3 1 1 2 1 2 2 1 4 4 1 6 6 16 2 6 Find the a) Mean ( x ) b) Median ( x~ ) c) mode d) midrange 2
- 3. EXAMPLE: Find a median of the following data set: 2, 2, 10, 5 ,6, 7, 8, 5 #17 p.89. Waiting times (in minutes) of customers at the Jefferson Valley Bank (where all customers enter a single waiting line) and the Bank of Providence (where customers wait in individual lines at three different teller windows) are listed below. Find the mean and median for each of the two samples, then compare the two sets of results. Jefferson Valley (single line): 6.5 6.6 6.7 6.8 7.1 7.3 7.4 7.7 7.7 7.7 Providence (individual lines): 4.2 5.4 5.8 6.2 6.7 7.7 7.7 8.5 9.3 10.0 Set 1 Set 2 Mean ( x ) Median ( x~ ) Determine whether there is a difference between the two data sets that is not apparent from a comparison of the measures of center. If so, what is it? 3
- 4. EXAMPLE: The given frequency distribution summarizes a sample of Mesa College student’s heights. Find the mean of the sample using your calculator. How does the mean compare to the value of 68, which is the value assumed to be the mean by most people? Midpoint Heights Frequencies 60 - 62 3 63 - 65 3 66 - 68 5 69 - 71 2 72 - 74 1 4
- 5. Section 3.3: Measures of Variation A dietician obtains the amounts of sugar (in centigrams) from 1 gram in each of 6 different cereals, including Cheerios, Corn Flakes, Fruit Loops, and 3 others (Note: this is not a real data, used as an example for teaching purposes only.) Those values are listed below. 1 2 10 12 17 18 Find the a) Range b) Variance (σ 2 ) c) Standard deviation (σ ) d) Is the standard deviation of those values likely to be a good estimate of the standard deviation of the amounts of sugar in each gram of cereal consumed by the population of all Americans who eat cereal? Why or why not? 5
- 6. #17 p.107. Waiting times (in minutes) of customers at the Jefferson Valley Bank (where all customers enter a single waiting line) and the Bank of Providence (where customers wait in individual lines at three different teller windows) are listed below. Find the range, variance, and standard deviation for each of two samples, then compare the two sets of results Jefferson Valley (single line): 6.5 6.6 6.7 6.8 7.1 7.3 7.4 7.7 7.7 7.7 Providence (individual lines): 4.2 5.4 5.8 6.2 6.7 7.7 7.7 8.5 9.3 10.0 Set 1 Set 2 Range St. Deviation ( s ) Variance( 2 s ) Coefficient of Variation Standard deviations of the data sets that use different scale and units and/or have significantly different means should not be compared. In such a case we use Coefficient of Variation (CV) %100∗= x s CV or %100∗= µ σ CV Example: A sample of 100 guppy fish had a mean lengths of 22 mm with a standard deviation of 8 mm. A sample of 100 humpback whales had an average length of 42.5 ft. with a standard deviation of 3.8 ft. Which sample was more variable? 6
- 7. Empirical Rule ( 68-95-99.7) For data sets having a distribution that is approximately bell shaped, the following properties apply: About 68% of all values fall within 1 standard deviation of the mean. About 95% of all values fall within 2 standard deviations of the mean. About 99.7% of all values fall within 3 standard deviations of the mean. Estimation of Standard Deviation: Range Rule of Thumb For interpreting a known value of the standard deviation s, find rough estimates of the minimum and maximum “usual” sample values by using: #32 p.109. Aluminum cans with a thickness of 0.0111 in. have axial loads with a mean of 281.8 lb and a standard deviation of 27.8 lb. The axial load is measured by applying pressure to the top of the can until it collapses, Use the range rule of thumb to find the minimum and maximum “usual axial loads. One particular can had an axial load of 504lb. Is that unusual? 7 Minimum “usual” value (mean) – 2 X (standard deviation Maximum “usual” value (mean) + 2 X (standard deviation)
- 8. Section 3.4: Measures of Relative Standing #14 p.118. Three students take equivalent stress tests. Which is the highest relative score? a) A score of 144 on a test with a mean of 128 and a standard deviation of 34, b) A score of 90 on a test with a mean of 86 and a standard deviation of 18, c) A score of 18 on a test with a mean of 15 and a standard deviation of 5, 8