SlideShare a Scribd company logo
1 of 32
16 MMGHHSCP CHAPTERS
5 YEAR NET SURPLUS
2010 - 2014
YEAR AKLAN ALBAY
BAGUIO
BENGUET BULACAN BOHOL CAM SUR
DIPOLOG
ZAMBO NORTE
GENSAN SOUTH
COTABATO MASBATE METRO MANILA
MINDORO
ORIENTAL PALAWAN QUEZON SORSOGON
TAGUM DVO
NORTE ZAMBALES
2010 3,967,851.43 7,678,811.75 150,940.00 10,847,297.00 2,124,639.00 - 3,301,069.54 734,380.49 1,711,369.13 4,013,991.19 3,637,488.00 7,242,006.84 6,631,120.33 9,624,618.45 8,598,965.14 5,129,971.63 390,024.97
2011 4,293,540.63 7,923,773.62 174,255.00 13,784,616.00 - 6,977,411.00 - 539,138.42 243,454.91 443,021.69 3,086,000.93 5,976,832.00 4,607,378.33 7,281,736.02 9,894,014.03 8,001,572.57 4,760,619.05 1,334,289.99
2012 2,993,274.11 8,656,347.24 55,252.00 14,590,059.00 - 4,003,036.00 781,703.42 340,754.66 1,602,402.67 4,466,547.44 1,686,720.00 3,700,624.65 5,266,118.21 9,275,747.81 8,153,485.34 9,611,750.60 1,962,280.40
2013 3,641,437.26 8,520,078.93 - 58,954.00 18,240,670.00 907,121.00 396,415.49 692,264.84 5,040,711.50 3,519,034.86 1,407,084.00 3,876,176.70 5,464,183.44 12,086,892.88 9,703,771.55 9,603,255.58 786,690.13
2014 4,735,945.50 4,579,214.12 - 12,374.00 17,127,744.39 44,241.00 - 3,150,917.24 222,536.68 9,864,991.73 5,069,902.34 2,398,668.00 3,519,863.82 6,430,143.47 12,757,804.53 10,977,750.68 10,252,379.70 - 2,992,543.00
AVERAGE 3,926,409.79 7,471,645.13 61,823.80 14,918,077.28 - 1,580,889.20 - 1,162,601.26 446,678.32 3,732,499.34 4,031,095.35 3,021,358.40 4,589,210.07 6,214,660.29 10,727,815.54 9,087,109.06 7,871,595.31 296,148.50
AKLAN ALBAY
BAGUIO
BENGUET BULACAN BOHOL CAM SUR
DIPOLOG
ZAMBO NORTE
GENSAN
SOUTH
COTABATO MASBATE
METRO
MANILA
MINDORO
ORIENTAL PALAWAN QUEZON SORSOGON
TAGUM DVO
NORTE ZAMBALES
3,926,409.79 7,471,645.13 61,823.80 14,918,077.28 - 1,580,889.20- 1,162,601.26 446,678.32 3,732,499.34 4,031,095.35 3,021,358.40 4,589,210.07 6,214,660.29 10,727,815.54 9,087,109.06 7,871,595.31296,148.50
CHAPTERS OF THE FIRST ORDER
• 1. BULACAN – Central Tagalog Region – Assets: 98,448,547.22
• 2. QUEZON – Southern Tagalog Region – Assets: 235,641,629.59
• 3. SORSOGON – Bicol Region – Assets: 140,391,421.85
• 4. DAVAO DEL NORTE – South East Mindanao – Assets:
154,504,785.85
• 5. ALBAY – Bicol Region – Assets: 49,287,235.85
• 6. PALAWAN – Mimaropa Region – Assets: 159,757,223.69
1. BULACAN – Central Tagalog Region –
Assets: 98,448,547.22
y = 6E+06x + 2E+07
y = 4E+06x + 1E+07
y = 2E+06x + 5E+06
-
10,000,000.00
20,000,000.00
30,000,000.00
40,000,000.00
50,000,000.00
60,000,000.00
70,000,000.00
2008 2009 2010 2011 2012 2013 2014
TOTAL REVENUES, EXPENSES, SURPLUS
FY 2008 - 2014
GROSS REVENUE OPERATIONAL EXPENSES NET SURPLUS Linear (GROSS REVENUE) Linear (OPERATIONAL EXPENSES) Linear (NET SURPLUS)
2. QUEZON – Southern Tagalog Region –
Assets: 235,641,629.59
y = 9E+06x + 2E+08
y = 9E+06x + 2E+08
y = 696700x + 7E+06
-
50,000,000.00
100,000,000.00
150,000,000.00
200,000,000.00
250,000,000.00
300,000,000.00
2008 2009 2010 2011 2012 2013 2014
GROSS REVENUES, OP. EXPENSES, NET SURPLUS
REVENUE EXPENSES NET INCOME Linear ( REVENUE) Linear (EXPENSES) Linear (NET INCOME)
3. SORSOGON – Bicol Region – Assets:
140,391,421.85
y = 9E+06x + 8E+07
y = 8E+06x + 7E+07
y = 507077x + 7E+06
-
20,000,000.00
40,000,000.00
60,000,000.00
80,000,000.00
100,000,000.00
120,000,000.00
140,000,000.00
160,000,000.00
2008 2009 2010 2011 2012 2013 2014
TOTAL REVENUES, EXPENSES, SURPLUS
FY 2008-2014
GROSS REVENUE OPERATING EXPENSES NET SURPLUS Linear (GROSS REVENUE) Linear (OPERATING EXPENSES) Linear (NET SURPLUS)
4. DAVAO DEL NORTE – South East Mindanao –
Assets: 154,504,785.85
y = 1E+07x + 7E+07
y = 9E+06x + 7E+07
y = 2E+06x + 168611
-
20,000,000.00
40,000,000.00
60,000,000.00
80,000,000.00
100,000,000.00
120,000,000.00
140,000,000.00
160,000,000.00
2008 2009 2010 2011 2012 2013 2014
GROSS REVENUES, OP. EXPENSES, NET SURPLUS
REVENUE EXPENSES NET SURPLUS Linear ( REVENUE) Linear (EXPENSES) Linear (NET SURPLUS)
5. ALBAY – Bicol Region – Assets: 49,287,235.85
y = -902921x + 2E+07
y = -342632x + 2E+07
y = -560289x + 9E+06
-
5,000,000.00
10,000,000.00
15,000,000.00
20,000,000.00
25,000,000.00
30,000,000.00
2010 2011 2012 2013 2014
GROSS REVENUE, OP. EXPENSES, NET SURPLUS
GROSS REVENUE OPERATIONAL EXPENSES NET SURPLUS Linear (GROSS REVENUE) Linear (OPERATIONAL EXPENSES) Linear (NET SURPLUS)
6. PALAWAN – Mimaropa Region – Assets:
159,757,223.69
y = 1E+07x + 2E+07
y = 1E+07x + 6E+06
y = -486560x + 9E+06
0.00
20,000,000.00
40,000,000.00
60,000,000.00
80,000,000.00
100,000,000.00
120,000,000.00
2008 2009 2010 2011 2012 2013 2014
ANNUAL REVENUES ANNUAL EXPENSES
ANNUAL NET OPERATING INCOME Linear (ANNUAL REVENUES)
Linear (ANNUAL EXPENSES) Linear (ANNUAL NET OPERATING INCOME)
REVENUES, OP. EXPENSES, NET SURPLUS
AKLAN
BAGUIO
BENGUET BOHOL CAM SUR
DIPOLOG
ZAMBO NORTE
GENSAN
SOUTH
COTABATO MASBATE
METRO
MANILA
MINDORO
ORIENTAL ZAMBALES
3,926,409.79 61,823.80 - 1,580,889.20 - 1,162,601.26 446,678.32 3,732,499.34 4,031,095.35 3,021,358.40 4,589,210.07 296,148.50
CHAPTERS OF THE SECOND ORDER
• 7. MINDORO ORIENTAL – Mimaropa Region – Assets: 117,925,111.72
• 8. MASBATE – Mimaropa Region – Assets: 29,953,432.02
• 9. AKLAN – Western Visayas Region – Assets: 36,575,931.61
• 10. SOUTH COTABATO – South Central Mindanao – Assets:
44,279,256.22
7. MINDORO ORIENTAL – Mimaropa Region –
Assets: 117,925,111.72
y = 9E+06x + 2E+07
y = 1E+07x + 2E+07
y = -853809x + 9E+06
-
10,000,000.00
20,000,000.00
30,000,000.00
40,000,000.00
50,000,000.00
60,000,000.00
70,000,000.00
80,000,000.00
90,000,000.00
100,000,000.00
2008 2009 2010 2011 2012 2013 2014
AmountinPesos
Fiscal Year
Total Revenues, Expenses, Net Surplus
FY 2008-2014
REVENUES EXPENSES NET SURPLUS Linear (REVENUES) Linear (EXPENSES) Linear (NET SURPLUS)
8. MASBATE – Mimaropa Region – Assets:
29,953,432.02
y = 3E+06x + 1E+07
y = 3E+06x + 1E+07
y = 861511x - 364399
-
5,000,000.00
10,000,000.00
15,000,000.00
20,000,000.00
25,000,000.00
30,000,000.00
35,000,000.00
40,000,000.00
45,000,000.00
2008 2009 2010 2011 2012 2013 2014 2015
GROSS REVENUES, OP. EXPENSES, NET SURPLUS
GROSS REVENUE OPERATIONAL EXPENSES NET SURPLUS Linear (GROSS REVENUE) Linear (OPERATIONAL EXPENSES) Linear (NET SURPLUS)
9. AKLAN – Western Visayas Region – Assets:
36,575,931.61
y = 1E+06x + 4E+06
y = 877936x + 3E+06
y = 465336x + 1E+06
-
2,000,000.00
4,000,000.00
6,000,000.00
8,000,000.00
10,000,000.00
12,000,000.00
14,000,000.00
16,000,000.00
2008 2009 2010 2011 2012 2013 2014
GROSS REVENUE, OP. EXPENSES, NET SURPLUS
GROSS REVENUE OPERATING EXPENSES NET SURPLUS Linear (GROSS REVENUE) Linear (OPERATING EXPENSES) Linear (NET SURPLUS)
10. SOUTH COTABATO – South Central Mindanao –
Assets: 44,279,256.22
0
5000000
10000000
15000000
20000000
25000000
30000000
35000000
1 2 3 4 5 6
Chart Title
YEAR GROSS REVENUE OPERATIONAL EXPENSES NET SURPLUS
BAGUIO
BENGUET BOHOL CAMSUR
DIPOLOG
ZAMBO NORTE
METRO
MANILA ZAMBALES
61,823.80 1,580,889.20- 1,162,601.26- 446,678.32 3,021,358.40 296,148.50
CHAPTERS OF THE THIRD ORDER
• 11. METRO MANILA SOUTH – National Capital Region – Assets:
93,967,057.00
• 12. ZAMBOANGA DEL NORTE – North Western Mindanao- Assets:
35,091,781.53
• 13. ZAMBALES – Central Luzon – Assets: 43,104,680.32
• 14. BENGUET – Cordilleras Region – Assets: 1,610,048.80
• 15. CAMARINES SUR – Bicol Region – Assets: 78,620,863.55
• 16. BOHOL – Central Visayas – Assets: 140,581,203.40
11. METRO MANILA SOUTH – National Capital
Region – Assets: 93,967,057.00
y = 6E+06x + 3E+07
y = 7E+06x + 2E+07
y = -704739x + 5E+06
0
10000000
20000000
30000000
40000000
50000000
60000000
70000000
2010 2011 2012 2013 2014
GROSS REVENUES, OP. EXPENSES, NET SURPLUS
GROSS REVENUE OPERATIONAL EXPENSES NET SURPLUS Linear (GROSS REVENUE) Linear (OPERATIONAL EXPENSES) Linear (NET SURPLUS)
12. ZAMBOANGA DEL NORTE – North Western
Mindanao- Assets: 35,091,781.53
y = 3E+06x + 3E+06
y = 3E+06x + 3E+06
y = 73517x + 65274
(5,000,000.00)
-
5,000,000.00
10,000,000.00
15,000,000.00
20,000,000.00
25,000,000.00
2009 2010 2011 2012 2013 2014
GROSS REVENUES, OP. EXPENSES, NET SURPLUS
GROSS REVENUE OPERATIONAL EXPENSES NET SURPLUS Linear (GROSS REVENUE) Linear (OPERATIONAL EXPENSES) Linear (NET SURPLUS)
13. ZAMBALES – Central Luzon – Assets:
43,104,680.32
y = 2E+06x + 256063
y = 2E+06x - 2E+06
y = -376531x + 2E+06
(5,000,000.00)
-
5,000,000.00
10,000,000.00
15,000,000.00
20,000,000.00
25,000,000.00
2008 2009 2010 2011 2012 2013 2014 2015
GROSS REVENUES, OP. EXPENSES, NET SURPLUS
GROSS REVENUE OPERATIONAL EXPENSES NET SURPLUS Linear (GROSS REVENUE) Linear (OPERATIONAL EXPENSES) Linear (NET SURPLUS)
14. BENGUET – Cordilleras Region – Assets:
1,610,048.80
y = -35586x + 345458
y = 9067x + 102439
y = -44653x + 243019
(100,000.00)
(50,000.00)
-
50,000.00
100,000.00
150,000.00
200,000.00
250,000.00
300,000.00
350,000.00
2009 2010 2011 2012 2013 2014 2015
AmountinPesos
Fiscal Year
Total Revenues, Expenses, Net Surplus
FY 2009-2015
REVENUES EXPENSES NET SURPLUS
Linear (REVENUES) Linear (EXPENSES) Linear (NET SURPLUS)
15. CAMARINES SUR – Bicol Region – Assets:
78,620,863.55
y = 2E+06x + 5E+06
y = 3E+06x + 5E+06
y = -135521x - 459732
(5,000,000.00)
-
5,000,000.00
10,000,000.00
15,000,000.00
20,000,000.00
25,000,000.00
30,000,000.00
2008 2009 2010 2011 2012 2013 2014
GROSS REVENUES, OP. EXPENSES, NET SURPLUS
GROSS REVENUE OPERATING EXPENSES NET SURPLUS Linear (GROSS REVENUE) Linear (OPERATING EXPENSES) Linear (NET SURPLUS)
16. BOHOL – Central Visayas – Assets:
140,581,203.40
y = 3E+06x + 1E+07
y = 2E+06x + 2E+07
y = 2E+06x - 6E+06
(20,000,000.00)
(10,000,000.00)
-
10,000,000.00
20,000,000.00
30,000,000.00
40,000,000.00
50,000,000.00
60,000,000.00
2010 2011 2012 2013 2014 2015
GROSS REVENUES, OP. EXPENSES, NET SURPLUS
GROSS REVENUE
OPERATIONAL EXPENSES
NET SURPLUS
Linear (GROSS REVENUE)
Linear (OPERATIONAL EXPENSES)
Linear (NET SURPLUS)
ASSETS PARETO CHART
TOTAL AVERAGE ASSETS 2010 – 2014 (16
CHAPTERS: 1,459,740,210.22
FIRST 80% OF ASSETS:
1,167,792,168.17
• QUEZON - 235,641,629.59
• PALAWAN - 159,757,223.69
• DAVAO DEL NORTE - 154,504,785.85
• BOHOL - 140,581,203.40
• SORSOGON - 140,391,421.85
• MINDORO ORIENTAL - 117,925,111.72
• BULACAN - 98,448,547.22
• METRO MANILA SOUTH -
93,967,057.00
REMAINDER 20% OF ASSETS:
291,948,042.04
• CAMARINES SUR - 78,620,863.55
• ALBAY - 49,287,235.85
• SOUTH COTABATO - 44,279,256.22
• ZAMBALES - 43,104,680.32
• AKLAN - 36,575,931.61
• ZAMBOANGA DEL NORTE -
35,091,781.53
• MASBATE - 29,953,432.02
• BENGUET - 1,610,048.80
General assembly april 23 24 presentation

More Related Content

Viewers also liked (16)

Fostering leadership & management competence
Fostering leadership & management competenceFostering leadership & management competence
Fostering leadership & management competence
 
Factoring
FactoringFactoring
Factoring
 
Actividad 1.4
Actividad 1.4Actividad 1.4
Actividad 1.4
 
Proyecto socioeducativo Diana y Sandra
Proyecto socioeducativo Diana y Sandra Proyecto socioeducativo Diana y Sandra
Proyecto socioeducativo Diana y Sandra
 
SOFA E_FILE
SOFA  E_FILESOFA  E_FILE
SOFA E_FILE
 
Vesna sertificates
Vesna sertificatesVesna sertificates
Vesna sertificates
 
Operational efficiency 12 mmg chapters
Operational efficiency 12 mmg chaptersOperational efficiency 12 mmg chapters
Operational efficiency 12 mmg chapters
 
3 neap presentation for tag july 2016
3 neap presentation for tag july 20163 neap presentation for tag july 2016
3 neap presentation for tag july 2016
 
Actividad 1.6
Actividad 1.6Actividad 1.6
Actividad 1.6
 
Actividad 1.4
Actividad 1.4Actividad 1.4
Actividad 1.4
 
Módulo 4-universidad-y-buen-vivir
Módulo 4-universidad-y-buen-vivirMódulo 4-universidad-y-buen-vivir
Módulo 4-universidad-y-buen-vivir
 
Actividad 1.3
Actividad 1.3Actividad 1.3
Actividad 1.3
 
TITPL-MICE (002)
TITPL-MICE (002)TITPL-MICE (002)
TITPL-MICE (002)
 
Must have voor uw frontdesk proxyclick
Must have voor uw frontdesk   proxyclickMust have voor uw frontdesk   proxyclick
Must have voor uw frontdesk proxyclick
 
Coloured movement joints
Coloured movement joints Coloured movement joints
Coloured movement joints
 
Mmg aklan
Mmg aklanMmg aklan
Mmg aklan
 

Similar to General assembly april 23 24 presentation

Ocean City 2014 budget workshop presentation
Ocean City 2014 budget workshop presentationOcean City 2014 budget workshop presentation
Ocean City 2014 budget workshop presentationOceanCityGazette
 
Aminullah assagaf mp2 manajemen proyek
Aminullah assagaf mp2 manajemen proyekAminullah assagaf mp2 manajemen proyek
Aminullah assagaf mp2 manajemen proyekAminullah Assagaf
 
Session 54 - Neighborhood Smart Trips: How Individualized Marketing Can Work ...
Session 54 - Neighborhood Smart Trips: How Individualized Marketing Can Work ...Session 54 - Neighborhood Smart Trips: How Individualized Marketing Can Work ...
Session 54 - Neighborhood Smart Trips: How Individualized Marketing Can Work ...Sharon Roerty
 
Example Draft Local Plan of Mersing
Example Draft Local Plan of MersingExample Draft Local Plan of Mersing
Example Draft Local Plan of MersingFARID YUNOS
 
Modelos economicos
Modelos economicosModelos economicos
Modelos economicosFrancoveliz
 
Mayo%202010 presupuesto centro
Mayo%202010 presupuesto centroMayo%202010 presupuesto centro
Mayo%202010 presupuesto centrowinstonrivera
 
Mayo de 2010 presupuesto centro
Mayo de 2010 presupuesto centroMayo de 2010 presupuesto centro
Mayo de 2010 presupuesto centrowinstonrivera
 
VET 4 T&L Roadshow - Cairns
VET 4 T&L Roadshow - CairnsVET 4 T&L Roadshow - Cairns
VET 4 T&L Roadshow - CairnsLinda MacDonald
 
Tentative Amendments to the 2014 Executive Budget Recommendation
Tentative Amendments to the 2014 Executive Budget RecommendationTentative Amendments to the 2014 Executive Budget Recommendation
Tentative Amendments to the 2014 Executive Budget Recommendationcookcountyblog
 
Ingeniero Álvaro Torres, Vicepresidente de Planeación del Grupo de Energía de...
Ingeniero Álvaro Torres, Vicepresidente de Planeación del Grupo de Energía de...Ingeniero Álvaro Torres, Vicepresidente de Planeación del Grupo de Energía de...
Ingeniero Álvaro Torres, Vicepresidente de Planeación del Grupo de Energía de...Cámara Colombiana de la Energía
 
VET 4 T&L Roadshow - Mackay
VET 4 T&L Roadshow - MackayVET 4 T&L Roadshow - Mackay
VET 4 T&L Roadshow - MackayLinda MacDonald
 
Webinar 6 | Aug-16 | Kopernik, Wonder Women, Sergina Loncle
Webinar 6 | Aug-16 | Kopernik, Wonder Women, Sergina Loncle Webinar 6 | Aug-16 | Kopernik, Wonder Women, Sergina Loncle
Webinar 6 | Aug-16 | Kopernik, Wonder Women, Sergina Loncle Smart Villages
 

Similar to General assembly april 23 24 presentation (20)

Ocean City 2014 budget workshop presentation
Ocean City 2014 budget workshop presentationOcean City 2014 budget workshop presentation
Ocean City 2014 budget workshop presentation
 
Aminullah assagaf mp2 manajemen proyek
Aminullah assagaf mp2 manajemen proyekAminullah assagaf mp2 manajemen proyek
Aminullah assagaf mp2 manajemen proyek
 
22 lra opd 2018
22 lra opd 201822 lra opd 2018
22 lra opd 2018
 
Session 54 - Neighborhood Smart Trips: How Individualized Marketing Can Work ...
Session 54 - Neighborhood Smart Trips: How Individualized Marketing Can Work ...Session 54 - Neighborhood Smart Trips: How Individualized Marketing Can Work ...
Session 54 - Neighborhood Smart Trips: How Individualized Marketing Can Work ...
 
Example Draft Local Plan of Mersing
Example Draft Local Plan of MersingExample Draft Local Plan of Mersing
Example Draft Local Plan of Mersing
 
Modelos economicos
Modelos economicosModelos economicos
Modelos economicos
 
Aminullah assagaf mk19 ch 5
Aminullah assagaf mk19 ch 5Aminullah assagaf mk19 ch 5
Aminullah assagaf mk19 ch 5
 
Lcap for schools
Lcap for schools   Lcap for schools
Lcap for schools
 
Mayo%202010 presupuesto centro
Mayo%202010 presupuesto centroMayo%202010 presupuesto centro
Mayo%202010 presupuesto centro
 
Mayo de 2010 presupuesto centro
Mayo de 2010 presupuesto centroMayo de 2010 presupuesto centro
Mayo de 2010 presupuesto centro
 
VET 4 T&L Roadshow - Cairns
VET 4 T&L Roadshow - CairnsVET 4 T&L Roadshow - Cairns
VET 4 T&L Roadshow - Cairns
 
2017 revised budget2
2017 revised budget22017 revised budget2
2017 revised budget2
 
Tentative Amendments to the 2014 Executive Budget Recommendation
Tentative Amendments to the 2014 Executive Budget RecommendationTentative Amendments to the 2014 Executive Budget Recommendation
Tentative Amendments to the 2014 Executive Budget Recommendation
 
Ingeniero Álvaro Torres, Vicepresidente de Planeación del Grupo de Energía de...
Ingeniero Álvaro Torres, Vicepresidente de Planeación del Grupo de Energía de...Ingeniero Álvaro Torres, Vicepresidente de Planeación del Grupo de Energía de...
Ingeniero Álvaro Torres, Vicepresidente de Planeación del Grupo de Energía de...
 
Revised 2018 budget new
Revised 2018 budget newRevised 2018 budget new
Revised 2018 budget new
 
Ring Road Concession Conference Call
Ring Road Concession Conference CallRing Road Concession Conference Call
Ring Road Concession Conference Call
 
Corporate presentation 2 q 14 v ff sa
Corporate presentation 2 q 14 v ff saCorporate presentation 2 q 14 v ff sa
Corporate presentation 2 q 14 v ff sa
 
VET 4 T&L Roadshow - Mackay
VET 4 T&L Roadshow - MackayVET 4 T&L Roadshow - Mackay
VET 4 T&L Roadshow - Mackay
 
Webinar 6 | Aug-16 | Kopernik, Wonder Women, Sergina Loncle
Webinar 6 | Aug-16 | Kopernik, Wonder Women, Sergina Loncle Webinar 6 | Aug-16 | Kopernik, Wonder Women, Sergina Loncle
Webinar 6 | Aug-16 | Kopernik, Wonder Women, Sergina Loncle
 
INGRESOS DE LA POLICIA NACIONAL DEL PERU
INGRESOS DE LA POLICIA NACIONAL DEL PERUINGRESOS DE LA POLICIA NACIONAL DEL PERU
INGRESOS DE LA POLICIA NACIONAL DEL PERU
 

More from Medical Mission Group

More from Medical Mission Group (9)

Mmg cam sur finances 2
Mmg cam sur finances 2Mmg cam sur finances 2
Mmg cam sur finances 2
 
Bohol powerpoint year end 2015 final
Bohol powerpoint year end 2015 finalBohol powerpoint year end 2015 final
Bohol powerpoint year end 2015 final
 
Audited fs hospital 2015 , ga 2016 summary
Audited fs hospital 2015 , ga 2016 summaryAudited fs hospital 2015 , ga 2016 summary
Audited fs hospital 2015 , ga 2016 summary
 
Ceo report
Ceo reportCeo report
Ceo report
 
Presentation4
Presentation4Presentation4
Presentation4
 
Board of directors toolkit final
Board of directors toolkit finalBoard of directors toolkit final
Board of directors toolkit final
 
5s good housekeeping
5s good housekeeping5s good housekeeping
5s good housekeeping
 
Sustainable development goals 2030
Sustainable development goals 2030Sustainable development goals 2030
Sustainable development goals 2030
 
Magis hospital information system
Magis hospital information systemMagis hospital information system
Magis hospital information system
 

Recently uploaded

HỌC TỐT TIẾNG ANH 11 THEO CHƯƠNG TRÌNH GLOBAL SUCCESS ĐÁP ÁN CHI TIẾT - CẢ NĂ...
HỌC TỐT TIẾNG ANH 11 THEO CHƯƠNG TRÌNH GLOBAL SUCCESS ĐÁP ÁN CHI TIẾT - CẢ NĂ...HỌC TỐT TIẾNG ANH 11 THEO CHƯƠNG TRÌNH GLOBAL SUCCESS ĐÁP ÁN CHI TIẾT - CẢ NĂ...
HỌC TỐT TIẾNG ANH 11 THEO CHƯƠNG TRÌNH GLOBAL SUCCESS ĐÁP ÁN CHI TIẾT - CẢ NĂ...Nguyen Thanh Tu Collection
 
ENGLISH 7_Q4_LESSON 2_ Employing a Variety of Strategies for Effective Interp...
ENGLISH 7_Q4_LESSON 2_ Employing a Variety of Strategies for Effective Interp...ENGLISH 7_Q4_LESSON 2_ Employing a Variety of Strategies for Effective Interp...
ENGLISH 7_Q4_LESSON 2_ Employing a Variety of Strategies for Effective Interp...JhezDiaz1
 
USPS® Forced Meter Migration - How to Know if Your Postage Meter Will Soon be...
USPS® Forced Meter Migration - How to Know if Your Postage Meter Will Soon be...USPS® Forced Meter Migration - How to Know if Your Postage Meter Will Soon be...
USPS® Forced Meter Migration - How to Know if Your Postage Meter Will Soon be...Postal Advocate Inc.
 
ENGLISH6-Q4-W3.pptxqurter our high choom
ENGLISH6-Q4-W3.pptxqurter our high choomENGLISH6-Q4-W3.pptxqurter our high choom
ENGLISH6-Q4-W3.pptxqurter our high choomnelietumpap1
 
4.18.24 Movement Legacies, Reflection, and Review.pptx
4.18.24 Movement Legacies, Reflection, and Review.pptx4.18.24 Movement Legacies, Reflection, and Review.pptx
4.18.24 Movement Legacies, Reflection, and Review.pptxmary850239
 
Gas measurement O2,Co2,& ph) 04/2024.pptx
Gas measurement O2,Co2,& ph) 04/2024.pptxGas measurement O2,Co2,& ph) 04/2024.pptx
Gas measurement O2,Co2,& ph) 04/2024.pptxDr.Ibrahim Hassaan
 
Influencing policy (training slides from Fast Track Impact)
Influencing policy (training slides from Fast Track Impact)Influencing policy (training slides from Fast Track Impact)
Influencing policy (training slides from Fast Track Impact)Mark Reed
 
ECONOMIC CONTEXT - PAPER 1 Q3: NEWSPAPERS.pptx
ECONOMIC CONTEXT - PAPER 1 Q3: NEWSPAPERS.pptxECONOMIC CONTEXT - PAPER 1 Q3: NEWSPAPERS.pptx
ECONOMIC CONTEXT - PAPER 1 Q3: NEWSPAPERS.pptxiammrhaywood
 
Choosing the Right CBSE School A Comprehensive Guide for Parents
Choosing the Right CBSE School A Comprehensive Guide for ParentsChoosing the Right CBSE School A Comprehensive Guide for Parents
Choosing the Right CBSE School A Comprehensive Guide for Parentsnavabharathschool99
 
ANG SEKTOR NG agrikultura.pptx QUARTER 4
ANG SEKTOR NG agrikultura.pptx QUARTER 4ANG SEKTOR NG agrikultura.pptx QUARTER 4
ANG SEKTOR NG agrikultura.pptx QUARTER 4MiaBumagat1
 
Inclusivity Essentials_ Creating Accessible Websites for Nonprofits .pdf
Inclusivity Essentials_ Creating Accessible Websites for Nonprofits .pdfInclusivity Essentials_ Creating Accessible Websites for Nonprofits .pdf
Inclusivity Essentials_ Creating Accessible Websites for Nonprofits .pdfTechSoup
 
THEORIES OF ORGANIZATION-PUBLIC ADMINISTRATION
THEORIES OF ORGANIZATION-PUBLIC ADMINISTRATIONTHEORIES OF ORGANIZATION-PUBLIC ADMINISTRATION
THEORIES OF ORGANIZATION-PUBLIC ADMINISTRATIONHumphrey A Beña
 
Q4 English4 Week3 PPT Melcnmg-based.pptx
Q4 English4 Week3 PPT Melcnmg-based.pptxQ4 English4 Week3 PPT Melcnmg-based.pptx
Q4 English4 Week3 PPT Melcnmg-based.pptxnelietumpap1
 
Visit to a blind student's school🧑‍🦯🧑‍🦯(community medicine)
Visit to a blind student's school🧑‍🦯🧑‍🦯(community medicine)Visit to a blind student's school🧑‍🦯🧑‍🦯(community medicine)
Visit to a blind student's school🧑‍🦯🧑‍🦯(community medicine)lakshayb543
 
Grade 9 Q4-MELC1-Active and Passive Voice.pptx
Grade 9 Q4-MELC1-Active and Passive Voice.pptxGrade 9 Q4-MELC1-Active and Passive Voice.pptx
Grade 9 Q4-MELC1-Active and Passive Voice.pptxChelloAnnAsuncion2
 
AMERICAN LANGUAGE HUB_Level2_Student'sBook_Answerkey.pdf
AMERICAN LANGUAGE HUB_Level2_Student'sBook_Answerkey.pdfAMERICAN LANGUAGE HUB_Level2_Student'sBook_Answerkey.pdf
AMERICAN LANGUAGE HUB_Level2_Student'sBook_Answerkey.pdfphamnguyenenglishnb
 
Roles & Responsibilities in Pharmacovigilance
Roles & Responsibilities in PharmacovigilanceRoles & Responsibilities in Pharmacovigilance
Roles & Responsibilities in PharmacovigilanceSamikshaHamane
 

Recently uploaded (20)

HỌC TỐT TIẾNG ANH 11 THEO CHƯƠNG TRÌNH GLOBAL SUCCESS ĐÁP ÁN CHI TIẾT - CẢ NĂ...
HỌC TỐT TIẾNG ANH 11 THEO CHƯƠNG TRÌNH GLOBAL SUCCESS ĐÁP ÁN CHI TIẾT - CẢ NĂ...HỌC TỐT TIẾNG ANH 11 THEO CHƯƠNG TRÌNH GLOBAL SUCCESS ĐÁP ÁN CHI TIẾT - CẢ NĂ...
HỌC TỐT TIẾNG ANH 11 THEO CHƯƠNG TRÌNH GLOBAL SUCCESS ĐÁP ÁN CHI TIẾT - CẢ NĂ...
 
FINALS_OF_LEFT_ON_C'N_EL_DORADO_2024.pptx
FINALS_OF_LEFT_ON_C'N_EL_DORADO_2024.pptxFINALS_OF_LEFT_ON_C'N_EL_DORADO_2024.pptx
FINALS_OF_LEFT_ON_C'N_EL_DORADO_2024.pptx
 
ENGLISH 7_Q4_LESSON 2_ Employing a Variety of Strategies for Effective Interp...
ENGLISH 7_Q4_LESSON 2_ Employing a Variety of Strategies for Effective Interp...ENGLISH 7_Q4_LESSON 2_ Employing a Variety of Strategies for Effective Interp...
ENGLISH 7_Q4_LESSON 2_ Employing a Variety of Strategies for Effective Interp...
 
USPS® Forced Meter Migration - How to Know if Your Postage Meter Will Soon be...
USPS® Forced Meter Migration - How to Know if Your Postage Meter Will Soon be...USPS® Forced Meter Migration - How to Know if Your Postage Meter Will Soon be...
USPS® Forced Meter Migration - How to Know if Your Postage Meter Will Soon be...
 
ENGLISH6-Q4-W3.pptxqurter our high choom
ENGLISH6-Q4-W3.pptxqurter our high choomENGLISH6-Q4-W3.pptxqurter our high choom
ENGLISH6-Q4-W3.pptxqurter our high choom
 
4.18.24 Movement Legacies, Reflection, and Review.pptx
4.18.24 Movement Legacies, Reflection, and Review.pptx4.18.24 Movement Legacies, Reflection, and Review.pptx
4.18.24 Movement Legacies, Reflection, and Review.pptx
 
Gas measurement O2,Co2,& ph) 04/2024.pptx
Gas measurement O2,Co2,& ph) 04/2024.pptxGas measurement O2,Co2,& ph) 04/2024.pptx
Gas measurement O2,Co2,& ph) 04/2024.pptx
 
Influencing policy (training slides from Fast Track Impact)
Influencing policy (training slides from Fast Track Impact)Influencing policy (training slides from Fast Track Impact)
Influencing policy (training slides from Fast Track Impact)
 
ECONOMIC CONTEXT - PAPER 1 Q3: NEWSPAPERS.pptx
ECONOMIC CONTEXT - PAPER 1 Q3: NEWSPAPERS.pptxECONOMIC CONTEXT - PAPER 1 Q3: NEWSPAPERS.pptx
ECONOMIC CONTEXT - PAPER 1 Q3: NEWSPAPERS.pptx
 
Choosing the Right CBSE School A Comprehensive Guide for Parents
Choosing the Right CBSE School A Comprehensive Guide for ParentsChoosing the Right CBSE School A Comprehensive Guide for Parents
Choosing the Right CBSE School A Comprehensive Guide for Parents
 
LEFT_ON_C'N_ PRELIMS_EL_DORADO_2024.pptx
LEFT_ON_C'N_ PRELIMS_EL_DORADO_2024.pptxLEFT_ON_C'N_ PRELIMS_EL_DORADO_2024.pptx
LEFT_ON_C'N_ PRELIMS_EL_DORADO_2024.pptx
 
ANG SEKTOR NG agrikultura.pptx QUARTER 4
ANG SEKTOR NG agrikultura.pptx QUARTER 4ANG SEKTOR NG agrikultura.pptx QUARTER 4
ANG SEKTOR NG agrikultura.pptx QUARTER 4
 
Inclusivity Essentials_ Creating Accessible Websites for Nonprofits .pdf
Inclusivity Essentials_ Creating Accessible Websites for Nonprofits .pdfInclusivity Essentials_ Creating Accessible Websites for Nonprofits .pdf
Inclusivity Essentials_ Creating Accessible Websites for Nonprofits .pdf
 
THEORIES OF ORGANIZATION-PUBLIC ADMINISTRATION
THEORIES OF ORGANIZATION-PUBLIC ADMINISTRATIONTHEORIES OF ORGANIZATION-PUBLIC ADMINISTRATION
THEORIES OF ORGANIZATION-PUBLIC ADMINISTRATION
 
Q4 English4 Week3 PPT Melcnmg-based.pptx
Q4 English4 Week3 PPT Melcnmg-based.pptxQ4 English4 Week3 PPT Melcnmg-based.pptx
Q4 English4 Week3 PPT Melcnmg-based.pptx
 
Visit to a blind student's school🧑‍🦯🧑‍🦯(community medicine)
Visit to a blind student's school🧑‍🦯🧑‍🦯(community medicine)Visit to a blind student's school🧑‍🦯🧑‍🦯(community medicine)
Visit to a blind student's school🧑‍🦯🧑‍🦯(community medicine)
 
Model Call Girl in Tilak Nagar Delhi reach out to us at 🔝9953056974🔝
Model Call Girl in Tilak Nagar Delhi reach out to us at 🔝9953056974🔝Model Call Girl in Tilak Nagar Delhi reach out to us at 🔝9953056974🔝
Model Call Girl in Tilak Nagar Delhi reach out to us at 🔝9953056974🔝
 
Grade 9 Q4-MELC1-Active and Passive Voice.pptx
Grade 9 Q4-MELC1-Active and Passive Voice.pptxGrade 9 Q4-MELC1-Active and Passive Voice.pptx
Grade 9 Q4-MELC1-Active and Passive Voice.pptx
 
AMERICAN LANGUAGE HUB_Level2_Student'sBook_Answerkey.pdf
AMERICAN LANGUAGE HUB_Level2_Student'sBook_Answerkey.pdfAMERICAN LANGUAGE HUB_Level2_Student'sBook_Answerkey.pdf
AMERICAN LANGUAGE HUB_Level2_Student'sBook_Answerkey.pdf
 
Roles & Responsibilities in Pharmacovigilance
Roles & Responsibilities in PharmacovigilanceRoles & Responsibilities in Pharmacovigilance
Roles & Responsibilities in Pharmacovigilance
 

General assembly april 23 24 presentation

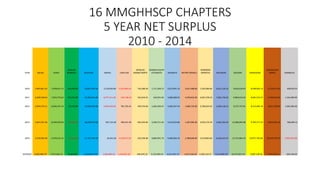
  • 1. 16 MMGHHSCP CHAPTERS 5 YEAR NET SURPLUS 2010 - 2014 YEAR AKLAN ALBAY BAGUIO BENGUET BULACAN BOHOL CAM SUR DIPOLOG ZAMBO NORTE GENSAN SOUTH COTABATO MASBATE METRO MANILA MINDORO ORIENTAL PALAWAN QUEZON SORSOGON TAGUM DVO NORTE ZAMBALES 2010 3,967,851.43 7,678,811.75 150,940.00 10,847,297.00 2,124,639.00 - 3,301,069.54 734,380.49 1,711,369.13 4,013,991.19 3,637,488.00 7,242,006.84 6,631,120.33 9,624,618.45 8,598,965.14 5,129,971.63 390,024.97 2011 4,293,540.63 7,923,773.62 174,255.00 13,784,616.00 - 6,977,411.00 - 539,138.42 243,454.91 443,021.69 3,086,000.93 5,976,832.00 4,607,378.33 7,281,736.02 9,894,014.03 8,001,572.57 4,760,619.05 1,334,289.99 2012 2,993,274.11 8,656,347.24 55,252.00 14,590,059.00 - 4,003,036.00 781,703.42 340,754.66 1,602,402.67 4,466,547.44 1,686,720.00 3,700,624.65 5,266,118.21 9,275,747.81 8,153,485.34 9,611,750.60 1,962,280.40 2013 3,641,437.26 8,520,078.93 - 58,954.00 18,240,670.00 907,121.00 396,415.49 692,264.84 5,040,711.50 3,519,034.86 1,407,084.00 3,876,176.70 5,464,183.44 12,086,892.88 9,703,771.55 9,603,255.58 786,690.13 2014 4,735,945.50 4,579,214.12 - 12,374.00 17,127,744.39 44,241.00 - 3,150,917.24 222,536.68 9,864,991.73 5,069,902.34 2,398,668.00 3,519,863.82 6,430,143.47 12,757,804.53 10,977,750.68 10,252,379.70 - 2,992,543.00 AVERAGE 3,926,409.79 7,471,645.13 61,823.80 14,918,077.28 - 1,580,889.20 - 1,162,601.26 446,678.32 3,732,499.34 4,031,095.35 3,021,358.40 4,589,210.07 6,214,660.29 10,727,815.54 9,087,109.06 7,871,595.31 296,148.50
  • 2. AKLAN ALBAY BAGUIO BENGUET BULACAN BOHOL CAM SUR DIPOLOG ZAMBO NORTE GENSAN SOUTH COTABATO MASBATE METRO MANILA MINDORO ORIENTAL PALAWAN QUEZON SORSOGON TAGUM DVO NORTE ZAMBALES 3,926,409.79 7,471,645.13 61,823.80 14,918,077.28 - 1,580,889.20- 1,162,601.26 446,678.32 3,732,499.34 4,031,095.35 3,021,358.40 4,589,210.07 6,214,660.29 10,727,815.54 9,087,109.06 7,871,595.31296,148.50
  • 3. CHAPTERS OF THE FIRST ORDER • 1. BULACAN – Central Tagalog Region – Assets: 98,448,547.22 • 2. QUEZON – Southern Tagalog Region – Assets: 235,641,629.59 • 3. SORSOGON – Bicol Region – Assets: 140,391,421.85 • 4. DAVAO DEL NORTE – South East Mindanao – Assets: 154,504,785.85 • 5. ALBAY – Bicol Region – Assets: 49,287,235.85 • 6. PALAWAN – Mimaropa Region – Assets: 159,757,223.69
  • 4. 1. BULACAN – Central Tagalog Region – Assets: 98,448,547.22 y = 6E+06x + 2E+07 y = 4E+06x + 1E+07 y = 2E+06x + 5E+06 - 10,000,000.00 20,000,000.00 30,000,000.00 40,000,000.00 50,000,000.00 60,000,000.00 70,000,000.00 2008 2009 2010 2011 2012 2013 2014 TOTAL REVENUES, EXPENSES, SURPLUS FY 2008 - 2014 GROSS REVENUE OPERATIONAL EXPENSES NET SURPLUS Linear (GROSS REVENUE) Linear (OPERATIONAL EXPENSES) Linear (NET SURPLUS)
  • 5. 2. QUEZON – Southern Tagalog Region – Assets: 235,641,629.59 y = 9E+06x + 2E+08 y = 9E+06x + 2E+08 y = 696700x + 7E+06 - 50,000,000.00 100,000,000.00 150,000,000.00 200,000,000.00 250,000,000.00 300,000,000.00 2008 2009 2010 2011 2012 2013 2014 GROSS REVENUES, OP. EXPENSES, NET SURPLUS REVENUE EXPENSES NET INCOME Linear ( REVENUE) Linear (EXPENSES) Linear (NET INCOME)
  • 6. 3. SORSOGON – Bicol Region – Assets: 140,391,421.85 y = 9E+06x + 8E+07 y = 8E+06x + 7E+07 y = 507077x + 7E+06 - 20,000,000.00 40,000,000.00 60,000,000.00 80,000,000.00 100,000,000.00 120,000,000.00 140,000,000.00 160,000,000.00 2008 2009 2010 2011 2012 2013 2014 TOTAL REVENUES, EXPENSES, SURPLUS FY 2008-2014 GROSS REVENUE OPERATING EXPENSES NET SURPLUS Linear (GROSS REVENUE) Linear (OPERATING EXPENSES) Linear (NET SURPLUS)
  • 7. 4. DAVAO DEL NORTE – South East Mindanao – Assets: 154,504,785.85 y = 1E+07x + 7E+07 y = 9E+06x + 7E+07 y = 2E+06x + 168611 - 20,000,000.00 40,000,000.00 60,000,000.00 80,000,000.00 100,000,000.00 120,000,000.00 140,000,000.00 160,000,000.00 2008 2009 2010 2011 2012 2013 2014 GROSS REVENUES, OP. EXPENSES, NET SURPLUS REVENUE EXPENSES NET SURPLUS Linear ( REVENUE) Linear (EXPENSES) Linear (NET SURPLUS)
  • 8. 5. ALBAY – Bicol Region – Assets: 49,287,235.85 y = -902921x + 2E+07 y = -342632x + 2E+07 y = -560289x + 9E+06 - 5,000,000.00 10,000,000.00 15,000,000.00 20,000,000.00 25,000,000.00 30,000,000.00 2010 2011 2012 2013 2014 GROSS REVENUE, OP. EXPENSES, NET SURPLUS GROSS REVENUE OPERATIONAL EXPENSES NET SURPLUS Linear (GROSS REVENUE) Linear (OPERATIONAL EXPENSES) Linear (NET SURPLUS)
  • 9. 6. PALAWAN – Mimaropa Region – Assets: 159,757,223.69 y = 1E+07x + 2E+07 y = 1E+07x + 6E+06 y = -486560x + 9E+06 0.00 20,000,000.00 40,000,000.00 60,000,000.00 80,000,000.00 100,000,000.00 120,000,000.00 2008 2009 2010 2011 2012 2013 2014 ANNUAL REVENUES ANNUAL EXPENSES ANNUAL NET OPERATING INCOME Linear (ANNUAL REVENUES) Linear (ANNUAL EXPENSES) Linear (ANNUAL NET OPERATING INCOME) REVENUES, OP. EXPENSES, NET SURPLUS
  • 10. AKLAN BAGUIO BENGUET BOHOL CAM SUR DIPOLOG ZAMBO NORTE GENSAN SOUTH COTABATO MASBATE METRO MANILA MINDORO ORIENTAL ZAMBALES 3,926,409.79 61,823.80 - 1,580,889.20 - 1,162,601.26 446,678.32 3,732,499.34 4,031,095.35 3,021,358.40 4,589,210.07 296,148.50
  • 11. CHAPTERS OF THE SECOND ORDER • 7. MINDORO ORIENTAL – Mimaropa Region – Assets: 117,925,111.72 • 8. MASBATE – Mimaropa Region – Assets: 29,953,432.02 • 9. AKLAN – Western Visayas Region – Assets: 36,575,931.61 • 10. SOUTH COTABATO – South Central Mindanao – Assets: 44,279,256.22
  • 12. 7. MINDORO ORIENTAL – Mimaropa Region – Assets: 117,925,111.72 y = 9E+06x + 2E+07 y = 1E+07x + 2E+07 y = -853809x + 9E+06 - 10,000,000.00 20,000,000.00 30,000,000.00 40,000,000.00 50,000,000.00 60,000,000.00 70,000,000.00 80,000,000.00 90,000,000.00 100,000,000.00 2008 2009 2010 2011 2012 2013 2014 AmountinPesos Fiscal Year Total Revenues, Expenses, Net Surplus FY 2008-2014 REVENUES EXPENSES NET SURPLUS Linear (REVENUES) Linear (EXPENSES) Linear (NET SURPLUS)
  • 13. 8. MASBATE – Mimaropa Region – Assets: 29,953,432.02 y = 3E+06x + 1E+07 y = 3E+06x + 1E+07 y = 861511x - 364399 - 5,000,000.00 10,000,000.00 15,000,000.00 20,000,000.00 25,000,000.00 30,000,000.00 35,000,000.00 40,000,000.00 45,000,000.00 2008 2009 2010 2011 2012 2013 2014 2015 GROSS REVENUES, OP. EXPENSES, NET SURPLUS GROSS REVENUE OPERATIONAL EXPENSES NET SURPLUS Linear (GROSS REVENUE) Linear (OPERATIONAL EXPENSES) Linear (NET SURPLUS)
  • 14. 9. AKLAN – Western Visayas Region – Assets: 36,575,931.61 y = 1E+06x + 4E+06 y = 877936x + 3E+06 y = 465336x + 1E+06 - 2,000,000.00 4,000,000.00 6,000,000.00 8,000,000.00 10,000,000.00 12,000,000.00 14,000,000.00 16,000,000.00 2008 2009 2010 2011 2012 2013 2014 GROSS REVENUE, OP. EXPENSES, NET SURPLUS GROSS REVENUE OPERATING EXPENSES NET SURPLUS Linear (GROSS REVENUE) Linear (OPERATING EXPENSES) Linear (NET SURPLUS)
  • 15. 10. SOUTH COTABATO – South Central Mindanao – Assets: 44,279,256.22 0 5000000 10000000 15000000 20000000 25000000 30000000 35000000 1 2 3 4 5 6 Chart Title YEAR GROSS REVENUE OPERATIONAL EXPENSES NET SURPLUS
  • 16. BAGUIO BENGUET BOHOL CAMSUR DIPOLOG ZAMBO NORTE METRO MANILA ZAMBALES 61,823.80 1,580,889.20- 1,162,601.26- 446,678.32 3,021,358.40 296,148.50
  • 17. CHAPTERS OF THE THIRD ORDER • 11. METRO MANILA SOUTH – National Capital Region – Assets: 93,967,057.00 • 12. ZAMBOANGA DEL NORTE – North Western Mindanao- Assets: 35,091,781.53 • 13. ZAMBALES – Central Luzon – Assets: 43,104,680.32 • 14. BENGUET – Cordilleras Region – Assets: 1,610,048.80 • 15. CAMARINES SUR – Bicol Region – Assets: 78,620,863.55 • 16. BOHOL – Central Visayas – Assets: 140,581,203.40
  • 18. 11. METRO MANILA SOUTH – National Capital Region – Assets: 93,967,057.00 y = 6E+06x + 3E+07 y = 7E+06x + 2E+07 y = -704739x + 5E+06 0 10000000 20000000 30000000 40000000 50000000 60000000 70000000 2010 2011 2012 2013 2014 GROSS REVENUES, OP. EXPENSES, NET SURPLUS GROSS REVENUE OPERATIONAL EXPENSES NET SURPLUS Linear (GROSS REVENUE) Linear (OPERATIONAL EXPENSES) Linear (NET SURPLUS)
  • 19. 12. ZAMBOANGA DEL NORTE – North Western Mindanao- Assets: 35,091,781.53 y = 3E+06x + 3E+06 y = 3E+06x + 3E+06 y = 73517x + 65274 (5,000,000.00) - 5,000,000.00 10,000,000.00 15,000,000.00 20,000,000.00 25,000,000.00 2009 2010 2011 2012 2013 2014 GROSS REVENUES, OP. EXPENSES, NET SURPLUS GROSS REVENUE OPERATIONAL EXPENSES NET SURPLUS Linear (GROSS REVENUE) Linear (OPERATIONAL EXPENSES) Linear (NET SURPLUS)
  • 20. 13. ZAMBALES – Central Luzon – Assets: 43,104,680.32 y = 2E+06x + 256063 y = 2E+06x - 2E+06 y = -376531x + 2E+06 (5,000,000.00) - 5,000,000.00 10,000,000.00 15,000,000.00 20,000,000.00 25,000,000.00 2008 2009 2010 2011 2012 2013 2014 2015 GROSS REVENUES, OP. EXPENSES, NET SURPLUS GROSS REVENUE OPERATIONAL EXPENSES NET SURPLUS Linear (GROSS REVENUE) Linear (OPERATIONAL EXPENSES) Linear (NET SURPLUS)
  • 21. 14. BENGUET – Cordilleras Region – Assets: 1,610,048.80 y = -35586x + 345458 y = 9067x + 102439 y = -44653x + 243019 (100,000.00) (50,000.00) - 50,000.00 100,000.00 150,000.00 200,000.00 250,000.00 300,000.00 350,000.00 2009 2010 2011 2012 2013 2014 2015 AmountinPesos Fiscal Year Total Revenues, Expenses, Net Surplus FY 2009-2015 REVENUES EXPENSES NET SURPLUS Linear (REVENUES) Linear (EXPENSES) Linear (NET SURPLUS)
  • 22. 15. CAMARINES SUR – Bicol Region – Assets: 78,620,863.55 y = 2E+06x + 5E+06 y = 3E+06x + 5E+06 y = -135521x - 459732 (5,000,000.00) - 5,000,000.00 10,000,000.00 15,000,000.00 20,000,000.00 25,000,000.00 30,000,000.00 2008 2009 2010 2011 2012 2013 2014 GROSS REVENUES, OP. EXPENSES, NET SURPLUS GROSS REVENUE OPERATING EXPENSES NET SURPLUS Linear (GROSS REVENUE) Linear (OPERATING EXPENSES) Linear (NET SURPLUS)
  • 23. 16. BOHOL – Central Visayas – Assets: 140,581,203.40 y = 3E+06x + 1E+07 y = 2E+06x + 2E+07 y = 2E+06x - 6E+06 (20,000,000.00) (10,000,000.00) - 10,000,000.00 20,000,000.00 30,000,000.00 40,000,000.00 50,000,000.00 60,000,000.00 2010 2011 2012 2013 2014 2015 GROSS REVENUES, OP. EXPENSES, NET SURPLUS GROSS REVENUE OPERATIONAL EXPENSES NET SURPLUS Linear (GROSS REVENUE) Linear (OPERATIONAL EXPENSES) Linear (NET SURPLUS)
  • 25. TOTAL AVERAGE ASSETS 2010 – 2014 (16 CHAPTERS: 1,459,740,210.22 FIRST 80% OF ASSETS: 1,167,792,168.17 • QUEZON - 235,641,629.59 • PALAWAN - 159,757,223.69 • DAVAO DEL NORTE - 154,504,785.85 • BOHOL - 140,581,203.40 • SORSOGON - 140,391,421.85 • MINDORO ORIENTAL - 117,925,111.72 • BULACAN - 98,448,547.22 • METRO MANILA SOUTH - 93,967,057.00 REMAINDER 20% OF ASSETS: 291,948,042.04 • CAMARINES SUR - 78,620,863.55 • ALBAY - 49,287,235.85 • SOUTH COTABATO - 44,279,256.22 • ZAMBALES - 43,104,680.32 • AKLAN - 36,575,931.61 • ZAMBOANGA DEL NORTE - 35,091,781.53 • MASBATE - 29,953,432.02 • BENGUET - 1,610,048.80