A Critique of the Proposed National Education Policy Reform
Simulation of Rotary Cement Kilns Using a One-Dimensional Model
1. SIMULATION OF ROTARY CEMENT KILNS USING
A ONE-DIMENSIONAL MODEL
K. S. MUJUMDAR1,2
and V. V. RANADE1
1
Industrial Flow Modeling Group, National Chemical Laboratory, Pune, India
2
Department of Chemical Engineering, Indian Institute of Technology–Bombay, Powai, Mumbai, India
R
otary kilns are used to convert calcineous raw meal into cement clinkers. In this paper
we present a one-dimensional model to simulate key processes occurring in solid bed
of cement kilns. Solid–solid reactions occurring in cement kilns were modelled with
a pseudo-homogeneous approximation. Variation of bed height and melt formation in burner
zone within the kiln was accounted for. Energy balance (including conductive, convective and
radiative heat transfer) was solved based on a quasi-steady state approximation. The math-
ematical model was first applied to a rotary calciner. The model predictions were verified
by comparing them with the published experimental data. The model was then used to
simulate performance of three industrial kilns. Numerical experiments were carried out to
investigate influence of key operating and design parameters on energy consumption of
kilns. The model was also used to explore the possibility of manipulating temperature profile
within the kiln to reduce energy consumption in kiln per ton of clinker. Apart from providing
a computationally efficient tool to simulate kiln performance, the model and the results dis-
cussed here will provide a useful basis for the development of comprehensive three-dimen-
sional models of rotary cement kilns.
Keywords: rotary cement kiln; calcination; clinker; one-dimensional model.
INTRODUCTION
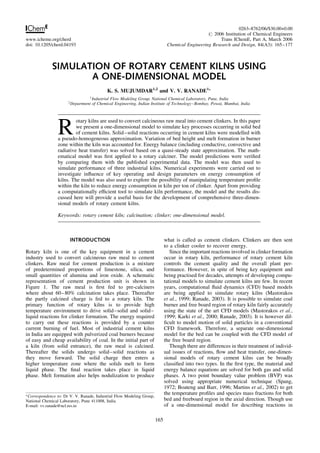
Rotary kiln is one of the key equipment in a cement
industry used to convert calcineous raw meal to cement
clinkers. Raw meal for cement production is a mixture
of predetermined proportions of limestone, silica, and
small quantities of alumina and iron oxide. A schematic
representation of cement production unit is shown in
Figure 1. The raw meal is first fed to pre-calciners
where about 60–80% calcination takes place. Thereafter
the partly calcined charge is fed to a rotary kiln. The
primary function of rotary kilns is to provide high
temperature environment to drive solid–solid and solid–
liquid reactions for clinker formation. The energy required
to carry out these reactions is provided by a counter
current burning of fuel. Most of industrial cement kilns
in India are equipped with pulverized coal burners because
of easy and cheap availability of coal. In the initial part of
a kiln (from solid entrance), the raw meal is calcined.
Thereafter the solids undergo solid–solid reactions as
they move forward. The solid charge then enters a
higher temperature zone where the solids melt to form
liquid phase. The final reaction takes place in liquid
phase. Melt formation also helps nodulization to produce
what is called as cement clinkers. Clinkers are then sent
to a clinker cooler to recover energy.
Since the important reactions involved in clinker formation
occur in rotary kiln, performance of rotary cement kiln
controls the cement quality and the overall plant per-
formance. However, in spite of being key equipment and
being practised for decades, attempts of developing compu-
tational models to simulate cement kilns are few. In recent
years, computational fluid dynamics (CFD) based models
are being applied to simulate rotary kilns (Mastorakos
et al., 1999; Ranade, 2003). It is possible to simulate coal
burner and free board region of rotary kiln fairly accurately
using the state of the art CFD models (Mastorakos et al.,
1999; Karki et al., 2000; Ranade, 2003). It is however dif-
ficult to model motion of solid particles in a conventional
CFD framework. Therefore, a separate one-dimensional
model for the bed can be coupled with the CFD model of
the free board region.
Though there are differences in their treatment of individ-
ual issues of reactions, flow and heat transfer, one-dimen-
sional models of rotary cement kilns can be broadly
classified into two types. In the first type, the material and
energy balance equations are solved for both gas and solid
phases. A two point boundary value problem (BVP) was
solved using appropriate numerical technique (Spang,
1972; Boateng and Barr, 1996; Martins et al., 2002) to get
the temperature profiles and species mass fractions for both
bed and freeboard region in the axial direction. Though use
of a one-dimensional model for describing reactions in
Correspondence to: Dr V. V. Ranade, Industrial Flow Modeling Group,
National Chemical Laboratory, Pune 411008, India.
E-mail: vv.ranade@ncl.res.in
165
0263–8762/06/$30.00+0.00
# 2006 Institution of Chemical Engineers
www.icheme.org/cherd Trans IChemE, Part A, March 2006
doi: 10.1205/cherd.04193 Chemical Engineering Research and Design, 84(A3): 165–177
2. solid bed is reasonable, use of such a one-dimensional model
for the free board region of a kiln is questionable. The burners
used in industrial kilns generate complex three-dimensional
flow. It is difficult to capture the complex flow and reactions
occurring at the burner and the free board region using a one-
dimensional model. The significant difference in time scales
of gas and solid velocities may cause numerical instabilities
in solution of such models.
In the second type of models, one-dimensional model is
used to simulate reactions in the bed region. For the free
board region, either experimental data or a detailed
three-dimensional CFD based model is used (see e.g.,
Mastorakos et al., 1999; Paul et al., 2002). Once the
temperature profile for gas phase (in free board region) is
known, the two-point boundary value problem reduces to
a simple initial value problem. Of course, the solution
of the free board region model depends on temperature of
the solid bed. Therefore, iterative approach involving
sequential solution of free board region (CFD based 3D
model) and solid bed region (1D model) models is used
(see e.g., Mastorakos et al., 1999; Ranade, 2003). Consid-
ering the recent advances in CFD techniques, it is now
possible to simulate complex 3D flow and reactions occur-
ring in free board in a reasonable time. Therefore, the
second approach involving coupling of a one-dimensional
model for the solid bed with the three-dimensional CFD
models for the free board region appears to be promising
for simulating industrial cement kilns.
Mastorakos et al. (1999) have reported such a model in
which a comprehensive CFD based model for freeboard
was coupled with 1d bed model. However, the bed model
presented by Mastorakos et al. (1999) assumed a uniform
height of solids in the kiln and the height of solids in the
bed was an input parameter. The bed height in rotary
kilns (which controls exposed area of the bed to the free
board and residence time of solids in the kiln) is a function
of kiln operating conditions and design parameters like
kiln RPM, solids flow rate to the kiln, kiln dimensions,
kiln tilt and so on (Lebas et al., 1995). Obviously the
model of Mastorakos et al. (1999) cannot capture influence
of changes in operating and design parameters on kiln per-
formance and therefore its utility will be rather restricted.
In addition, Mastorakos et al. (1999) used an approximate
model for melt formation and assumed a uniform coating
inside the kiln. Hence their model was not able to capture
the partial re-solidification of melt near the kiln exit
because of reduction in bed temperature. In reality, the
melt formation depends on bed temperature profile and
there will be a portion of kiln where no melt formation
occurs and therefore there is no internal coating in kiln.
Incorrect consideration of coating formation could lead to
significant errors in the calculations of shell temperature
and heat losses from the kiln shell. Therefore, model of
Mastorakos et al. (1999) could not predict the sharp fall
(.2008C) in shell temperature at the point from which
coating formation starts. Such discontinuities in shell
temperatures have been reported for industrial kilns (See
Kolyfetis and Markatos, 1996). Since Mastorakos et al.
(1999) assumed a uniform coating throughout the kiln
length, the net losses (about 7–10% of total energy input)
reported by Mastorakos et al. (1999) seem to be significantly
lower than the industry norms. This clearly brings out the
need for developing better models of the kiln bed, which
can capture influence of key design and operating parameters
on kiln performance. Such an attempt is made here.
We have developed a one-dimensional reaction-
engineering model for simulating the cement kiln. The
model accounts for variation of bed height as a function
of kiln operating conditions and solid properties. Unlike
Mastorakos et al. (1999) the present model considers
non-uniform coating within the kiln by appropriate model-
ling of melt formation. The model can be coupled explicitly
with the CFD model of the freeboard region (as Mastorakos
et al., 1999; Ranade, 2003). Other than complimenting the
CFD model, the presented model can also be used indepen-
dently to simulate overall performance of rotary cement
kilns. In such a mode, the model uses ‘maximum flame
temperature’ as an adjustable parameter instead of solving
the free board model. The computational model was first
validated by comparing predicted results with published
data obtained from laboratory scale calciner. The model
was then shown to simulate industrial kilns. The model
presented here requires orders of magnitude lower compu-
tational resources and will be useful to explore various
ideas for enhancing performance of cement kilns. Some
such possible applications are illustrated. Before discussing
the computational model and the results, key issues in
modelling of rotary cement kilns and previous work related
to these issues are briefly reviewed.
KEY ISSUES IN MODELLING ROTARY CEMENT KILNS
Various processes occurring in rotary cement kilns need
to be adequately considered while developing its math-
ematical model. Key issues governing the performance of
rotary kilns are shown schematically in Figure 2. A par-
tially calcined raw meal enters the kiln with a certain
flow rate. It is important to develop adequate models to
estimate average residence time of solids and variation of
bed height within the kiln as a function of solids flow
rate, kiln rotational speed, tilt angle and so on. Several
chemical reactions take place in the solid bed. Calcination
reaction liberates carbon dioxide and reduces solids mass
flow rate. Part of the solids melts in the kiln. The melt for-
mation causes an internal coating on kiln refractories.
Energy required for calcinations and other reactions and
melt formation is provided by the hot free board gases.
Counter current flow of gas entrains solid particles in the
free board region. Such entrainment enhances rates of
Figure 1. Schematic of cement production.
Trans IChemE, Part A, Chemical Engineering Research and Design, 2006, 84(A3): 165–177
166 MUJUMDAR and RANADE
3. radiative heat transfer by increasing effective emissivity
and conductivity. We discuss each of the issue and
review the previous work related to it to provide
background for the model developed in this work.
Several solid–solid and liquid–solid reactions occur in
the bed region of rotary cement kilns. While formation of
C12A7, C2AS, CS, C3S2, CS2, CF, C2F and so on have
been reported within the kiln (Hewlett, 1998), these com-
ponents are generally present in insignificant amount and
are usually neglected for modelling purposes (Spang, 1972;
Mastorakos et al., 1999; Paul et al., 2002). The five major
reactions considered by most of the researchers are given
in Table 1. It can be seen that these reactions involve six
components: CaCO3, CaO, C2S, C3S, C3A and C4AF. Reac-
tion 1 of the Table 1 (calcination reaction) is a decompo-
sition reaction. Reactions 2, 3 and 4 are the solid–solid
reactions. Reaction 5 is the solid–liquid reaction. It is essen-
tial to estimate relevant kinetics of these reactions.
Calcination reaction (reaction 1 from Table 1) has been
studied extensively. The overall reaction rate is function
of the following three rate processes: (1) heat transfer (to
the surface and then to the reaction zone) through the par-
ticle: (2) mass transfer (both internal and external to the
surface); and (3) chemical reaction at the interface of unde-
composed particle and product. Relative rates of these three
transport processes depend on particle size and operating
conditions. Several models such as shrinking core model,
grain model, uniform reaction model, nucleation and
growth model and reacting particle model have been pro-
posed for modelling decomposition of calcium carbonate
(see e.g., Ingraham and Marier, 1963; Hill, 1968; Khinast
et al., 1996; Irfan and Dogu, 2001; Martins et al., 2002).
It was shown that limestone calcination is a shrinking
core process (Khraisha and Dugwell, 1992). The shrinking
core model was therefore used in the present work. Unlike
calcinations, other reactions listed in Table 1 (like for-
mation of C2S, C3A, C4AF and C3S) are not extensively
studied. Particle level models for these reactions are not
available. Most of the previous studies are restricted to
characterizing diffusion (and reactions) of CaO in silica
and other oxide species. Adequate information about vari-
ation of diffusion coefficient with temperature and compo-
sition under conditions prevailing in kiln is not available.
These reactions are therefore usually modelled as pseudo-
homogeneous reactions (Spang, 1972; Mastorakos et al.,
1999). Ignoring diffusion and particle scale processes,
simple Arrehenius type expressions are used for describing
overall reaction rates.
It is important to simulate solids residence time within
the kiln for accurate simulation of chemical reactions
occurring in the bed. Axial motion of solids in the kiln is
dependent on the mass flux of solids, speed of rotation,
height of solid bed (percentage fill), particle size, angle
of repose and kiln tilt (Kramers and Croockewit, 1952;
Lebas et al., 1995; Spurling et al., 2001). Axial velocity
of solids varies along the kiln length causing variation in
height of the solid bed. Though reasonable models to simu-
late axial velocity of solids in kiln are available, most of the
reaction engineering models for cement kilns assume a con-
stant bed height throughout the kiln length (see e.g., Spang,
1972; Mastorakos et al., 1999). Such models are incapable
of predicting influence of key design and operating par-
ameters of kiln on its performance. The changes in the
operating parameters (for example: kiln RPM, solids flow
rate to the kiln, etc.) changes bed height along the kiln
length. This not only changes the area of solids that are
exposed to freeboard for energy exchange but also influ-
ences residence time of solids in the kiln. Obviously, this
has effect on kiln performance. It is therefore essential to
use accurate models of axial motion of solids while devel-
oping reaction engineering model of a kiln.
Heat transfer from the free board to the solid bed needs
to be modeled accurately since this drives the chemical
reactions in the bed. For operating conditions prevailing
in cement kilns, radiation dominates the heat transfer
process (Boateng and Barr, 1996; Mastorakos et al., 1999;
Karki et al., 2000). Key parameters appearing in heat trans-
fer models are: emissivity of gas, absorption coefficient of
gas, conductivity of gas and solid. Estimation of these prop-
erties is not straightforward. Because of the counter current
flow gas flow, solids will get entrained from bed to free-
board region. The extent of solid entrainment will influence
the effective emissivity as well as conductivity of gas.
Hence effective thermal properties of dust-laden gas need
to be estimated to model heat transfer in transverse direc-
tion accurately.
Another important aspect of cement kilns is the formation
of melt within the kiln. As the temperature of the solid bed
rises above the solidus temperature (temperature at which
solid starts melting), melt formation occurs. Melt formation
Figure 2. Key issues in modelling cement kilns.
Table 1. Kinetics proposed by various authors for calcination reaction.
Sr. No.
Activation
energy
(kJ mol21
)
Pre-exponential
factor
(kmol m22
s21
) Reference
1. 186.9 1.020 108
Irfan and Dogu (2001)
2. 193.6 9.670 107
Irfan and Dogu (2001)
3. 160.0 3.650 107
Irfan and Dogu (2001)
4. 205.8 1.070 108
Irfan and Dogu (2001)
5. 172.2 6.050 107
Irfan and Dogu (2001)
6. 156.2 4.190 107
Irfan and Dogu (2001)
7. 159.1 4.090 107
Irfan and Dogu (2001)
8. 213.3 1.430 108
Irfan and Dogu (2001)
9. 205.0 6.078 104
Borgwardt (1985)
10. 205.0 2.470 102
Khinast et al. (1996)
11. 166.0 6.700 103
Garcia-Labiano et al. (2002)
12. 131.0 2.540 1021
Garcia-Labiano et al. (2002)
13. 169.0 1.185 103
Ingraham and Marier (1963)
14. 185.0 1.180 103
Rao et al. (1989)
15. 154.1 2.230 102
Lee et al. (1993)
16. 164.7 5.290 102
Lee et al. (1993)
Trans IChemE, Part A, Chemical Engineering Research and Design, 2006, 84(A3): 165–177
SIMULATION OF ROTARY CEMENT KILNS 167
4. is essential for formation of C3S. Despite this, not many of
the published models for cement kilns account for formation
of a melt phase in cement kilns. Mastorakos et al. (1999) had
accounted for melting in cement kilns. However their model
arbitrarily assumed (1) linear variation in the melt phase for-
mation and (2) maximum melt fraction (around 30%). The
melt fraction was assumed to remain constant thereafter in
the burning zone till the solids exit. The amount of melt
phase formed however, will depend upon the temperature
profile in the kiln. As the melt moves towards exit of the
kiln it will re-solidify since the bed temperature decreases
near the solids exit. However, none of the present models
account for re-solidification of the melt. As the melt phase
is formed, it forms coating over the refractories in the remain-
ing part of the kiln. The formation of coating is beneficial for
the refractory life. However, most of the reported models
either did not account for coating formation or assumed a uni-
form coating throughout the kiln length while solving energy
balance. With the background of this brief review, the model
developed in this work is discussed in the following.
COMPUTATIONAL MODEL
Model Equations
It is important to consider solids mixing while develop-
ing mathematical models for simulating the cement kilns.
Recently, Sherritt et al. (2003) have reviewed axial
mixing of solids in rotary kilns and have proposed a corre-
lation to estimate axial mixing. The correlation is valid for
wide range of solid materials and kiln dimensions. This
study indicated that the values of Peclet number for indus-
trial rotary cement kilns were greater 104
. For such a high
values of Peclet number, axial mixing could be neglected.
Therefore, the mass conservation equation for species i
was written as:
d(AclVclrclYi)
dx
¼ RiAcl (1)
where Yi is the species mass fraction and Ri is the rate of
reaction of individual species. Acl is the area of the clinker
bed normal to the kiln axis, Vcl is the velocity of the solid
bed, rcl is bulk density of the solids. By summing the con-
servation equation over all the species, the overall mass
conservation equation can be written as:
d(AclVclrcl)
dx
¼ RCO2
Acl (2)
RCO2
is the rate of formation of CO2. CO2 formed due calci-
nation reaction (Reaction 1 in Table 1) in the bed region
leaves the bed. Hence the solids flow rate in the kiln
decreases along the kiln length. Calculation of RCO2
is
discussed later in this section.
The area of the solids bed Acl was calculated as:
Acl ¼
1
2
R2
G
1
2
Lgcl (R h) (3)
where R is the internal radius of the kiln walls, G is the
angle made by the solid bed at the kiln centre and Lgcl is
the length of the solid chord made in the transverse
direction between the kiln walls and h is the height of the
solid bed (see Figure 3). The variables G and Lgcl are func-
tions of bed height in the kiln and can be calculated once
the bed height is known. The bed height in the kiln
varies along the kiln length. The variation of bed height
within the kiln was modeled using the model of Kramers
and Croockewit (1952) as:
dh
dx
¼ tan g
tan b
sin g
3fv
4pnR3
2h
R
h2
R2
3=2
#
(4)
where x is the axial position of solids in kiln, b is the kiln
inclination with respect to horizontal, g is the angle of
repose of solids, wv is the volumetric flow rate of the
material, n the kiln rotational speed and R is the kiln
radius. The above model based on mechanism of transpor-
tation put forward by Saeman (1951) and extension of work
of Vahl and Kingma (1952). This model was shown to pre-
dict the height variation of solid bed along the kiln length
for a wide range of operating conditions and kiln dimen-
sions (Lebas et al., 1995; Spurling et al., 2001).
The chemical reactions occurring during clinker for-
mation are given in Table 1. The rate expressions for
these reactions were calculated as:
Ri ¼
X
NC
i¼1
X
NR
j¼1
Zij
Mj
k0j exp
Ej
RTB
Y
NC
k¼1
Co( j, k)
k (5)
Here, Zij are the stoichiometric coefficients, Mj is the
molecular weight of the base component, k0j and Ej are
the Arrehenius parameters of the reactions. TB is the bed
temperature, Ck is concentration of the kth reactant and
o( j, k) is order of jth reaction with respect to kth compo-
nent. We have assumed all the reactions to be of first
order with respect to each reactant. NR is the number of
reactions, which vary from 1 to 5, and NC is the number
of components, which vary from 1 to 10 in the present
case. Discrete solid particles were assumed to be pseudo
fluids as explained in the previous section.
Critical review of published literature pointed out that
there is a significant differences in the kinetics reported
even for relatively simple reaction like limestone calcina-
tion. The reported activation energy for calcination varies
from 190–210 kJ mol21
(Irfan and Dogu, 2001) to
Figure 3. Heat transfer in transverse section of the kiln.
Trans IChemE, Part A, Chemical Engineering Research and Design, 2006, 84(A3): 165–177
168 MUJUMDAR and RANADE
5. 1500 kJ mol21
(Hills, 1968). Similar level of disagreement
was observed even in reported experimental data
[Watkinson and Brimacombe (1982) showed the initiation
temperature of calcination reaction as 1100 K while Irfan
and Dogu (2001) reported it as 850 K]. Limestone calcina-
tion was shown to be a shrinking core process by Khraisha
and Dugwell (1992). Recently, Irfan and Dogu (2001) have
carried out TGA experiments for wide range of limestone
species. Several models like shrinking core model with
mass transfer control, shrinking core model with diffusion
control, shrinking core model with surface reaction control-
ling were compared with the measured experimental data.
Shrinking core model with surface reaction controlling
was reported to be the best compared to other models
tested by them. Shrinking core model has also been used
by various other investigators to model limestone calcina-
tion (Satterfield and Feakes, 1959; Ingraham and Marier,
1963). The reduction in radius of lime stone particle was
related as:
dRp
dt
¼
MWks0
rb
eðE=RTÞ
(6)
where rb is the bulk density of the particle, Rp is the particle
diameter, MW is the molecular weight of the particle, ks0 is
the pre-exponential factor in the Arrehenius equation and E
is the activation energy.
Equation describing rate of reduction of radius of a
single particle was re-written as an effective rate expression
for pseudo homogeneous kinetics as:
dCC
dt
¼ kappC2=3
C eðE=RTÞ
(7)
where
kapp ¼
311=3
s ks0
R0
MW
rB
2=3
(8)
It can be seen that the apparent rate constant depends on the
initial particle diameter and the bulk density of solids. As
specified earlier, there is a wide scatter in reported values
of activation energy discrepancy is observed in the litera-
ture proposed rates for calcination reaction. The reported
scatter in value of ks0 is not so wide. Hence the value of
ks0 used in the present work calcination kinetics are
summarized in Table 1. The large scatter in calcination
kinetics was taken as average value of ks0 (7.727
106
gmol cm22
s21
) also reported by Irfan and Dogu
(2001) for various Gilot (2005) in their recent review on
limestone species. Activation energy for calcination
reactions. It was treated as an adjustable parameter also
reported that the proposed models fit adequately their
own experimental data. However, when they are applied
to other results most of them fail (Khinast et al., 1996).
In absence of any reliable information on calcination kin-
etics, in the present work, we have compared models pro-
posed by various investigators (see Table 1) with
available experimental data and selected a set of kinetics
that best fits the data for calcination reaction. Since particle
level models are not yet well established for the rest of the
reactions, kinetics of these reactions were used as reported
by Mastorakos et al. (1999) and are specified in Table 2.
The chemical reactions occurring in the bed are driven
by energy supplied by the free board and kiln walls.
Although heat transfer occurs by all the three models, radi-
ation is a dominant mode of heat transfer (Karki et al.,
2000; Mastorakos et al., 1999). There was a considerable
work on heat transfer in rotary kilns (Gorog et al., 1981,
1983; Barr et al., 1989). Gorog et al. (1983) have reported
comparison of results with and without considering
contributions of radiative transfer over axial distances.
The relative contribution of radiative transfer over axial
distances depends on axial flame temperature gradient
(DT/DZ), relative flame diameter (diameter of flame/
diameter of kiln) and wall refractivity. Considering the
typical values of these parameters occurring in rotary
cement kilns (temperature gradient of 100 K m21
, relative
diameter of about 0.5 and wall refractivity in the range of
0.2–0.5), it can be concluded that the maximum errors
caused by neglecting radiative transfer in axial direction
is less than 10%. Based on these results and considering
the main objective of this work as developing a simple
yet adequately accurate model (without increasing demands
on computational resources), we have neglected the contri-
bution of radiative transfer over axial distances. The energy
conservation equation was written as
d
dx
ðAclVclrclCpTcl þ AclVclrcllmL)
¼ (LgclQ)
X
NC
i1
RiHi
!
Acl SCO2
(9)
Cp is heat capacity of solids. The first term of the left hand
side represents convective transfer of energy. The second
term of left hand side represents the energy required for
melting of solids. The last term in the above equation
represented energy required/liberated during chemical
reactions (Hi is the heat of formation of species i). Q is
the heat flux received by the bed from the free board and
kiln walls and Lgcl is the chord length of solids exposed
Table 2. Reactions, kinetics and heat of reaction.
Reaction k0 E (kJ mol21
) DH
(kJ mol21
)
1. CaCO3 ¼ CaO þ CO2 1.18 103
(kmol m22
s21
) 185 179.4
2. 2CaO þ SiO2 ¼ C2S 1.0 107
(m3
kg21
s21
) 240 2127.6
3. C2S þ CaO ¼ C3S 1.0 109
(m3
kg21
s21
) 420 16.0
4. 3CaO þ Al2O3 ¼ C3A 1.0 108
(m3
kg21
s21
) 310 21.8
5. 4CaO þ Al2O3 þ Fe2O4 ¼ C4AF 1.0 108
(m6
kg22
s21
) 330 241.3
Djuric and Ranogajec (2002).
Trans IChemE, Part A, Chemical Engineering Research and Design, 2006, 84(A3): 165–177
SIMULATION OF ROTARY CEMENT KILNS 169
6. to the freeboard region. SCO2
is the volumetric energy sink
due to CO2 loss from the bed. The first term in the RHS of
equation (9) represents the heat received by the solid bed
from the freeboard gas and the hot walls and was calculated
in the following way.
The various modes by which heat transfer takes place in
kiln are shown in Figure 3. QRWB and QCWB are heat trans-
fer rates due to radiation and conduction respectively
between kiln internal wall and bed. QRGB and QCGB are
heat transfer rates due to radiation and convection between
gas and bed. QRGW and QCGW are heat transfer rates due to
radiation and convection between the kiln freeboard gas
and internal wall. QREF and QSTL are heat transfer due to
conduction in refractory and steel shell respectively.
QLOSS is loss of heat from steel shell by radiation and con-
vection. The calculation of individual heat transfer terms is
given below.
Heat transfer by radiation between gas phase and bed and
gas phase and the kiln internal walls was evaluated by the
equations developed by Hottel and Sarofim (1967), valid
for 1 0.8:
QRGK ¼ s ARGK(1K þ 1)
1GT4
G aGTG
K
2
K ¼ B, W (10)
QRGK is the radiative heat transfer, s is the Stefan–
Boltzmann constant, A is the area of heat transfer. 1 and
a are the emissivity and absorptivity of the freeboard gas,
respectively. TG is the temperature of the freeboard gas.
Subscript B denotes solid bed and W denotes walls.
Convective heat transfer between gas phase and bed and
gas phase and the kiln internal walls was evaluated as
QCGK ¼ hCGK ACGK(TG TK) K ¼ B, W (11)
The heat transfer coefficients for convection were calcu-
lated as (Tscheng and Watkinson, 1979):
hCGS ¼ 0:46
kG
De
Re0:535
D Re0:104
v h0:341
(12)
hCGW ¼ 1:54
kG
De
Re0:575
D Re0:292
v (13)
where kG is the gas thermal conductivity and De is the
hydraulic diameter of the kiln. ReD and Rev are the axial
and angular Reynolds number calculated as
ReD ¼
rg ug De
mg
Rev ¼
rg v D2
e
mg
De ¼
0:5D (2p G þ sin G)
p ðG=2Þ þ sin ðG=2Þ
ð Þ
h ¼
G sinðGÞ
2p
(14)
The radiative heat transfer between kiln internal walls and
bed is given by
QRWB ¼ s ARWB 1B 1W V
(T4
W T4
B) (15)
V is the form factor for radiation which was calculated as
V ¼
Lgcl
2(p b)R
(16)
The heat transfer by conduction between the bed and the
kiln internal walls is given by
QCWB ¼ hCWBACWB(TW TB) (17)
hCWB is the heat transfer coefficient which was evaluated
using empirical correlation by Tscheng and Watkinsion
(1979) as
hCWB ¼ 11:6
KB
ACWB
vR2
G
aB
(18)
In the above expression kB is the thermal conductivity of
bed, G is the angle of fill of the kiln, v is the rotational
speed (rad s21
) and aB is the bed thermal diffusivity.
Martins (2001, 2002) used correlations similar to those
discussed above in their simulations of rotary kilns.
Conductivity and emissivity of the freeboard gases
depend on its composition and dustiness (volume fraction
of solids entrained in the freeboard gases). The influence
of carbon dioxide and water vapour on emissivity was
estimated from the data reported by Gorog et al. (1981).
The thermal conductivity of the freeboard gas was assumed
to be same as that of air at prevailing temperature and was
calculated by the expression (Thunman and Leckner, 2002):
kG ¼ 7:494 103
þ 1:709 104
TG
2:377 107
T2
G þ 2:202 1010
T3
G
9:463 1014
T4
G þ 1:581 1017
T5
G (19)
The thermal properties of solids were available from literature
and are specified in Table 2. Influence of entrained solids on
effective emissivity and conductivity of gas was estimated as
ceff ¼ 1solidcsolid þ (1 1solid)cgas (20)
where c is the property i.e., thermal conductivity or emissiv-
ity, 1solid is the solid volume fraction or dustiness of the gas.
However, reliable information on solid entrainment in kilns
under usual operating conditions is not available. In absence
of such information, the volume fraction of solids in the free-
board gases was treated as an adjustable parameter.
The energy balance across the kiln walls was solved at
steady state to calculate temperatures of kiln, refractory,
coating and so on. The steady state heat balance equations
across kiln walls were written as
QRGW þ QCGW QRWB QCWB ¼ QCOAT (21)
QCOAT ¼ QREF (22)
QREF ¼ QSTL (23)
QSTL ¼ QLOSS (24)
QCOAT is the heat transfer by conduction through the coat-
ing. When coating is absent, left hand side of equation (21)
was equated to the right hand side of equation (22). After
Trans IChemE, Part A, Chemical Engineering Research and Design, 2006, 84(A3): 165–177
170 MUJUMDAR and RANADE
7. calculating temperatures of inner kiln wall, refractory–
shell interface and outer steel shell, heat flux received by
the bed [Q in equation (9)] was calculated as
Q ¼
QCWB
ACWB
þ
QRWB
ARWB
þ
QRGB
ARGB
þ
QCGB
ACGB
(25)
Here QRGB and QCGB are heat transfer due to radiation and
convection between freeboard gas and bed, respectively.
Melting of solids in the kilns was assumed to be pro-
portional to the bed temperature in the kiln. Melting was
modelled by using the following relationship between
mass fraction of liquid and bed temperature.
mL ¼ max 0,
T TS
TL TS
(26)
where TL and TS are liquidus (temperature at which all
mass is liquid) and solidus (temperature at which first
drop of liquid forms) temperatures respectively. l is the
latent heat of melting (l ¼ 416 kJ kg21
, Mastorakos
et al., 1999). The formation of melt phase was assumed
to depend only on local temperature (it was assumed to
occur infinitely fast). The values of TL and TS depend on
composition of solids in the kiln and may vary within the
kiln. As a first approximation, these values were assumed
to be constant and were set to 1560 K and 2200 K, respect-
ively (Peray, 1986).
For solving the model equations, it is necessary to
specify freeboard temperature profile within the kiln. In
this work, we use an approximation of the freeboard temp-
erature profile obtained using the CFD model (Ranade,
2003). An area-weighted averaged temperature profile of
the freeboard region obtained from this model is shown
in Figure 4. It is seen from Figure 4, that the freeboard
temperature profile can be fitted as two linear profiles
touching each other at maximum temperature. The location
of this point in the kiln is referred as maximum flame temp-
erature position and the temperature at this point is referred
as maximum flame temperature. Our previous studies
(Ranade, 2003) showed that the position of maximum
flame temperature in the freeboard region did not changed
significantly during the simulations. Hence in the present
study, the maximum flame temperature position was fixed
based at 60% of kiln length from the solids entrance
based on the CFD studies. The maximum flame tempera-
ture was treated as an adjustable parameter to match the
product composition at the kiln exit.
Adjustable Parameters in the Model
As discussed before, processes occurring in rotary
cement kilns are quite complex. It is not surprising to
have few adjustable parameters while simulating such com-
plex processes using a one-dimensional model. It is how-
ever important to clearly identify these adjustable
parameters and minimize the number of such parameters.
It is also important to ensure that model predictions are
not unduly sensitive to these adjustable parameters. In
this work, we have simulated behaviour of rotary cement
kilns using two adjustable parameters:
. Solid entrainment in freeboard region: Adequate
information about solids entrainment in the freeboard
region of kilns is not available. The volume fraction
of solids in the free board region was therefore treated
as adjustable parameter. The studies on solid entrainment
in rotating kilns are very few (Friedman and Marshall,
1949; Li, 1974). Experimental measurements reported
by Friedman and Marshall (1949) show maximum
solid entrainment of about 7% of solid feed rate in exper-
imental rotating drums. Martins et al. (2001) have
reported solid entrainment in the same range for indus-
trial calciner. Assuming no slip between entrained solid
and freeboard air, the volume fraction of solids entrained
in the freeboard region is not expected to go beyond 1%.
. Maximum flame temperature in the freeboard
region: The maximum flame temperature was adjusted
to match the composition of C3S at the kiln outlet. The
expected range of maximum flame temperature is
1900 K to 2400 K. [2253 K reported by Kolyfetis and
Markatos (1996); 2173 K reported by Locher (2002);
2400 K reported by Mastorakos et al. (1999); 2000 K
reported by Karki et al. (2000).]
Sensitivity of model predictions with these parameters is
discussed in the following. The mass and energy balance
equations were solved by modified Gear’s method
implemented in ODEPACK (Hindmarsh, 1983). The non-
linear equations of heat balance across kiln walls were
solved by a subroutine, using Newton–Raphson method.
The results are discussed in the following.
RESULTS AND DISCUSSION
Simulations of Calcination Experiments of
Watkinson and Brimacombe (1982)
Watkinson and Brimacombe (1982) have carried out cal-
cination experiments in a laboratory scale rotary kiln and
have reported temperature profiles within the kiln. Avail-
ability of the experimentally measured temperature profile
within the kiln makes this data set particularly useful to
evaluate the one-dimensional model developed here. The
experiments of Watkinson and Brimacombe (1982) were
simulated by providing geometrical and operating
Figure 4. Area weighted averaged gas temperature profile from CFD
model (Ranade, 2003).
Trans IChemE, Part A, Chemical Engineering Research and Design, 2006, 84(A3): 165–177
SIMULATION OF ROTARY CEMENT KILNS 171
8. conditions of their kiln as input data to the model (as speci-
fied in Table 3). The physical properties used for these
simulations are shown in Table 4. The measured tempera-
ture profile of the free board region was specified as an
input. The thermal properties of dusty gases i.e., emissivity
and thermal conductivity used in the industrial kiln simu-
lations were obtained at an average gas temperature of
1300 K. Gas emissivity for dust free gas was set to 0.1
from the charts reported by Gorog et al. (1981). In this
case, there is only one adjustable parameter (since the free-
board temperature profile is known): volume fraction of
solids in the freeboard. The value of solids volume fraction
was initially set to 1%. The kinetic models listed in Table 1
were incorporated in the present model to simulate exper-
iments of Watkinson and Brimacombe (1982). The simu-
lated profiles of percentage calcination in calciner as a
function of bed temperature (along the kiln length) for
these different kinetics are shown in Figure 5. It can be
seen from Figure 5 that the kinetics proposed by Rao et
al. (1989) gives the best fit in the considered group and
was therefore used in the present study. With kinetic par-
ameters reported by Rao et al. (1989), the sensitivity of
the predicted bed temperature profile was examined for
different values of solids volume fraction in freeboard
region. These results are shown in Figure 6. It can be
seen that the predicted temperature profiles are insensitive
to the exact values of solids volume fractions within the
expected range. Therefore values of solid volume fraction
was set to 1% for rest of the simulations. The model was
thus able to simulate the experiments of Watkinson and
Brimacombe (1982) reasonably well. The model was then
used to simulate performance of industrial cement kilns.
Simulation of Industrial Kilns
Three different industrial kilns were selected for
simulations. Details of these three kilns are specified in
Table 2. It can be seen that the selected kilns cover a
reasonable range of kiln dimensions, production capacity
and operational parameters like rotational speed, fill ratio
and angle of tilt. Appropriate data for validating mathemat-
ical models for industrial cement kilns are however not
readily available. The practical difficulties in sampling
inside the industrial kilns restricts for available data only
at the pre-heater entrance and clinker cooler exit. The temp-
erature and mass fractions at the kiln inlet are however,
required to specify the initial conditions to the model. A
direct way to obtain these initial conditions would be
actual measurements. In absence of such data, in the pre-
sent work, the conditions at the kiln entrance were calcu-
lated by specifying appropriate degree of calcination
occurring in calciner. In order to identify appropriate
degree of calcination at the kiln entrance, the over all
energy balance on the calciner and kiln was solved for
different degrees of calcinations. Knowledge of gas temp-
erature at the kiln outlet (at the solids entrance end) then
enabled us to select the appropriate value of calcination.
The mass fractions and temperature at solids inlet calcu-
lated in this manner are given in Table 5. These were
used as initial conditions to the model.
The thermal properties of gases i.e. emissivity and ther-
mal conductivity were obtained at an average gas tempera-
ture of 1750 K. Gas emissivity for dust free gas was set to
0.4 at conditions prevailing in the kiln from the charts
reported by Gorog et al. (1981). Thermal conductivity of
dust free gas was calculated by equation (19). As discussed
Table 3. Dimensions of kilns and operating conditions of kilns.
Sr. No. Variable Pilot kiln$
Industrial kiln 1 Industrial kiln 2 Industrial kiln 3
1. Length, m 5.5 50 60 68
2. Inner refractory diameter, m 0.406 3.4 3.6 4.0
3. Outer refractory diameter, m 0.59 3.8 4 4.4
4. Outer shell diameter, m 0.61 3.85 4.084 4.456
5. Coating thickness, m – 0.13 0.18 0.125
6. Speed of rotation, RPM 1.5 5.5 3.3 3.5
7. Angle of tilt, degrees 1 2 3.5 2
8. Solids flow in, kg s21
0.013 38.88 50.78 48.12
9. Gas temperature at burner end, K 1600 1373 1373 1373
10. Gas temperature at solid entry, K 800 1373 1325 1350
$
Martins et al. (2002).
Table 4. Physical properties.
Sr. No. Variable Pilot kiln Industrial kiln
1. Bed density, kg m23
1680#
1200þ
2. Bed heat capacity, KJ kg21
K21
0.8$
0.8$
3. Bed emissivity 0.9 0.9
4. Wall emissivity 0.9 0.9
5. Bed thermal conductivity, W m21
K21
0.69#
0.5
6. Refractory thermal conductivity, W m21
K21
0.4#
4.0^
7. Gas heat capacity (0.106 TG þ 1173)!
8. Gas viscosity (0:1672 105
ffiffiffiffiffiffi
TG
p
1:058 105
)!
Perry (1984); #
Barr et al. (1989); þ
Mastorakos et al. (1999); $
Martin (1932); !
Guo et al. (2003); ^
http://www.
vrwrefractories.com/cement-industry.html.
Trans IChemE, Part A, Chemical Engineering Research and Design, 2006, 84(A3): 165–177
172 MUJUMDAR and RANADE
9. earlier, the position of maximum gas temperature was set to
0.6 times the kiln length. The kinetic parameters reported
by Rao et al. (1989) were used for the calcination reaction.
Since most of the calcination occurs outside rotary cement
kilns, the calcination kinetics is not expected to signifi-
cantly alter the kiln performance.
The maximum flame temperature was adjusted to match the
C3S composition at the kiln exit. Solid hold up of 1% and
maximum flame temperature of 2283 K gave reasonable
results for industrial kiln 1 as can be seen from Table 5 and
Figure 7. The simulation results were insensitive to volume
fraction of solids (in the expected range of ,1%). Sensitivity
of the predicted results with maximum flame temperature
is shown in Figure 7. It can be seen that as the maximum
flame temperature increases, the C3S mass fraction at the
bed exitincreases. Thisis expectedsince increasingmaximum
flame temperature would provide more energy to the bed.
Following these results, the model predictions for the remain-
ing two kilnsbyadjusting maximum gas temperaturearelisted
in Table 5. It can be seen that the model was able to predict the
overall performance of all the industrial kilns satisfactorily.
Typical profiles of mass fraction and temperature
obtained from simulations for industrial kiln 1 are shown
in Figures 8(a) and 8(b), respectively. The predicted results
agree with the previously reported results (Spang, 1972;
Mastorakos et al., 1999). In the initial region of kiln, calci-
nation and formation of C2S takes place. This is followed
C3A and C4AF formation. In the burning zone temperature
reaches to about 1560 K where the solids start melting. The
amount of melt depends upon the temperature of bed which
increases initially reaches a maximum and decreases there-
after. The predicted temperature profiles of gas, bed walls
and coating are shown in Figure 8(b). Coating was
formed around 35% of kiln length from the solid exit
end. The temperature of kiln shell decreases abruptly at
the point from which a coating formation occurs. Such
temperature dips for shell temperatures are reported for
industrial cement kilns (Kolyfetis and Markatos, 1996). In
general, the presented model was able to predict the beha-
viour of three industrial kilns reasonably well by adjusting
maximum temperature.
Energy Analysis of Cement Kilns
The computational model developed here was further
used to carry out analysis of energy consumption in
cement kilns. The net energy consumption in the kiln is
governed by the energy required to drive the chemical reac-
tions and energy lost by the kiln to environment. For the
same inlet and outlet composition, the energy required by
the chemical reactions is fixed. The only variable com-
ponent in the net energy consumption is energy lost to
the environment. Energy lost to the environment can be
grouped into three categories: (1) un-recovered energy
from hot solids exiting from kiln; (2) un-recovered
energy from hot gases exiting from kiln; and (3) energy
lost to the surroundings (convection and radiation). It can
be seen that changes in kiln operational parameters or
manipulation of freeboard temperature profile within the
kiln will influence all the three categories and therefore
will influence net energy consumption in the kiln. In
this work, initially we have performed numerical simu-
lations using computational model to investigate effect of
changes in kiln RPM, angle of tilt and soilds flow rate to
the kiln on energy consumption in kilns. Thereafter, we
have carried out numerical experiments by considering
different freeboard gas temperature profiles. The shape of
the profile was assumed to be same as shown in Figure 4.
The position of maximum temperature was varied from
0.2 times kiln length to 0.8 times kiln length. The value
of maximum temperature at these positions was adjusted
in such a way that solids composition at the kiln outlet is
same for all the cases. While carrying out these simulations,
the gas inlet temperature was coupled with the solids outlet
temperature by assuming a clinker cooling efficiency, h, as:
mGCpG(TG;in 300) ¼ h mBCpTB;out (27)
where m is mass flow rate, Cp is heat capacity, h is the
cooler efficiency and T is temperature. Subscripts G, B, in
Figure 5. Comparison of different reaction rates on experimental data of
Watkinson and Brimacombe (1982).
Figure 6. Comparison of experimental and simulated results for bed
temperature of calcination experiments.
Trans IChemE, Part A, Chemical Engineering Research and Design, 2006, 84(A3): 165–177
SIMULATION OF ROTARY CEMENT KILNS 173
10. and out denote gas, solids, inlet and outlet, respectively.
The temperature of the gases leaving the kiln from the
solid entrance was calculated by solving overall energy
balance on the kiln. Following procedure was used to
simulate performance of a kiln.
The coal flow rate to the kiln (energy supplied to kiln in the
form of coal, Ecoal) and the maximum flame position were set
to specific values. For simulations to study influence of oper-
ating conditions (kiln RPM, tilt and solids flow rate) on the
kiln performance, the value of Ecoal was fixed. Assuming
the entrance and exit gas temperatures, the magnitude of
the maximum flame temperature was adjusted to get same
(within +1%) solids composition at the kiln outlet. The
inlet gas temperature was recalculated using Equation (27)
and simulations were carried out with this new value of
gas inlet temperature. This procedure was continued till the
inlet gas temperature did not change by +1% of the previous
value. Once inlet gas temperature converged, outlet gas
temperature was calculated based on overall energy balance
on the kiln. The value of gas outlet temperature was com-
pared with the initially assumed value and the whole pro-
cedure was repeated till the exit gas temperature also did
not change by +1% of the previous value. Simulations to
study effect of changing position of maximum flame temp-
erature were carried out for different values of Ecoal. The
simulated results are discussed in the following.
The effect of kiln rotational speed and kiln tilt on per-
formance of kiln is shown in Figures 9(a) and 9(b). It can
be seen from Figure 9(a) that as kiln RPM decreases, the
net energy consumption decreases. Changes in kiln RPM
changes the bed height in kiln. Therefore the area of bed
exposed to the freeboard changes (130.29 m2
for 4 rpm;
118.7 m2
for 5.5 rpm; 110.4 m2
for 7 rpm). The residence
time of solids also change significantly (1455 s for 4 rpm;
1037 s for 5.5 rpm and 805 s for 7 rpm). Our simulation
results indicate that it seems to be beneficial to operate
kilns at lower RPM as long as adequate mixing of solids
is occurring. From Figure 9(b) it can be seen that energy
consumptions in kilns operated at lower tilt is less as com-
pared to kilns at higher tilt. The predicted results in the
form of net energy consumption and percentage fill for
different solids flow rates are shown in Figure 9(c). As
expected, as solids flow rate increases, the percent fill at
kiln entrance increases. It can be seen that the net energy
consumption per unit weight of product decreases as
solids flow rate increases. This is because the net energy
loss from the kiln does not increase proportional to the
solids mass flow rate. Thus it is beneficial from the point
of view of energy consumption to operate kiln with higher
solids flow rate. Other operational concerns like increase
in dusting and mixing however need to be considered
while identifying maximum solids flow rate for any specific
rotary cement kiln. The studies of flow, mixing and heat
transfer in transverse plane (for example, Mujumdar and
Ranade, 2003; Ranade and Mujumdar, 2003; Khakhar
Table 5. Model assumptions/predictions and comparison with industrial data.
Industrial kiln 1
(67% calcination in
calciner)
Industrial kiln 2
(60% calcination in
calciner)
Industrial kiln 3
(71% calcination in
calciner)
Sr. No. Data Model Data Model Data Model
Model inputs at solid entrance
1. Mass fraction CaCO3 – 0.340 – 0.398 – 0.305
2. Mass fraction CaO – 0.396 – 0.335 – 0.418
3. Mass fraction SiO2 – 0.179 – 0.185 – 0.190
4. Mass fraction Al2O3 – 0.0425 – 0.041 – 0.043
5. Mass fraction Fe2O3 – 0.0425 – 0.041 – 0.043
6. Temperature of solids, K – 1123 – 1250 – 1025
Model predictions and industrial data at solids exit
7. Mass fraction C3S 0.483 0.503 0.508 0.502 0.5 0.504
8. Mass fraction C2S 0.239 0.222 0.257 0.263 0.269 0.249
9. Mass fraction C3A 0.051 0.051 0.048 0.051 0.042 0.052
10. Mass fraction C4AF 0.143 0.149 0.151 0.148 0.142 0.147
11. Mass fraction CaO 0.084 0.075 0.035 0.036 0.047 0.048
12. Temperature of solids, K 1673 1618 1673 1608 1573 1569
Maximum flame position in kiln
13. zmax/Len (From solids entry) – 0.6 – 0.6 – 0.6
14. Tmax, K – 2283 2165 1925
15 Reported heat loss, kJ kg21
clinker 210 170 185 210 170–230 252
Figure 7. Sensitivity of adjustable parameters on performance of industrial
kiln 1.
Trans IChemE, Part A, Chemical Engineering Research and Design, 2006, 84(A3): 165–177
174 MUJUMDAR and RANADE
11. et al., 1997 and references cited therein) are useful to under-
stand issues related to such operational concerns. Thus, the
present computational model appears to be a useful tool to
investigate effects of changing operating conditions on
kiln performance.
Typical predicted results for the net energy consumption
in the kiln for varying position of maximum flame tempera-
ture are shown in Figure 9(d). Corresponding numbers for
net energy consumption in kilns and position of coating
formation with respect to maximum flame position are
Figure 8. (a) Typical mass fraction profiles in cement kiln. (b) Typical temperature profiles in cement kiln.
Figure 9. (a) Influence of rotational speed on net energy consumption of industrial kiln 1. (b) Influence of angle of tilt on net energy consumption of indus-
trial kiln 1. (c) Influence of solids flow rate on net energy consumption of industrial kiln 1. (d) Influence of flame position on net energy consumption
of industrial kiln 1.
Trans IChemE, Part A, Chemical Engineering Research and Design, 2006, 84(A3): 165–177
SIMULATION OF ROTARY CEMENT KILNS 175
12. tabulated in Table 6. As the maximum flame position
moves towards the solid inlet, coating formation takes
place earlier in the kiln (see Table 6). Since coating is
formed early in the kiln, heat losses from the kiln are
reduced due to additional resistance of coating for heat
transfer. The energy required by solids for clinker reactions
and melt formation remain more or less same. Therefore, as
the maximum flame position moves towards the solid inlet
the net energy consumption in the kiln decreases.
The computational model and the results presented here
will be useful to guide further work on modelling of
burner/ free board region and to re-design temperature
profiles within the kiln to minimize energy consumption.
However, other concerns including possible operational
difficulties need to be investigated further in order to ident-
ify optimum yet practicable model of operation for rotary
cement kiln.
CONCLUSIONS
A one-dimensional reaction-engineering model to simu-
late reactions in bed region of rotary kiln along with heat
transfer in the transverse plane of kilns is presented. Vari-
ation of bed height within the kiln, melting and formation
of coating were included in the model unlike the previously
published models. Solid phase reactions were modeled using
a pseudo-homogeneous approximation. Shrinking core
model with surface reaction controlling was used to model
calcination reaction. This model was reformulated to suit
pseudo-homogeneous approximation. It was shown that the
model was able to predict the experimental results of
Watkinson and Brimacombe (1982) reasonably well. The
model was also used to simulate performance of three
industrial cement kilns. For simulation of industrial kilns
maximum temperature of freeboard gas was the adjustable
parameter. The predicted results were not very sensitive to
volume fraction of solids in freeboard region. By adjusting
maximum flame temperature, the model was able to predict
the mass fractions and temperature of solids at the solid exit
reasonably well for three industrial kilns. The values of
maximum flame temperature in these simulations were
found to be well within usual range. The model was used
to evaluate the kiln performance for different operating con-
ditions. Simulation results indicate that a better performance
can be obtained by operating kilns at lower RPM, high solids
flow rate and lower tilt. The model was further used to
understand influence of temperature profile within the kiln
on net energy consumption of cement kiln. It was observed
that as position of maximum flame temperature moves closer
to the solids entrance, the net energy consumption in the kiln
decreases. However, other concerns including possible oper-
ational difficulties need to be investigated further in order to
identify optimum yet practicable model of operation for
rotary cement kiln. The model and the results presented
here will be useful for further studies on reducing energy
consumption in cement kilns.
NOMENCLATURE
Acl cross-sectional area covered by the charge, m2
ACGW convection area gas to wall, m2
ACGB convection area from gas to bed, m2
ACWB conduction area from wall to bed, m2
ARGB radiation area from gas to bed, m2
ARWB radiation area from wall to solids, m2
CC concentration of CaCO3 particle, kg m23
Ck concentration of the component in the bed, kg m23
Cp specific heat of the bed, kJ kg21
K21
De equivalent diameter, m
Ecoal energy given by coal in the kiln, kJ kg21
clinker
Ej activation energy of the jth reaction, kJ mol21
Hi heat of formation of species i, J kg21
h height of solid bed, m
kapp rate constant for pseudo homogeneous reactions
keff effective thermal conductivity of gas in freeboard region,
W m21
K21
ks0 Arrhenius factor for calcination reactions, kmol m22
s21
Lgcl chord of the sector covered by the charge, m
Len length of the kiln, m
MW molecular weight, kg kmole21
Mj stiochiometric coefficient of the base component
mL fraction of liquid formed due to melting
NC number of components in the bed
NR number of reactions
Pe Peclet number for axial flow of solids
Q heat gained by the bed due to heat transfer, J m22
s21
QCGW convection gas to wall, J s21
QCOAT heat transfer through coating, J s21
QCGB convection from gas to bed, J s21
QCWB convection from wall (refractory or coating) to bed, J s21
QLOSS heat loss to the surrounding, J s21
QREF heat transfer through refractory, J s21
QRGB radiation from gas to bed, J s21
QRGW radiation from gas to wall, J s21
QRWB radiation from wall to bed, J s21
QSTL heat transfer through steel shell, J s21
R Internal radius of the kiln, m
Ri net rate of formation of species i in the bed, kg m23
s21
Rp particle radius, m
R0 initial particle radius, m
T0 ambient air temperature, K
TB temperature of bed, K
Tcl temperature of the bed, K
TG temperature of gas, K
TL liquidus temperature, K
TW temperature of inner kiln wall, K
TS solidus temperature, K
Vcl velocity of the charge, m s21
x axial distance in the kiln, m
xr thickness of refractory, m
xs thickness of shell, m
Yi mass fractions of the ith species in the bed
Zij stoichiometric coefficients
Table 6. Total energy consumption for industrial kiln 1 (kJ kg21
clinker).
Maximum flame
temperature position
Occurrence of melt in kiln
(normalised from solid end) Ecoal ¼ 924 kJ kg21
clinker Ecoal ¼ 1050 kJ kg21
clinker Ecoal ¼ 1176 kJ kg21
clinker
0.2 0.52 473.59 473.39 472.15
0.4 0.58 486.52 484.92 483.37
0.6 0.66 505.09 502.19 501.08
0.8 0.77 540.56 540.74 538.94
Trans IChemE, Part A, Chemical Engineering Research and Design, 2006, 84(A3): 165–177
176 MUJUMDAR and RANADE
13. Greek symbols
rcl bulk density of the bed, kg m23
rb bulk density of solids, kg m23
ag absorptivity of gas
b angle made by the solids at the center of kiln, rad
g angle of repose, rad
l latent heat of melting, kJ kg21
wv volumetric flow of solids, m3
s21
1b emissivity of bed
1g emissivity of gas
1s solid porosity
1solid volume fraction of solids in the freeboard region
1w emissivity of kiln internal wall
V view factor for radiation
REFERENCES
Barr, P.V., Brimacombe, J.K. and Watkinson, A.P., 1989, A heat transfer
model for the rotary kiln—I. Pilot kiln trials, Met Trans B, 20B:
391–402.
Boateng, A.A. and Barr, P.V., 1996, A thermal model for the rotary kiln
including heat transfer within the bed, Int J Heat and Mass Transfer,
39: 2131–2147.
Borgwardt, R.H., 1985, Calcination kinetics and surface area of dispersed
limestone particles, AlChE J, 31: 103.
Djuric, M. and Ranogajec, J., 2002, Mathematical modeling in cement
technology, in Ghosh, S.N. (ed.), Advances in Cement Technology:
Chemistry, Manufacture and Testing, 2nd edition (Tech Books Inter-
national, New Delhi, India).
Friedman, S.J. and Marshall, W.R., 1949, Studies in rotary drying, Part I:
Hold up and dusting, Chem Engg Prog, 45(8): 482.
Garcya-Labiano, F., Abad, L.F. de Diego, Gayan, P. and Adanez, J., 2002,
Calcination of calcium-based sorbents at pressure in a broad range of
CO2 concentrations, Chem Eng Sci, 57: 2381–2393.
Gorog, J.P., Brimacombe, J.K. and Adams, T.N., 1981, Radiative heat
transfer in rotary kilns, Met Trans B, 12B: 55–69.
Gorog, J.P., Brimacombe, J.K. and Adams, T.N., 1983, Heat transfer from
flames in a rotary kiln, Met Trans B, 14B: 411–424.
Guo, Y.C., Chan, C.K. and Lau, K.S., 2003, Numerical studies of pulver-
ized coal combustion in a tubular coal combustor with slanted oxygen
jet, Fuel, 82: 893.
Hewlett, P.C., 1998, Lea’s Chemistry of Cement and Concrete (Arnold,
London, UK).
Hills, A.W.D., 1968, The mechanism of the thermal decomposition of
calcium carbonate, Chem Eng Sci, 23: 297–320.
Hindmarsh, A.C., 1983, ODEPACK, a systematized collection of ODE sol-
vers. In: Stepleman, R.S. et al. (eds), Scientific Computing. North-Holland,
Amsterdam, IMACS Transactions on Scientific Computation, 1: 55.
Hottel, H.C. and Sarofim, A.F., 1967, Radiative Transfer, 1st edition
(McGraw-Hill, New York, USA).
Ingraham, T. and Marier, P., 1963, Kinetic studies on the thermal
decomposition of calcium carbonate, Canadian Journal of Chemical
Engineering, 63: 170–173.
Irfan, A. and Dogu, G., 2001, Calcination kinetics of high purity lime-
stones, Chem Eng J, 83: 131–137.
Karki, K.C., Patankar, S.V. and Grant, J., 2000, Simulation of fluid flow,
combustion and heat transfer in a coal-fired cement kiln, FACT-Vol
23/HTD-Vol. 367, Combustion, Fire and Computational Modeling of
Industrial Combustion Systems (ASME).
Khakhar, D.V., McCarthy, J.J., Sninbrot, T. and Ottino, J.M., 1997,
Transverse flow and mixing of granular material in a rotating cylinder,
Phys Fluids, 9(1): 31–43.
Khinast, J., Krammer, G.F., Brunner, Ch. and Staudinger, G., 1996,
Decomposition of limestone: the influence of CO2 and particle size on
the reaction rate, Chem Eng Sci, 51: 623–634.
Khraisha, Y.H. and Dugwell, D.R., 1992, Coal combustion and limestone
calcination in a suspension reactor, Chem Eng Sci, 47: 993–1006.
Kolyfetis, E. and Markatos, N.C., 1996, Aerodynamics and coal – Flame
modeling in burning zone of cement rotary kilns, part 2, ZKG Inter-
national, 49: 326–334.
Kramers, H. and Croockewit, P., 1952, The passage of granular solids
through inclined rotary kilns, Chem Eng Sci, 1: 259–265.
Lebas, E., Hanrot, F., Ablitzer, D. and Houzelot, J.L., 1995, Experimental
study of residence time, particle movement and bed depth profile in
rotary kilns, Can J Chem Engg, 73: 173–180.
Lee, J., Keener, T.C., Knoderera, M. and Khang, S., 1993, Thermal
decomposition of limestone in a large scale thermogravimetric analyzer,
Thermochemica Acta, 213: 223–240.
Li, K.W., 1974, Application of Khodorov’s and Li’s entrainment equations
to rotary coke calciners, AIChE J, 20(5): 1017–1020.
Locher, G., 2002, Mathematical models for the cement clinker burning
process. Part 3: Rotary Kiln, ZKG International, 55(3): 68–80.
Martin, G., 1932, Cement Engineering and Thermodynamics Applied to
the Cement Rotary Kiln (The Technical Press, London, UK).
Martins, M.A., Oliveira, L.S. and Franca, A.S., 2001, Modeling and
simulation of petroleum coke calcination in rotary kilns, Fuel, 80:
1611–1622.
Martins, M.A., Oliveira, L.S., and Franca, A.S., 2002, Modeling and simu-
lation of Limestone calcinations in rotary kilns, ZKG International,
55(4): 76–87.
Mastorakos, E., Massias, A., Tsakiroglou, C.D., Goussis D.A. and
Burganos, V.N., 1999, CFD predictions for cement kiln including
flame modeling, heat transfer and clinker chemistry, Applied Mathe-
matical Modelling, 23: 55–76.
Mujumdar, K.S. and Ranade V.V., 2003, CFD simulations of heat transfer
in transverse plane of rotating kilns, Presented at Chemcon-2002,
Bhubaneshwar.
Paul, M., Mujumdar, K.S. and Ranade, V.V., 2002, Modeling of rotary
cement kilns, Presented at Chemcon-2002, Hyderabad.
Peray K.E., 1986, Rotary Cement Kilns, 2nd edition (Chemical Publishing
Co. Ltd., New York, USA).
Perry, R.H., 1984, Perry’s Chemical Engineers’ Handbook, 6th edition
(Don Green, Mc-Graw Hill, New York, USA).
Ranade, V.V., 2003, Modeling of rotary cement kiln, Third International
Conference on CFD in the Minerals and Process Industries, CSIRO,
Melbourne, Australia.
Ranade, V.V. and Mujumdar, K.S., 2003, CFD simulations of solid motion
in the transverse plane of rotating kilns, Third International Conference
on CFD in the Minerals and Process Industries, CSIRO, Melbourne,
Australia.
Rao, T.R., Gunn, D.J. and Bowen, J.H., 1989, Kinetics of calcium carbon-
ate decomposition, Chem Eng Res Des, 67: 38–47.
Saeman, W.C., 1951, Passage of solids through rotary kilns – Factors
affecting time of passage, Chem Eng Prog, 47: 508.
Satterfield, C.H. and Feakes, F., 1959, Kinetics of the thermal decompo-
sition of calcium carbonate, AIChE J, 5: 115–122.
Sherritt, R.G., Chaouki, J., Mehrotra, A.K. and Behie, L.A., 2003, Axial
dispersion in the three-dimensional mixing of particles in a rotating
drum reactor, Chem Eng Sci, 58(2), 401–415.
Spang, H.A., 1972, A dynamic model of a cement kiln, Automatica, 8:
309–323.
Spurling, R.J., Davidson, J.F. and Scott, D.M., 2001, The transient
response of granular flows in an inclined rotating cylinder, Trans
IChemE, 79: 51–61.
Stanmore, B.R. and Gilot, P., 2005, Review-calcination and carbonation of
limestone during thermal cycling for CO2 sequestration, Fuel Proces-
sing Technology, 86: 1707–1743.
Thunman, H. and Leckner, B., 2002, Thermal conductivity of wood—
models for different stages of combustion, Biomass and Bioenergy,
23: 47–54.
Tscheng, S.H., and Watkinson, A.P., 1979, Convective heat transfer on
rotary kilns, Can J Chem Engg, 57, 433–443.
Watkinson, A.P. and Brimacombe, J.K., 1982, Limestone calcination in a
rotary kiln, Met Trans B, 13B: 369–378.
Vahl, L. and Kingma, W.G., 1952, Transport of solids through horizontal
rotary cylinders, Chem Eng Sci, 1: 253.
ACKNOWLEDGEMENTS
TheauthorswouldliketoacknowledgeVikramCements(GrasimIndustries
Limited) and India Cements Limited for providing the industrial data reported
inthispaper.AuthorswishtoacknowledgefinancialsupportprovidedbyCSIR
(under the NMITLI scheme) for this study. The authors would also like to
acknowledge many helpful discussions with Professor Anurag Mehra during
the course of this work. Author K.S. Mujumdar is grateful to Council of Scien-
tific and Industrial Research (CSIR), India for providing financial support.
The manuscript was received 19 July 2004 and accepted for publication
after revision 13 February 2006.
Trans IChemE, Part A, Chemical Engineering Research and Design, 2006, 84(A3): 165–177
SIMULATION OF ROTARY CEMENT KILNS 177