Download as PDF, PPTX
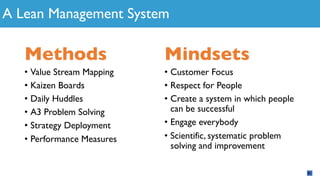

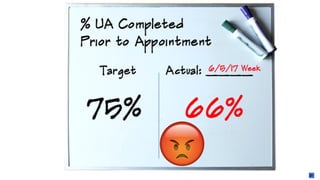

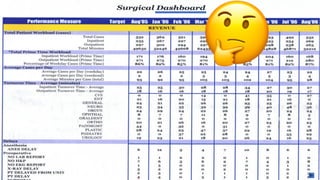

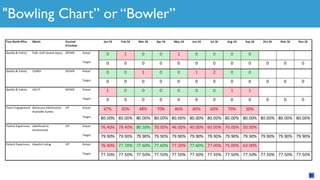
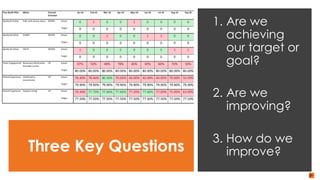
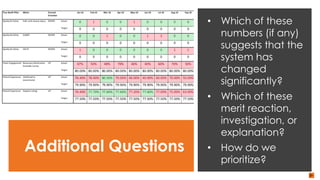
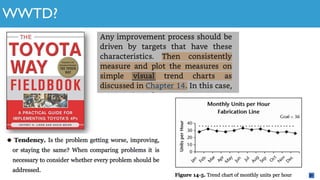
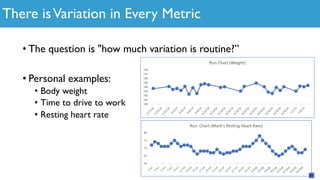
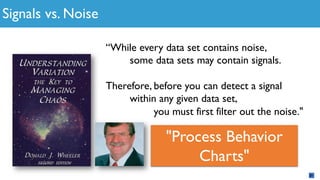
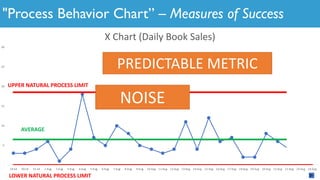
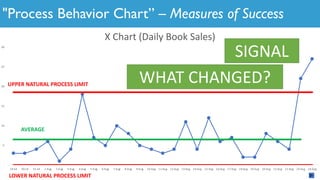

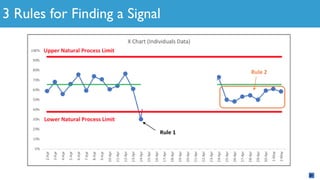
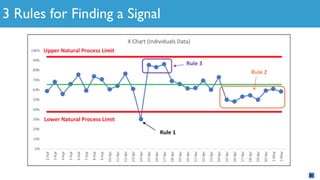


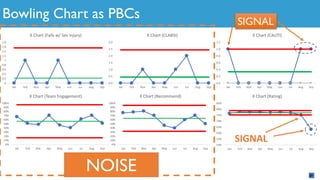
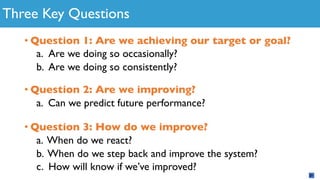
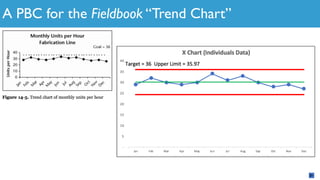
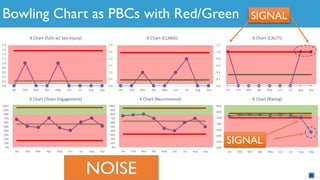

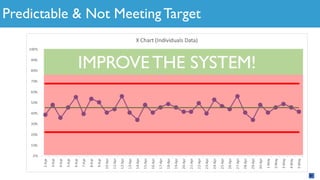
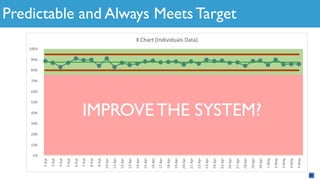
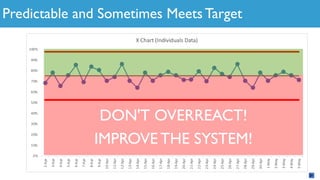
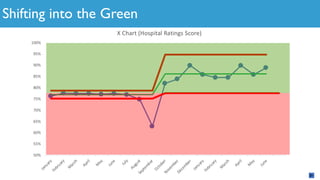
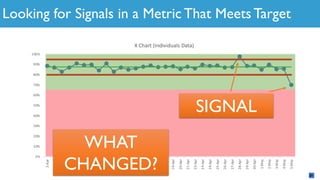
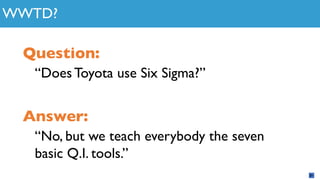

The document discusses improving lean management systems through various methods such as value stream mapping, daily huddles, and performance measures, emphasizing the importance of engaging everyone and fostering a customer-focused mindset. It presents key questions to evaluate success, including whether targets are achieved and how improvements can be made, while also highlighting the necessity of distinguishing between significant signals and noise in data sets. Additionally, it stresses the need to stabilize and improve systems based on the predictability of metrics rather than reacting impulsively.


![Water-Scrum-Fall: The Good, the Bad, and the [Scrum]Butt-Ugly](https://cdn.slidesharecdn.com/ss_thumbnails/water-scrum-fallgood-bad-uglyappleton-200831220632-thumbnail.jpg?width=640&height=640&fit=bounds)

![[Yow! 2019] 3 insights from 4 years at Spotify](https://cdn.slidesharecdn.com/ss_thumbnails/rvbpfzasgyvrfcjf64iw-signature-f2cf7ab4a3bbb3845718f1f906a24f1800046faa92db9223c912b64a2b1d8538-poli-191212214409-thumbnail.jpg?width=640&height=640&fit=bounds)