This document summarizes research on the effects of calcium (Ca), nitrogen (N), and phosphorus (P) additions on tree transpiration rates. The research found that:
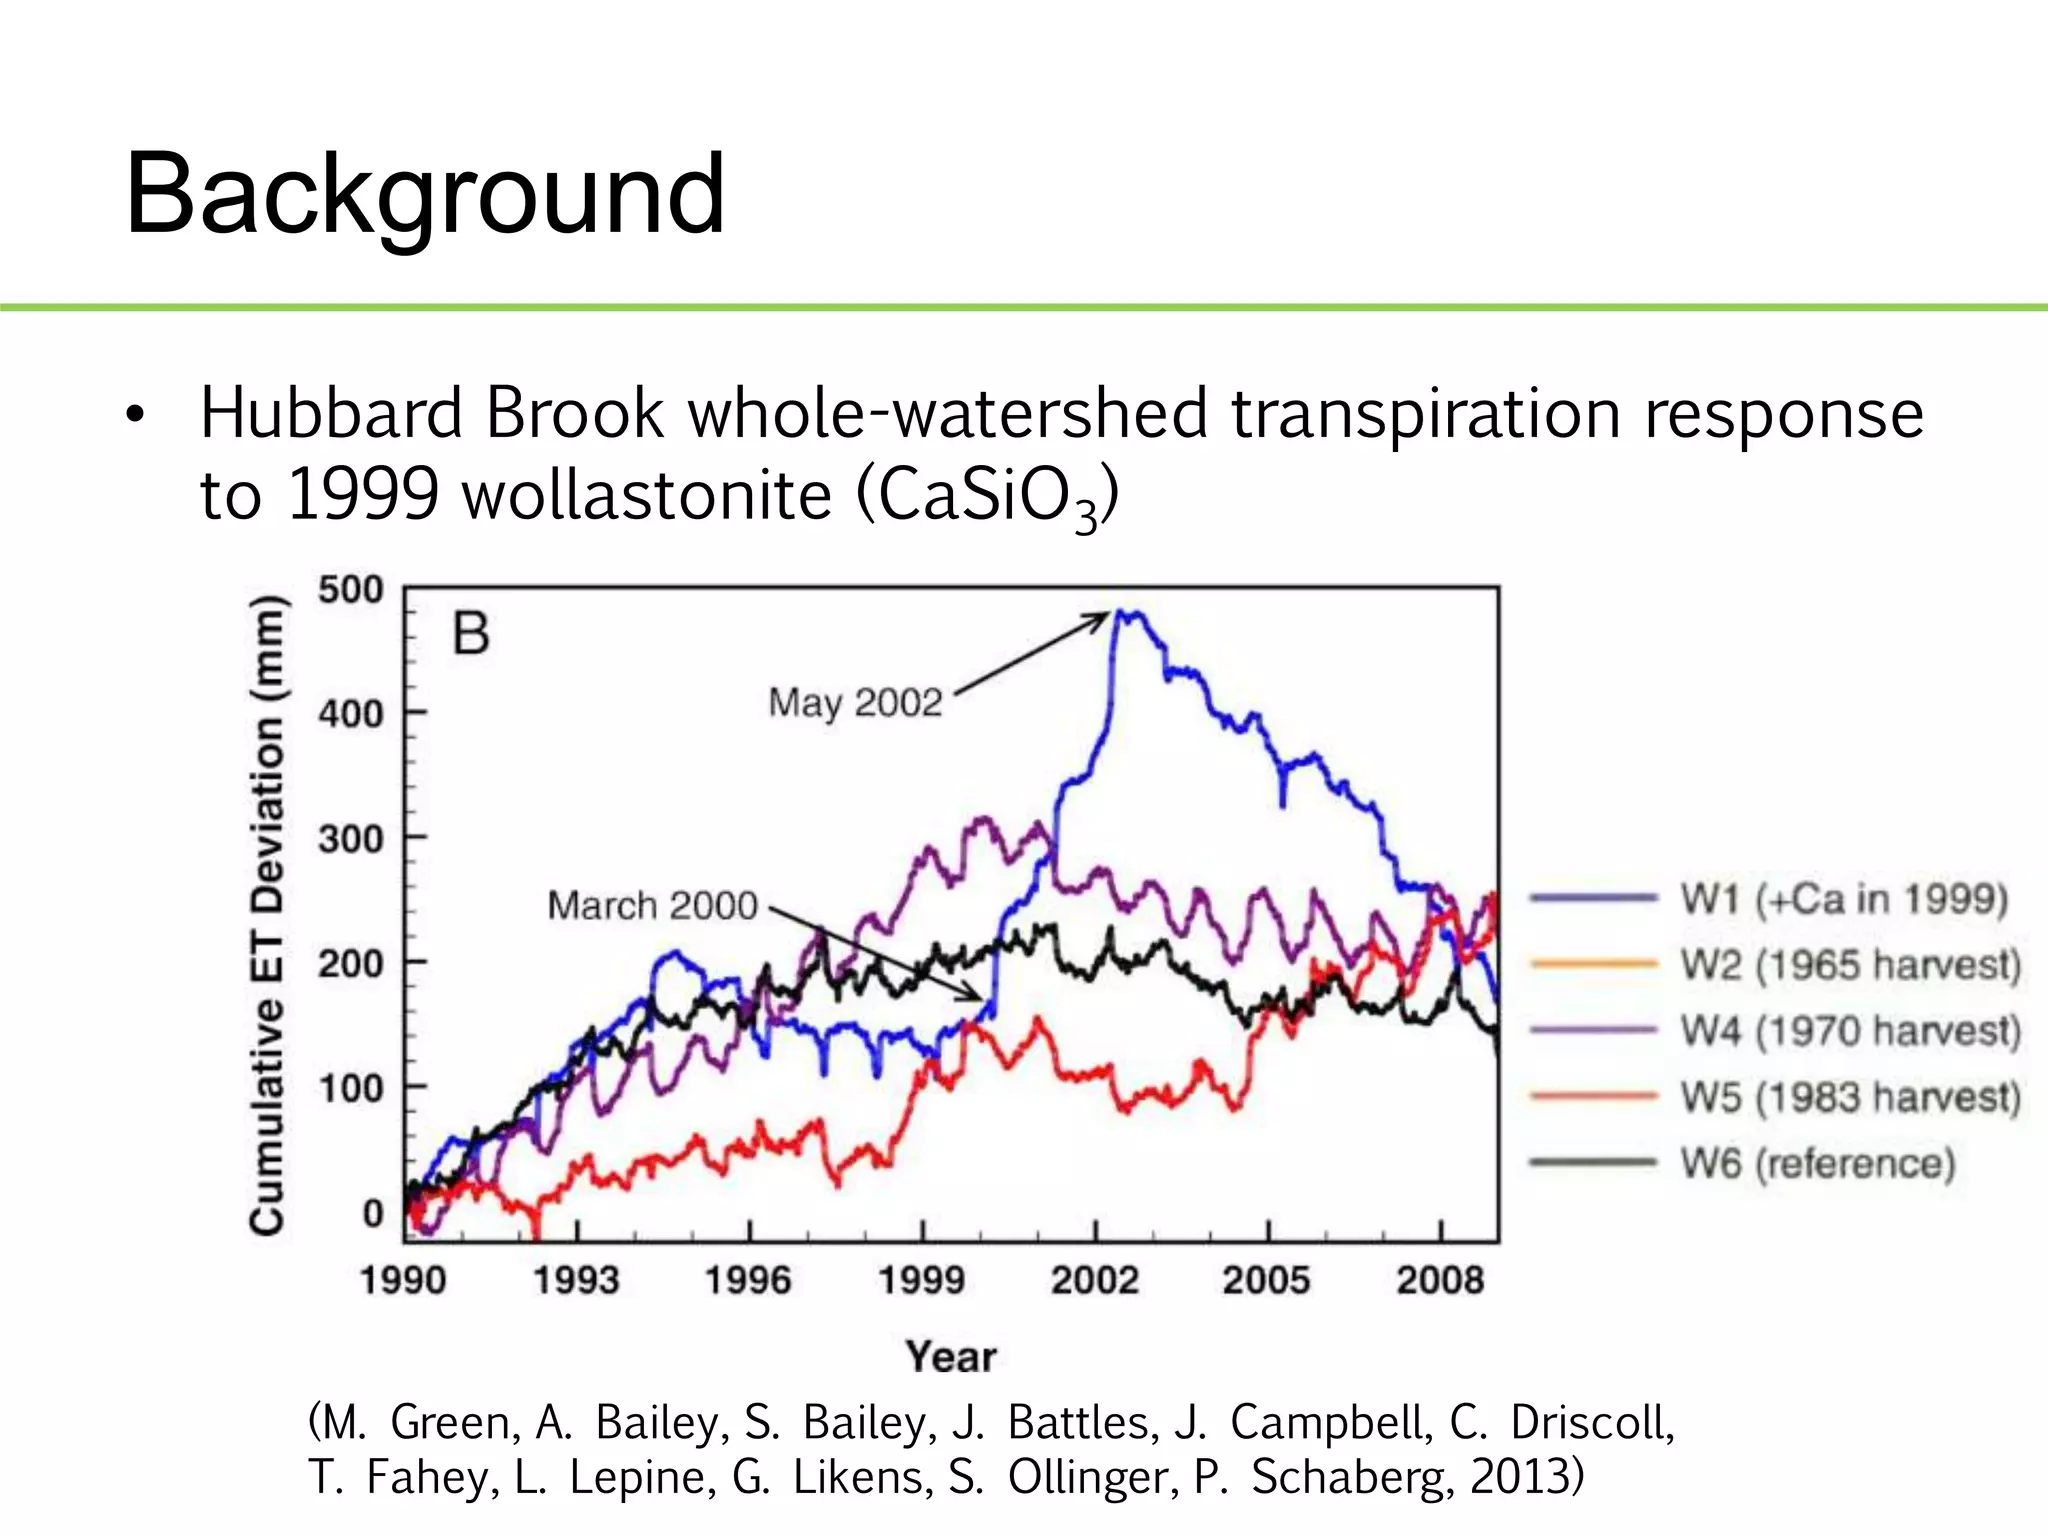
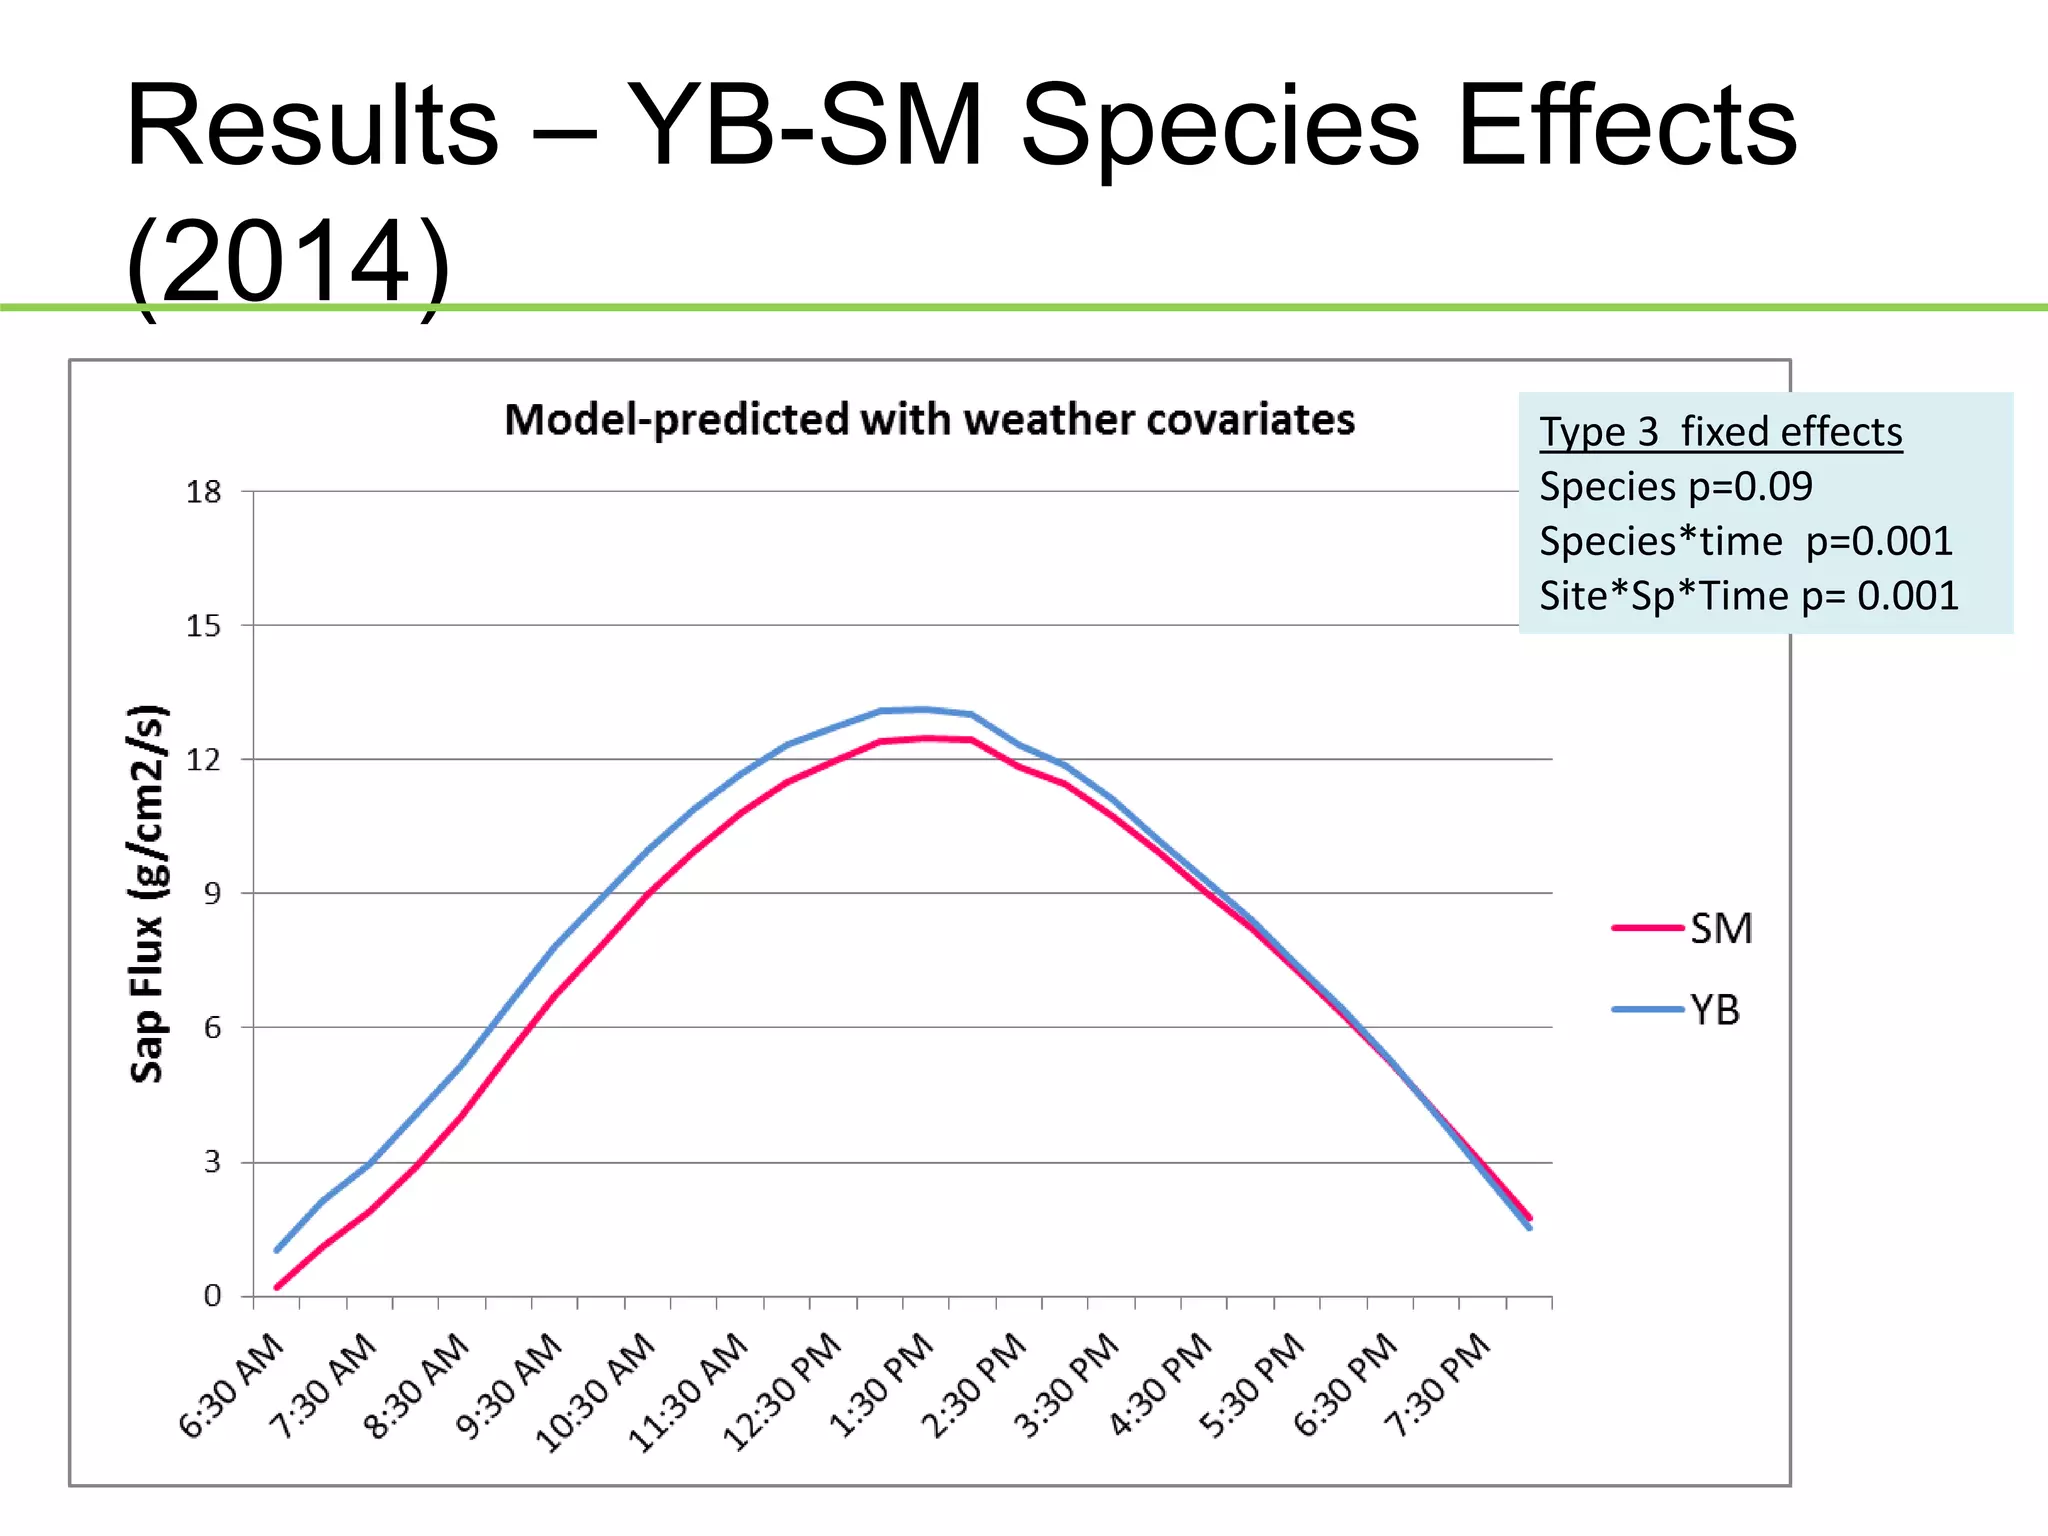
1) A 2014 study found that a one-time addition of calcium silicate (CaSiO3) increased transpiration over the control plots, especially for yellow birch trees. Transpiration rates also varied between tree species and sites.
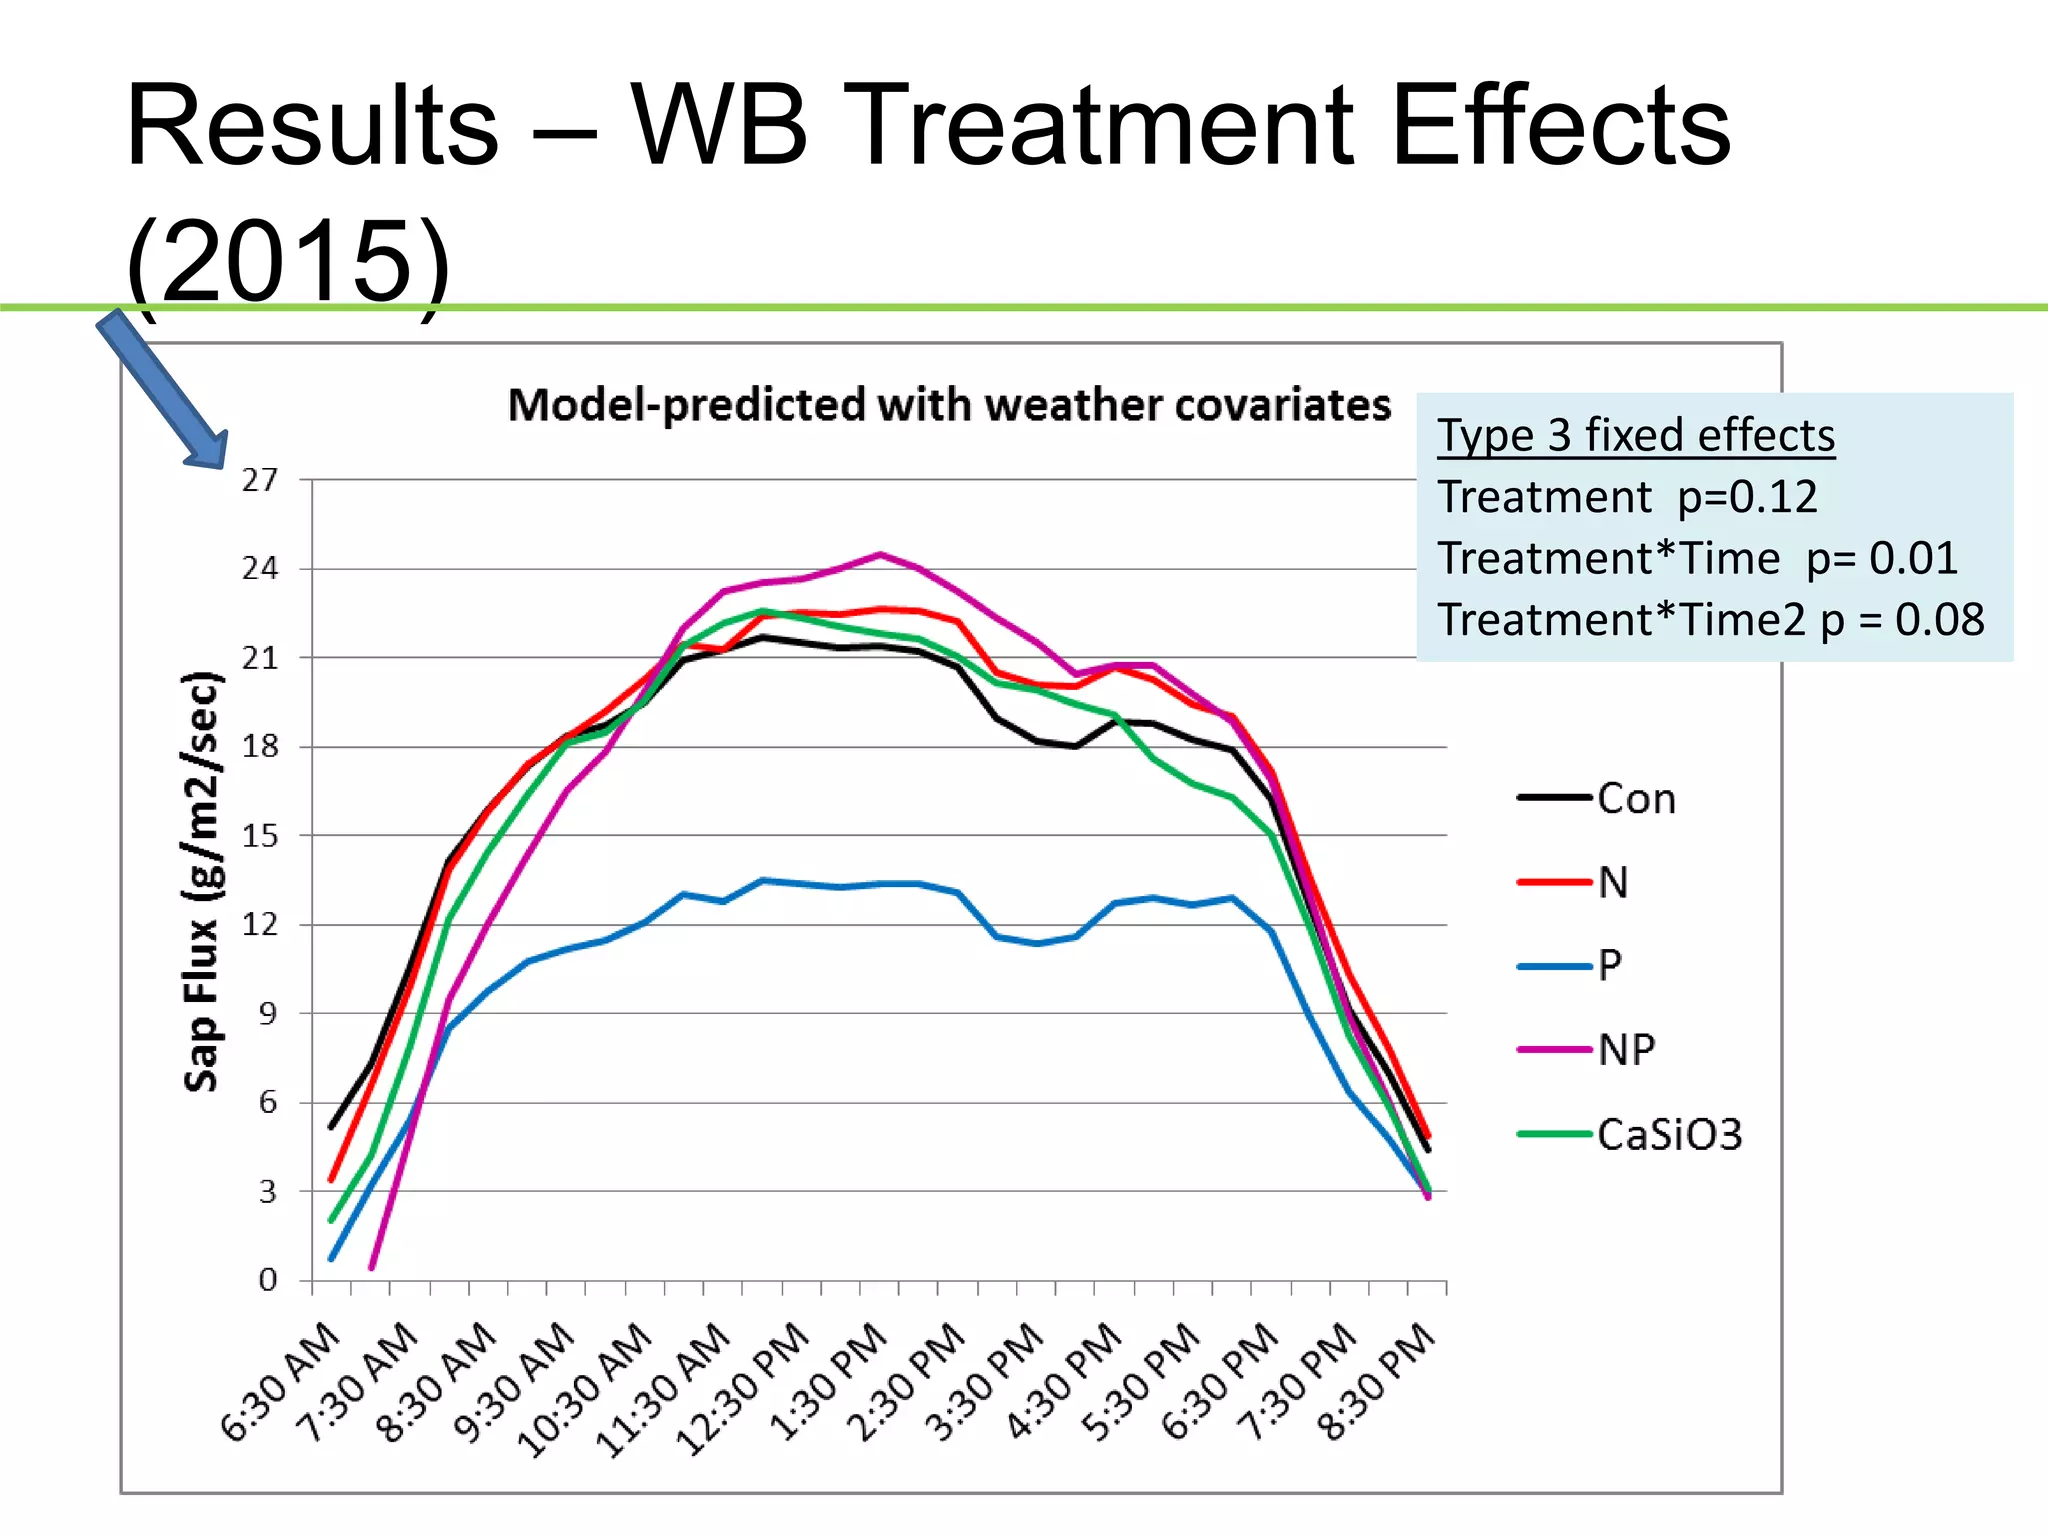
2) A 2015 study found that adding phosphorus (P) alone decreased transpiration rates in white birch trees compared to other treatments.
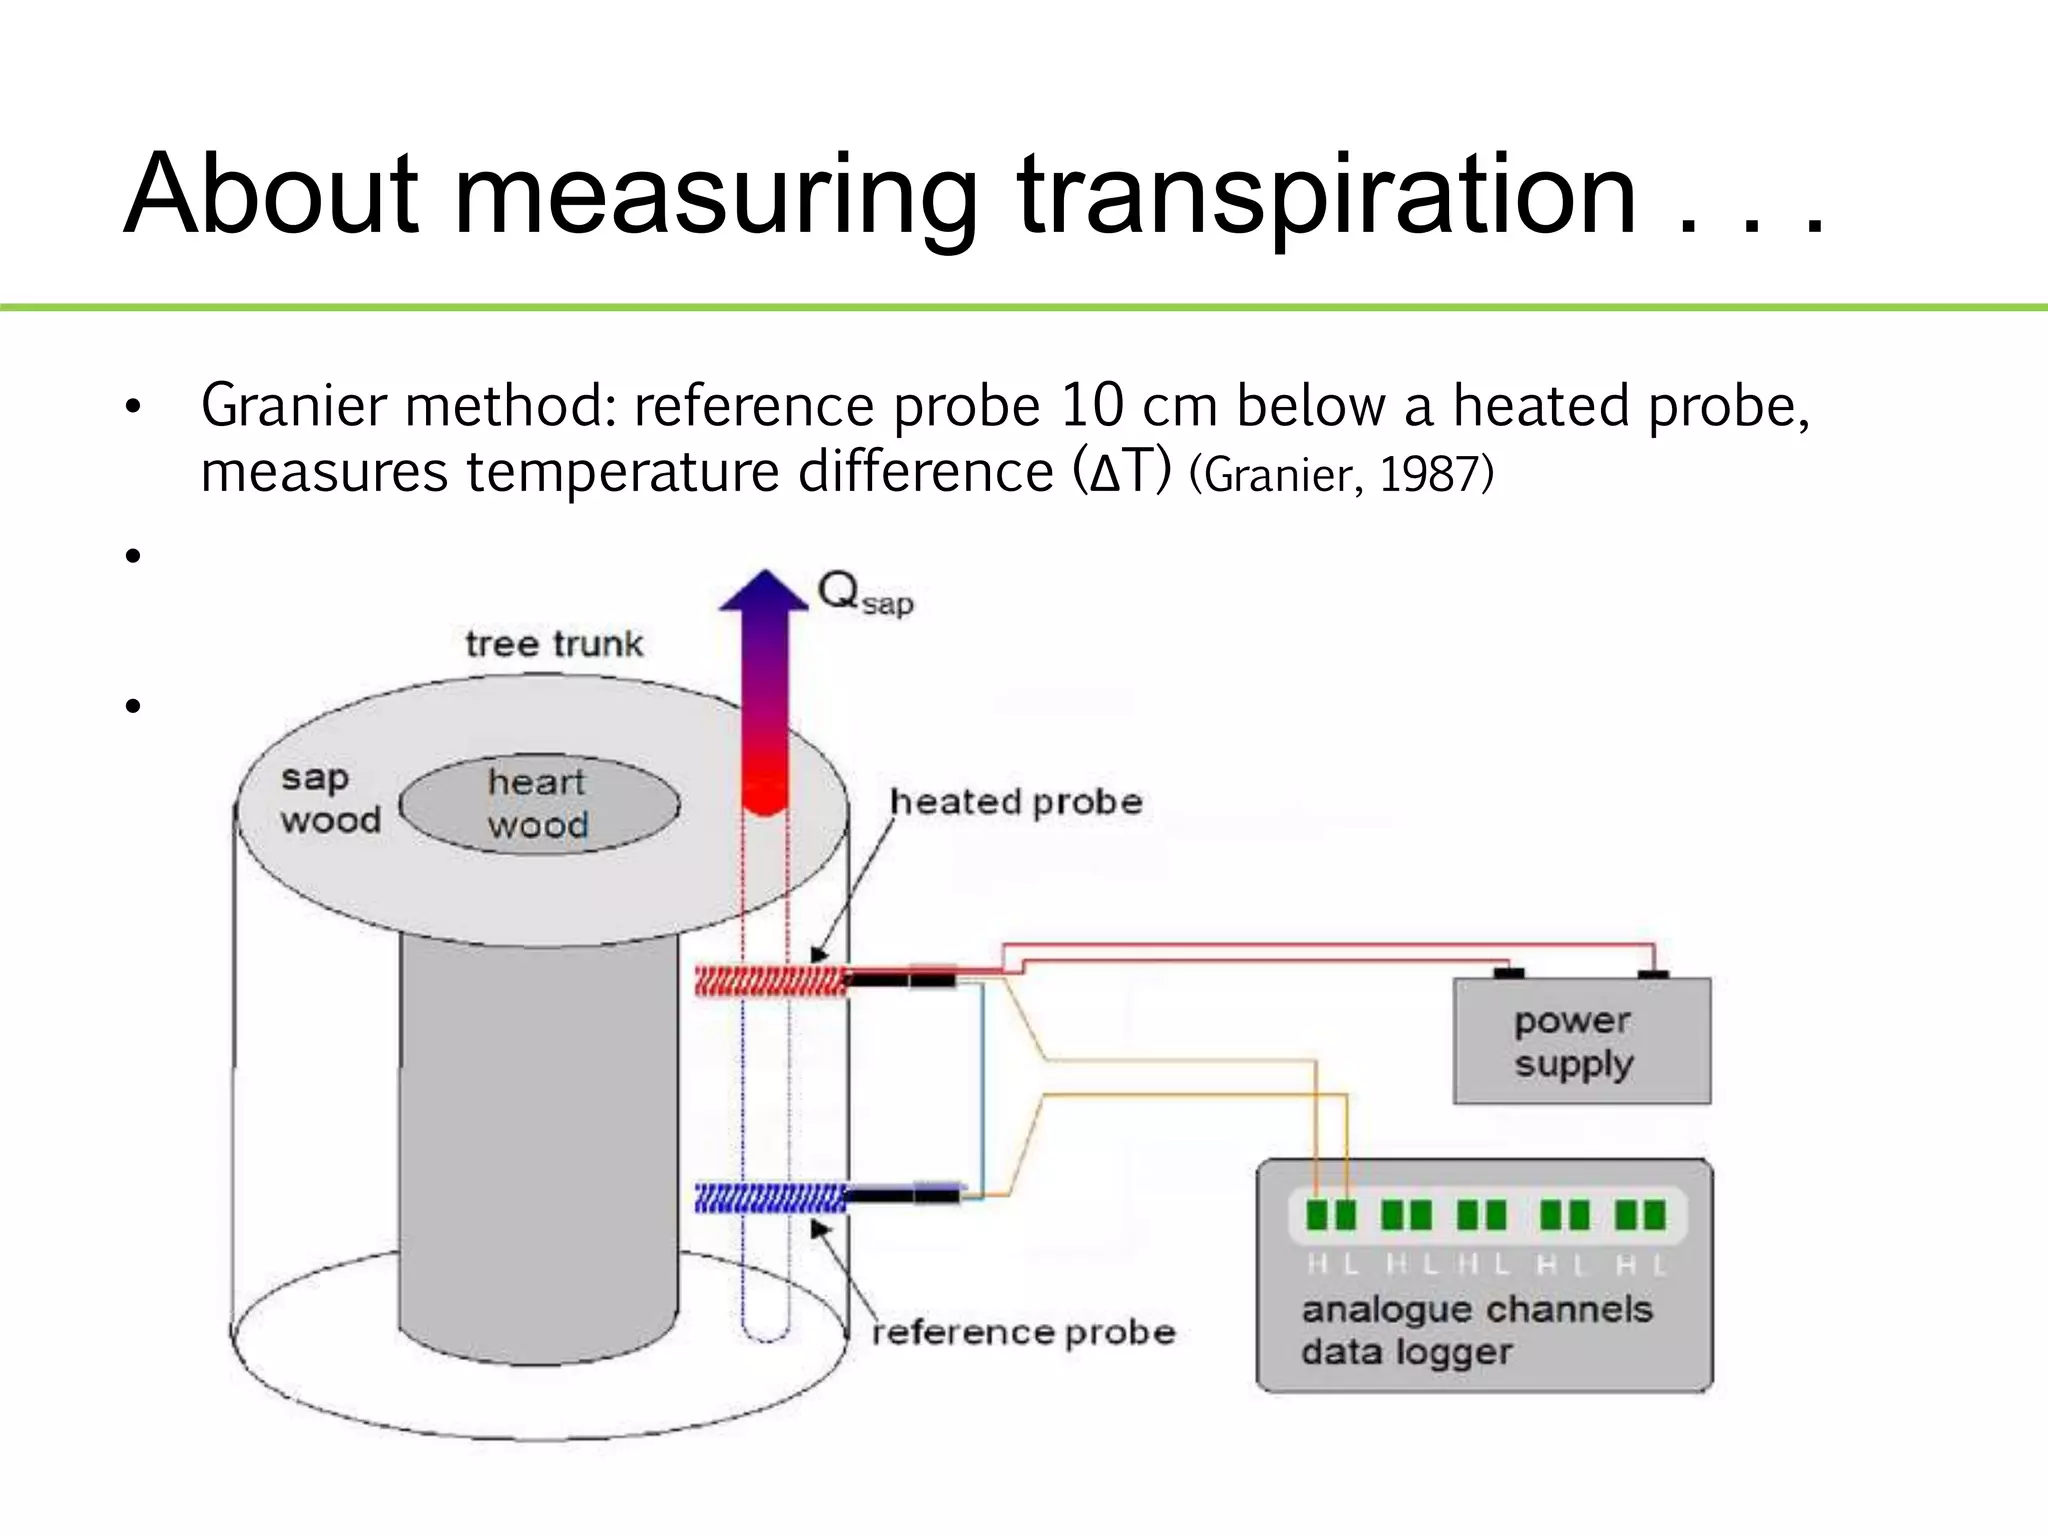
3) Overall, the research suggests that calcium and phosphorus can impact tree water use and transpiration rates. Precise measurements of sap flow