HUBBARD BROOK ECOSYSTEM STUDY, 52nd ANNUAL COOPERATORS' MEETING, Woodstock NH, Wednesday, 8 JULY 2015. Session l: Multiple Element Limitation Study Moderator: Ruth Yanai. Sapflow 2015: Does N or P also affect water use in the MELNHE plots?
Brigid Farrell and Isaac Jo, MELNHE,
Sapflow rates were taken from species of primary canopy dominance over a period of ten days. Optimal rates were used to assess overall productivity in sites of varying nutrient availability.
Surface and soil moisture monitoring, estimations, variations, and retrievalsJenkins Macedo
This presentation explored five leading articles in the remotely sensed and in situ surface and soil moisture monitoring, estimations, variations, and retrievals for global environmental change. The presentation gives insight to the purpose of each study, subjects of investigations, methods used to collect and analyze data sets, results and implications, and conclusions. This project is in fulfillment of the course on remote sensing for global environmental change and precedes our preview on water resources monitoring. This project was conducted by Christina Geller, 5th year accelerated graduate student in Geographic Information Systems for Development, and Environment and Jenkins Macedo, 2nd year graduate students in Environmental Science and Policy at the Department of International Development, Community, and Environment (IDCE) at Clark University. All academic materials used in this study were appropriately referenced (see bibliography for details).
Re-wetting drained peatlands can reduce large greenhouse gas emissionsStankovic G
This presentation was presented during the 2 Parallel session on Theme 3.1, Managing SOC in: Soils with high SOC – peatlands, permafrost, and black soils, of the Global Symposium on Soil Organic Carbon that took place in Rome 21-23 March 2017. The presentation was made by Mr. He Hongxing, from University of Gothenburg - Sweden, in FAO Hq, Rome
Harry Coumnas Published a Paper about Earth’s Mass Extinction in the Year 2100kevin8smith
Harry Coumnas, a researcher of the threshold of catastrophe has accumulated data that the Earth’s sixth mass extinction might become a reality by the year 2100 due to increasing carbon pressure.
Surface Soil Moisture and Groundwater Assessment and Monitoring using Remote ...Jenkins Macedo
This preview is part of the requirement for a comprehensive analysis of remotely sensed surface soil moisture and groundwater assessment and monitoring for global environmental and climate change presented by Christina Geller, candidate for the degree of MSc in Geographic Information Science for Development, and Environment and Jenkins Macedo, candidate for the MS in Environmental Science and Policy at the Department of International Development, Community, and Environmental at Clark University.
Communicating Arctic climate change through data-driven storiesZachary Labe
Arctic Science Summit Week 2021 (Session 2: “The 4 Essential Cs - Coordination, Communication, Community, and Collaboration”):
In this presentation, I will discuss the power of sharing Arctic climate change information through accessible and engaging data visualizations. In particular, I will focus on using social media (Twitter) as one tool for communicating science to broad audiences.
A new framework to test the origins of western American megadroughtScott St. George
We know from tree rings and other natural drought records that the western United States has been affected by several 'megadroughts' during the past millennium. But are these exceptionally long-lasting droughts due to unusual external forcings, or are they inevitable given a sufficiently long period of time? Here we present a statistical model that combines sea surface temperature records and drought severity statistics from the western USA, and use that tool to set out an expectation for megadrought, given no other changes in the climate system. Even though this model was trained using only modern climate data (and incorporates no information from tree rings or other proxies), it still produced megadroughts. Moreover, those simulated megadroughts were just as long-lasting, covered as large an area, and were just as severe as real megadroughts estimated from tree rings. That result means that megadroughts can occur in the western United States even if nothing else changes in the climate -- they really are just a matter of time. On the other hand, the only aspect of real-world megadroughts that the model cannot duplicate was the high number of these events during the so-called Medieval Climate Anomaly (800 to 1300 CE). So that cluster of megadroughts may have been caused by some sort of unusual climate circumstances that have not been observed by us during the past few decades. The proxy record tells us that many different kinds of exceptional or unusual climate events happened in the past. But it is often difficult to determine what caused those exceptional events because even, within a period of a thousand years, we still have very few cases. So besides being an aid to understand the causes of past megadroughts, we hope this approach can be applied to other paleoclimate records to distinguish between real interrelations between separate components of the climate system and simple coincidences.
The need for new theory in global dendroclimatologyScott St. George
So much of what we know about the Earth’s climate during the past two millennia comes from tree rings. Information gleaned from the physical or chemical properties of growth rings in trees have allowed us to extend hemispheric-scale temperature records back by several centuries, construct annual maps of drought severity that span several continents, and generate proxy estimates for many of the leading modes within the climate system. The theoretical foundation that underpins these products — and most others in dendroclimatology — was fully mature by the early 1990s and set out in detail by Cook and Kairiukstis in their seminal book, ‘Methods in Dendrochronology’. Most of the core analytical methods used to infer past climate from tree rings that appear in this reference (as well as prior works) depend on two concepts in particular: first, the idea that patterns common to many trees at many sites are more likely to be related to synoptic-scale climate variability (the principle of replication), and second, the notion that the most useful tree-ring records are found in forests where growth is particularly sensitive to a specific aspect of local climate (the principle of site selection). But because of (i) the gradual expansion, extension, and in-filling of the global tree-ring network and (ii) the emphasis given to atypical or even unique site-specific signals by some novel reconstruction methods, it is a point of debate within our community, at least implicitly, whether these principles remain valid. This presentation will review several recent studies that illustrate the possible advantages offered by a disregard for the usual ‘rules’ of dendroclimatology but will also discuss the potential pitfalls of placing too much emphasis on apparently optimal records. We hope this talk will encourage the sharing of ideas on how best to extract climate information from the ever-expanding network of tree-ring records across our planet and help open a discussion on the relevance of our standard theoretical framework to contemporary global dendroclimatology.
Influence of Climatic Factors on the Δ13c Values of the C3, C4 And CAM Dicot ...QUESTJOURNAL
ABSTRACT: Species of the Centrospermeae occurring at different altitudes were analyzed for δ13C values and assigned for graphical representation. The aridity of the study area was evident as defined using the Klimadiagramm. Climatic data was studied and represented on graphs for interpretation. The frequency ofδ 13C values of the species at different altitudes, namely 500m a.s.l., 1000m a.s.l., 1500m a.s.l., 2000m a.s.l., 2500m a.s.l., 3000m a.s.l., 3500m a.s.l. and 4000m a.s.l., are presented on graphs. The data show thatδ13C values is a good predictor of spatial diversity and shift of the species along the altitudinal gradient of environmental factors.There is phenomenal trend such that δ13C values distribution along altitudinal differentiation the values of -10.60‰, to -16.65‰, -17.75‰ to -18.87‰, and -18.89‰ to -32.42‰ correspond to the species at low altitudes (0m a.s.l. – 1500m a.s.l.), intermediate altitude (1,550m a.s.l.-1,700m a.s.l.) and high altitude (1,800m a.s.l. – 4200m a.s.l.0, respectively. The inverse correlation between temperature and rainfall defines the causal climatic factors affecting C3 and C4 species along the altitudinal gradient. The occurrence of the transition zone between temperature and rainfall mirror that between the relative abundance of the C3 and C4 species along the altitude. This floristic data predict NAD-ME, NADP-ME AND PEP-CK types of monocot-dicot transition along the altitude with respect to bioproductivity in the tropics.
4 Review on Different Evapotranspiration Empirical EquationsINFOGAIN PUBLICATION
For optimal design and management of hydrologic balance and scheduling irrigation models, the need to measure Evapotranspiration is of great importance. It helps in predicting when and how much water is required for any particular irrigation scheme. Reference Evapotranspiration is a standard nomenclature defined by FAO to provide a reference frame although it is not a full proof equation. Several scientists have developed multiple equations based of three primary directions viz. temperature based methods, radiation based methods and mass – transfer methods. Here in this paper, we have carried out a review on most of the popular equations and the objective is to elucidate the advantages and drawbacks each one of them register when put into use. The reference equation for standardization considered here is FAO 56 Penman Montheith equation. Thirty other equations from the three schools have been analysed here. Statistical Regression Analysis methods and coefficient of determination (R2), Root Mean Square Error (RMSE) and index of agreement (d) are the analytical parameters those are to be used while estimating their acceptance in evaluating the throughputs
Workshop held on 1st of April in Vientnane, Laos. Participants from national institurions (agriculture, education, planning) where joining presentations on the overview of climate variability in the Greater Mekong Sub-Region, using crop modeling and land use change analysis.
La Convención de las Naciones Unidas de Lucha contra la Desertificación acaba de publicar un informe en el que se señala la importancia de carbono orgánico de los suelos orientado a los decisores políticos y que se presentará en la próxima reunión de la UNFCCC sobre cambio climático que se celebrará en París (COP21).
Modification and Climate Change Analysis of surrounding Environment using Rem...iosrjce
This review is presented in three parts. The first part explains such terms as climate, climate change,
climate change adaptation, remote sensing (RS) and geographical information systems (GIS). The second part
highlights some areas where RS and GIS are applicable in climate change analysis and adaptation. Issues
considered are snow/glacier monitoring, land cover monitoring, carbon trace/accounting, atmospheric
dynamics, terrestrial temperature monitoring, biodiversity conservation, ocean and coast monitoring, erosion
monitoring and control, agriculture, flood monitoring, health and disease, drought and desertification. The
third part concludes from all illustrated instances that climate change problems will be less understood and
managed without the application of RS and GIS. While humanity is still being plagued by climate change effects,
RS and GIS play a crucial role in its management for continued human survival. Key words: Climate, Climate
Change, Climate Change Adaptation, Geographical Information System and Remote Sensing.
Similar to URC 2015 - Carbon Fluxes Across Four Land Use Types (20)
Modification and Climate Change Analysis of surrounding Environment using Rem...
URC 2015 - Carbon Fluxes Across Four Land Use Types
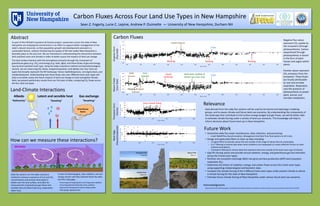
1. Abstract
Carbon Fluxes Across Four Land Use Types in New Hampshire
Sean Z. Fogarty, Lucie C. Lepine, Andrew P. Ouimette — University of New Hampshire, Durham NH
As part of the EPSCoR Ecosystems & Society project, researchers across the state of New
Hampshire are studying the environment in an effort to support better management of the
state's natural resources, so that population growth and development proceed in a
sustainable fashion, without threatening the quality of life that makes New Hampshire a
desirable place to live and visit. We are interested in understanding the interactions between
land use/land cover and climate in order to better assess the impacts of land use change.
The land surface interacts with the atmosphere primarily through the movement of
greenhouse gases (e.g. CO2) and energy (e.g. heat, light), and these fluxes of gas and energy
vary by land use/land cover type. Using the eddy covariance method and biometeorological
sensors, we are measuring CO2 fluxes, evapotranspiration, and albedo over four land use
types that broadly represent the NH landscape: forest, hayfield/pasture, corn/agriculture, and
residential/paved. Understanding how these fluxes vary over different land cover types will
help us to better assess the future impacts of land use change on local and global climate.
Here, we present preliminary results from our first year of data, comparing CO2 fluxes across
the four land use types.
~~~~
Greenhouse
Gases
~~
Albedo Latent and sensible heat Gas exchange
Land-Climate Interactions
“Sweating” “Breathing”“Reflectivity”
How can we measure these interactions?
Eddy flux systems use the eddy covariance
method to measure covariance of H2O and CO2
concentrations and vertical wind speed in
eddies over the land surface, and allow for
measurements of greenhouse gas fluxes and
sensible heat and latent heat (e.g. evaporative
water loss).
A suite of meteorological, solar radiation, soil and
canopy sensors will help interpret these flux data,
and fill in data gaps:
•Incoming and outgoing short and long-wave radiation
•Incoming photosynthetically-active radiation
•Soil and air temperature and humidity probes
•Rain gauge tipping bucket
Negative flux values
represent CO2 uptake by
the ecosystem (through
photosynthesis). Carbon
sequestered through
photosynthesis is stored
in the form of plant
tissues and sugars within
plants.
Positive values represent
CO2 emissions from the
ecosystem. These fluxes
are mostly attributable
to root and microbe
respiration. Respiration
uses the products of
photosynthesis to power
plant, animal, and
microbe metabolism.
Carbon Fluxes
MooreFields
(Cornfield)
KingmanFarm
(Hayfield)
Mowing
Liquid manure
Mowing
Frost
Mowing
Solid
manure
Plowing & liquid
manure
Corn
planted
Liquid
herbicide
Helicopter seeding of
winter rye cover crop
Frost
ThompsonFarm
(Forest)
WestEdge
(Paved/residential)
Moore Fields
Durham, NH
Thompson Farm
Durham, NH
Kingman Farm
Madbury, NH
West Edge
Durham, NH
Data derived from the eddy flux systems will be used by terrestrial and hydrologic modeling
groups, and to assess climate and future land-use scenarios. By understanding the components of
the landscape that contribute to the surface energy budget and gas fluxes, we will be better able
to estimate climate forcing under a variety of land-use scenarios. This knowledge will help to
inform decisions about future land use in New Hampshire.
• Streamline eddy flux tower maintenance, data collection, and processing.
– Install SMARTFlux (Synchronization, Management And Real Time flux) systems at all 4 sites.
• Design and apply data filters to clean up data including:
– 1) logical filters to exclude values that are outside of the range of values that are reasonable,
– 2) u* filtering to remove data when wind conditions are inadequate to create sufficient friction to meet
method assumptions,
– 3) footprint filtering to remove data that represent land area outside of the land cover type of interest.
• Gap-fill missing values and provide annual radiation, energy, and greenhouse gas flux estimates
across the 4 land cover types.
• Partition net ecosystem exchange (NEE) into gross primary production (GPP) and ecosystem
respiration (Re).
• Determine the drivers of radiation, energy, and carbon fluxes across the 4 land cover types
using supporting meteorological and biometric data.
• Compare the climate forcing of the 4 different land cover types under present climate to derive
a climate forcing for the state of New Hampshire.
• Estimate future climate forcing of New Hampshire under various future land use scenarios.
Relevance
Future Work
Acknowledgments
Support for the NH EPSCoR program is provided by the National Science Foundation’s Research Infrastructure Improvement Award # EPS 1101245.
Flow module failed