1. Asia Pacific Journal of Marketing & Management Review__________________________________________ ISSN 2319-2836
Vol.2 (7), July (2013)
Online available at indianresearchjournals.com
57
A STUDY ON FINANCIAL PERFORMANCE OF SAKTHI FINANCE
LIMITED
ARVIND.R*; DR.V.SRIVIDYA**
*AP/ SUGUNA COLLEGE OF ENGINEERING,
COIMBATORE, TAMILNADU
** HEAD OF FINANCIAL DEPARTMENT,
PSG INSTITUTE OF MANAGEMENT,
COIMBATORE, TAMILNADU
_____________________________________________________________________________________
ABSTRACT
This research paper provides the Financial Statement and also a summary of the account of a
business enterprise. To understand the financial performance and condition of a firm, its stakeholders
look at the financial statements, viz., the balance sheet, the profit and loss account. The analysis of
the financial statement is a process of evaluating the relationship between component parts of
financial statement top obtains a better understanding of the firms, position and performance. This
study attempts to analyze the financial performance of Sakthi Finance Limited, by using various
tools.
_____________________________________________________________________________________
1. INTRODUCTION TO THE STUDY
Financial performance is a technique that attempts to determine a security’s value by focusing on
underlying factors that affect a company’s actual business and its future prospects. On a broader
scope, it is possible to perform financial performance on industries or the economy as a whole.
The term simply refers to the analysis of the economic well- being of a financial entity as
opposed to only its price movements. Balance sheet shows the financial position of the firm at
the accounting. It shows how the firm performed financially over the accounting period. Sources
and uses of funds statement it shows what have been the sources and uses of funds during the
accounting period etc.,
2. INTRODUCTION TO THE INDUSTRY
The role of NBFC’s is not different from that of bank mobilizing money from people with the
promise of repaying more. No wonder that nearly 40,000 NBFC’s set up establishments to
mobilize money with a promise of high interest. The Indian economy is growing through a
period of rapid “financialiation”. Today a wide range of financial institutions through customer
friendly financial products is conducting the “intermediation”. Repeated evaluation of the role of
NBFC’s by study group set up periodically by the Government has confirmed that “NBFC’s
usefully supplement the activities of banks in the fields of both deposits mobilization and
lending. NBFC’s are capable of playing a dynamic role in the economy.
2. Asia Pacific Journal of Marketing & Management Review__________________________________________ ISSN 2319-2836
Vol.2 (7), July (2013)
Online available at indianresearchjournals.com
58
3. INTRODUCTION TO THE COMPANY
Sakthi Finance Limited was incorporated in 1955, a Non-Banking financial company. The
company was called as “Pollachi Credit Society” as a group in-house financial arm for TELCO
Dealership. At starting stage the company mainly catered exclusively to the hire purchase
business. Sakthi finance now positioned itself as a niche player and is now focusing on the
commercial vehicle re-finance segment. Sakthi Finance limited is a unit of Sakthi Group
promoted by Dr.N.Mahalinhgam. It has 21 branches located in TamilNadu, Kerala, Andhra
Pradesh and Maharastra with specific focus on TamilNadu and Kerala.
4. FINANCE
Sakthi Finance Limited is acknowledged as a best leader in the world of finance because it is
unique in some of the service it offers. This has enabled it to efficiently disburse cheaper source
of direct finance to various industries through public deposits. One of the first company to
introduce finance for all kinds of needs.
5. STRENGTHS OF SAKTHI FINANCE
Business focused executives at all levels.
Availability of infrastructure to place funds through its wide network of branches.
Valuable dealership network for Maruthi, TELCO and Bajaj Vehicles.
6. MAIN OBJECTS OF THE COMPANY
The main objects of the company as set out in the Memorandum of Association and Articles
of Association of the company are:
To purchase, sell, exchange, deal in or invest in shares, debentures, bonds, stock of
Joint Stock Company, firms, local bodies or governments.
To carry on the business of underwriters, sub-underwriters, brokers, managers,
advisors, consultants to issue of shares, debentures, bonds, fixed deposits and other
securities of syndication of loans, project finance, working capital facilities and
deferred payment facilities.
7. OBJECTIVES OF THE STUDY
The study of financial performance of Sakthi Finance Ltd in India has been undertaken with the
following objectives in view.
To Study the efficiency and liquidity position of the company.
To offer suggestions for improving the financial performance.
3. Asia Pacific Journal of Marketing & Management Review__________________________________________ ISSN 2319-2836
Vol.2 (7), July (2013)
Online available at indianresearchjournals.com
59
8. SIGNIFICANCE OF THE STUDY
This study may be useful for future decisions.
The study gives an idea to the public about the liquidity position of the company.
9. LIMITATIONS OF THE STUDY
The inflation rate and the time value of money were not taken into consideration for the analysis.
When the new norms were analyzed with the activities of the company only data that could be
collected from the annual report of the company were taken for the analysis.
10. RESEARCH DESIGN
This study is based on descriptive research. Descriptive research, also known as statistical
research, describes data and characteristics about the population or phenomenon being studied.
Descriptive research answers the questions who, what, where, when and how. Although the data
description is factual, accurate and systematic, the research cannot describe what caused a
situation. Thus, Descriptive research cannot be used to create a causal relationship, where one
variable affects another. In other words, descriptive research can be said to have a low
requirement for internal validity. The description is used for frequencies, averages and other
statistical calculations. In short descriptive research deals with everything that can be counted
and studied.
11. METHOD OF DATA COLLECTION
The study is based on secondary data. The data’s are collected from the company websites and
the annual report of the company. (Source: http://money.rediff.com/companies/sakthi-finance-
ltd/).
Accurate data from the Balance sheet of the company were used for the study.
12. TOOLS FOR ANALYSIS
In this study the financial performance of the company is analyzed based upon the following
tools
Ratio Analysis.
Comparative balance sheet.
Common size balance sheet.
Cash Flow Statement.
Some of the ratio’s which taken for the study is stated below.
12.1 CURRENT RATIO
Current ratio may be defined as the relationship between current assets and current liabilities.
This ratio, also known as working capital ratio, is a measure of general liquidity and is most
4. Asia Pacific Journal of Marketing & Management Review__________________________________________ ISSN 2319-2836
Vol.2 (7), July (2013)
Online available at indianresearchjournals.com
60
widely use to make the analysis of a short-term financial position. It is calculated by dividing the
total of current assets by total of the current liabilities.
Formula: Current ratio = (Current Assets / Current Liabilities)
12.2 QUICK RATIO
Quick ratio also known as acid test or liquid ratio is a mere rigorous test of liquidity refers to the
ability of pay its short-term obligation as and when they become due. Quick ratio may be defined
as the relationship between quick/ liquid assets and current or liquid liabilities.
Formula: Quick Ratio = Liquid Assets / Current Liabilities
12.3 ABSOLUTE LIQUID RATIO
Absolute liquid ratio is also called as liquidity ratio. It includes cash in hand at bank and
marketable securities or temporary investments. There is opinion that the absolute liquid ratio
should be calculated together with current ratio and acid test ratio. This type of ratio is not
widely used in practices.
Formula: Absolute Liquid Ratio = Absolute Liquid Assets / Current Liabilities
12.4 EQUITY RATIO
A variant to the debt equity ratio which is also known as equity ratio or shareholders to total
equities ratio or net worth to total asset ratio. This ratio establishes the relationship between
shareholders funds to total assets of the firm. The ratio of properties funds to total funds is an
important ratio for determining long-term solvency of a firm.
Formula: Equity Ratio = Shareholders Funds / Total Assets.
Equity Ratio serves as an example of one such analysis of the project listed below with its table
and the figure for the better understanding of the project . They are as follows:
5. Asia Pacific Journal of Marketing & Management Review__________________________________________ ISSN 2319-2836
Vol.2 (7), July (2013)
Online available at indianresearchjournals.com
61
Equity Ratio
Table 12.4
Year Ratio
2004-05 0.20
2005-06 0.25
2006-07 0.25
2007-08 0.19
2008-09 0.60
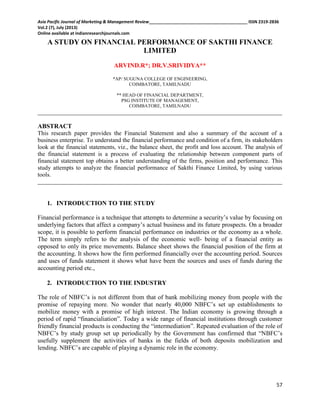
Table 12.4 Highlights the Equity Ratio of SFL. The Equity Ratio showed a constant of 0.25% in 2005-06
and 2006-07 however it showed a decrease in 2007-08. It’s indicating the better solvency position of the
financial year 2008-09.
EQUITY RATIO
Figure No. 12.4
0.3
0.1
0.2
0.3
0.4
0.5
0.6
Ratio
Year
Ratio 0.2 0.25 0.25 0.19 0.6
2004-05 2005-06 2006-07 2007-08 2008-09
6. Asia Pacific Journal of Marketing & Management Review__________________________________________ ISSN 2319-2836
Vol.2 (7), July (2013)
Online available at indianresearchjournals.com
62
12.5 CURRENT ASSETS TO PROPRIETORS FUND
This ratio is calculated by dividing the total of current assets by the amount of shareholders
funds. The ratio indicates the extent to which proprietors funds are invested in current assets.
There is no rule of thumb for different firms.
Formula: Current Assets to Proprietors Fund = Current Assets / Shareholders Funds
Current Assets to Proprietors Fund serves as an example of one such analysis of the project listed
below with its the table and the figure for the better understanding of the project . They are as
follows:
Current Assets to Proprietors Fund
Table .12.5
Year Ratio
2004-05 4.59
2005-06 3.76
2006-07 3.71
2007-08 5.01
2008-09 5.74
Table 12.5 Evident the current Assets to Proprietors funds ratio of SFL. The ratio of current asset
to proprietor’s funds was increasing from 4.59 in 2004-05 to 5.74 in 2008-09. It influences that
the current assets are more in the year 2008-09.
7. Asia Pacific Journal of Marketing & Management Review__________________________________________ ISSN 2319-2836
Vol.2 (7), July (2013)
Online available at indianresearchjournals.com
63
CURRENT ASSETS TO PROPRIETORS FUND
Figure No. 12.5
12.6 ANALYSIS OF COMMON SIZE BALANCE SHEET
Only the Interpretation given being the sheet is in huge size for both of the ANALYSIS OF
COMMON SIZE BALANCE SHEET and COMPARATIVE CASH FLOW STATEMENT too.
INTERPRETATION
Assumed total income as 100 sales shows a fluctuating trend it was low 96.76 during the period
2004 – 2005 and high 100.79 during the period 2007-2008. The total Expenditure was high 99.85
during the period 2003 – 2004 and low 94.16 during the period 2007 – 2008, it shows that the
company has started reducing the expenses. The net profit was low 0.15 during the period 2003 -
2004 and high 5.84 during the period 2007-2008; it shows that the net profit has an increasing
trend during the period of study.
12.7 COMPARATIVE CASH FLOW STATEMENT
INTREPRETATION
It is inferred that, in the financial year 2007- 08, Rs. 367.28 Lakhs respectively had been
debited to the profit and loss account as provision for Income-tax earlier years, which are
pertaining to the financial years prior to the financial year 2004. Also in the financial year
2009, Rs.1.70 lakhs had been credited to the Profit and Loss Account on account of
withdrawal of earlier year income tax provision, which is pertaining to financial years
prior to financial year 2004.
The above analysis is an evident that the company has better liquidity positions.
0
1
2
3
4
5
6
Ratio
Year
Ratio 4.59 3.76 3.71 5.01 5.74
2004-05 2005-06 2006-07 2007-08 2008-09
8. Asia Pacific Journal of Marketing & Management Review__________________________________________ ISSN 2319-2836
Vol.2 (7), July (2013)
Online available at indianresearchjournals.com
64
The assets of the company found to be handled well.
Profits have increased. Net Profit and cash profit ratios shows that company’s profit and
assets has been increased.
The efficiency of the company found high, since the assets also handled well.
Return on investment also good since the company financial position found to be good.
13. FINDINGS AND SUGGESTIONS
13.1 Findings
The current and quick ratios were found to be satisfactory.
The Absolute liquid and equity ratio found to be in good solvency position
The Return on Gross Capital Employed shows an increasing trend. The
profitability and the liquidity position of the company were good.
The assets were very well handled and the efficiency of the company being
higher.
The Return on Equity Capital was found to be Fluctuating and Expenses Ratio of
Interest and Bank Charges were found to be decreasing.
The cash Profit Ratio shows an increasing trend.
The company has better return on investment since profit is high.
In the common size statement the Assets side, Stock-on-Hire showing an
increasing trend in the Current Assets. In the Liabilities side Secured Loan found
to be shown with an increasing trend.
The trend percentage of the various components of profit and loss account of the
SFL from 2004-05 to 2008-09. Interest earned and operating expenses shows an
increasing trend over the period of study. In the case of other income and interest
expended shows a varying trend over the years. In the case of net profit it shows
an increasing trend up to 2008-09.
The net profit was low 0.69 during the period 2004 -2005 and high 14.62 during
the period 2008 -2009; it shows that the net profit has an increasing trend during
the period of study. The Company can provide fair rate of return to retain their
Equity Shareholders.
13.2 Suggestions
The Company can introduce a new attractive scheme for the depositors.
The Company should reduce the Administration and Office Expenses to increase their
Net Income.
9. Asia Pacific Journal of Marketing & Management Review__________________________________________ ISSN 2319-2836
Vol.2 (7), July (2013)
Online available at indianresearchjournals.com
65
The programme of the SFL should be analyzed every time to time by some financial
experts, so that heavy changes in financial performance can be reduced.
The company can concentrates more on reserves for the expansion of the business in the
future.
Deposits are to be increased for the purpose of expanding total business cost of the
deposit should be moderate.
In the current ratio it seems to be good strength. But when compared to the previous
years it seems to be decreasing, so the company has to keep an eye on this ratio.
CONCLUSION
The financial performance of the company is better. Though the NBFC’s are very old concept in
India, but it has developed with added strength during 1990’s of 20th
Century. Many NBFC’s
have failed in their businesses that lead to social unrest among the public. The Government of
India has introduced regulatory norms to regulate the NBFC’s since it is in unorganized setup.
Sakthi Finance is one among those successful companies. Hence, the researcher has made an
attempt to analyze the performance of Sakthi Finance. In general, Sakthi Finance has showed
very good performance, in the past Five Years. But the researcher has also found many short
falls, after a careful analysis, researcher has offered many valuable suggestions to the company
and which would be very useful to them.
CITATIONS
Books
1. Prasanna Chandra (2008), “Fundamentals of financial management”. New Delhi: Tata Mc Graw – Hill
2. Dr.S.N.Maheswari (2007), “Financial management Principles”. New Delhi: Sultan Chand & Sons
3. I.M.Pandey (2004), “Financial management”. New Delhi: Vikas publishing house Pvt. Ltd.
Journal Article
1. Zeljana Aljinovic Barac (2003), Cash Flow Ratios vs. Accrual Ratios: Empirical Research on
Incremental Information Content. Vol. 15, Iss. 2; pg. 206, 8 pgs
2. Gary Kirk and Shabnam Beth Nolan (2005), Non profit management and leadership. San
Francisco: Vol. 20, Iss. 4; pg. 473
3. K.K. Raman (1990), Risk Evaluation of Financial Performance. Vol. 12, Iss.3, Pg 209.
Websites
1. www.sakthifinancelimited.com
2. www.money.rediff.com/sakthifinancelimited/
3. http://wrightreports.ecnext.com/coms2/reportdesc_COMPANY_C3565KD00