SlideShare a Scribd company logo
1 of 9
Download to read offline
Research Article
Journal of Advanced Research in Economics and Business Management
Copyright (c) 2021: Author(s). Published by: Advanced Research Publications
Journal of Advanced Research in Economics and Business Management
Volume 4, Issue 2 - 2021, Pg. No. 36-44
Peer Reviewed Journal
I N F O A B S T R A C T
Corresponding Author:
Nitesh S Vibhute, Faculty of Business Studies
MBA, Sharnbasva University Kalaburagi, India.
E-mail Id:
niteshsv21@gmail.com
How to cite this article:
Vibhute NS, Haralayya B, Jeelan BV. Performance
Evaluation of Selected Banks using Ratio Analysis.
J Adv Res Eco Busi Mgmt 2021; 4(2): 36-44.
Date of Submission: 2021-11-25
Date of Acceptance: 2021-12-03
Performance Evaluation of Selected Banks using
Ratio Analysis
Nitesh S Vibhute1
, Bhadrappa Haralayya2
, Jeelan Basha V3
1
Assistant Professor, Faculty of Business Studies MBA, Sharnbasva University Kalaburagi, India.
2
HOD and Associate Professor, Department of MBA, Lingaraj Appa Engineering College Bidar, India.
3
Dean and Professor of Commerce, Vijayanagara Sri Krishnadevaraya University, Bellary, India.
Ratio analysis a accounting tool, which can be used to measure the
solvency, the probability and the over all financial strength of a business,
by analyzing its financial accounts (specifically the balance sheet and
profit and loss account). It is a quantitative method of gaining insight
into company’s liquidity,operational efficiency and profitability by
comparing information contained in its financial statements. Ratio
analysis can be used to establish a trend line for one company’s results
over a large number of financial reporting periods. This can highlight
company changes that would not be evident if looking at a given ratio
that represents just one point in time.
Keywords: Financial ratios, Operating revenue, Smart bank, Eagles
model, Investment project
Introduction
Banks are life blood & the nervous system of the Indian
economy. Banking plays an important role in the economic
development of a country & forms the core of money
market in an advanced country. In India, the money market
is characterized by the existence of both the organized
& unorganized sectors. The organized sector includes
commercial bank, co-operative banks & regional Rural banks
while the unorganized sectors includes indigenous bankers
and private money lenders. Among the banking institutions
in the organized sector , the commercial banks are the
oldest institutions having a wide network of branches,
commanding utmost public confidence and having the
lion’s share in the total banking operations. Initially, they
were established as corporate bodies with share-holding
by private individuals, but subsequently there has been a
drift towards state ownership and control.
In modern times banking is the kingpin of all business
activity. It is an important instrument of mobilizing the
community’s resources through institutional framework.
As a matter of fact, economic & industrial development of a
country depends, is the main, upon how efficiently funds are
managed by the banks. Hence, banking plays an important
in the economic development of the country. Adequacy of
capital and competency of management are the two pillars
upon which the earnings of the banks depend. Sufficiency
of capital instills depositor’s confidence, which helps in
mobilizing of deposits. Increase in deposits increases the
leading business & therefore enhances the possibilities
of income generation for the bank. Moreover, a bank
with a sound capital base can take business opportunity
more effectively and can concentrate well on dealing with
problem arising from unexpected loses. The success &
survival of a bank depends to a great extent upon the
dedication & competence of its managers. A smart bank
manager can, not only help to mobilize resources and deploy
them in profitable channels, the manager can also reduce
the amount of idle balances and help to more profits. The
banks now focus on integrated balance sheet management
where all the relevant factors which effect an appropriate
balancesheetcompositiondeserveconsideration.Therefore
various components of balance sheet are analyzed keeping
in view the strengths of a bank. Analyzing assets & liability
behaviour means managing both assets and liabilities
simultaneously for the purpose of minimizing the adverse
37
Vibhute NS et al.
J. Adv. Res. Eco. Busi. Mgmt. 2021; 4(2)
impact of interest rate movement, providing liquidity &
enhancing the market value of equity.
Statement of the Problem
Financial ratios are used almost universally by companies of
allsizestoprovidenumericalinformationontheprofitability,
health & direction of the business. Financial ratios provide
useful analysis & can help drivemanagement toward making
better decisions if they are interpreted correctly. However,
there are some drawbacks to relying on these metrics.
Analysis and interpretation of financial statement is a
regular exercise to review the performance of the company.
It was proposed to conduct a review to study the short
term prospects as well as the long term trends & to arrive
at the conclusion on the performance of the company.
Performance review resulting in taking corrective action
optimizes the performance in the subsequent period.
Aftergoingthroughexistingliteratureofthelibraryreviewing
various articles from everywhere and knowledgeable
discussion with the concerned respected guide & by
following the existing circumstances, the researcher has
selected this topic, after considering available information,
data, existing literate, external sources of information &
other inclusive source. Researcher has framed following
problem for this work.
Need for the Study
Ratio analysis is a quantitative method of gaining insight
into a company’s liquidity, operational efficiency and
profitability by comparing information contained in
its financial statements. Effective planning & financial
management are the keys to running a financially successful
small business. Ratio analysis is critical for helping you
understand financial statements, for identifying trends over
time and for measuring the overall financial state of your
business. In addition, lenders & potential investors often
rely on ratio analysis when making lending and investing
decisions.
Significance of the Study
This study for the financial performance in major aspects
as under:
1.	 It helpful in simplifying financial data.
2.	 It helpful in analysis of financial strength.
3.	 It helpful in decision-making.
4.	 It help financial forecasting.
5.	 It help in financial planning.
Scope of the study
The scope of the study is limited to collecting financial data
published in the annual reports of the company every year.
The analysis is done to suggest the possible solutions. The
study is carried out 5 years (2015-2019). It is analyze and
interpret the relevant data of the company in a balanced
way ratio analysis. The analysis is done to suggest the
possible solutions.
Objectives of the Study
•	 To evaluate the performance of sample banks using
liquidity or short-term solvency, long-term solvency
•	 To assess the operating efficiency of the business
•	 To help in comparative analysis, inter-firm and intra-
firm comparisions
Research Methodology
The main aim of the study is to know the financial
performance of the banks.
Research
Any efforts which are directed to study of strategy needed
to identify the problems and selection of best solutions for
better results are known as research.
Research Design
Inviewoftheobjectsofthestudylistedaboveanexploratory
research design has been adopted. Exploratory research is
one which largely interprets & already available information
and it lays particular emphasis on analysis and interpretation
of the existing and available information.
•	 To know the financial status of the company
•	 To know the credit worthiness of the company
•	 To offer suggestion based on research finding
Research Methodology
Eagles model is basically ratio-based model for evaluating
the performance of banks. It is a management tool that
measures earnings, asset quality, growth, liquidity, equity
and strategy. The present study adopts analytical and
descriptive design. The data of the sample banks from
2011 to 2019 has been collected from annual reports
published by banks. Thirteen variables related to Eagles
model are used in the study. For analyzing and interpreting
the results, the statistical tools used are arithmetic mean,
standard deviation, coefficient of variation, growth rate
and t-test. The t-test is used to test the hypotheses. It
determines the significant difference between the average
value of selected public and private sector banks. The
SPSS 19 software is used for data analysis. The present
study is based on secondary data that has been collected
from the annual reports and websites of the respective
banks, magazines, journals, documents and other published
information. The total assets of the selected banks for
2015 are presented in Eagles’ model has been adopted for
analyzing and comparing the banks. The following Eagles’
parameters are considered for the study: Earnings (ROA,
RONW and IOR), Asset Quality (gross NPA, net NPA and
provision coverage ratio), Growth (loans and deposits),
38
Vibhute NS et al.
J. Adv. Res. Eco. Busi. Mgmt. 2021; 4(2)
Liquidity (loan-to-deposit and investment-to-deposit ratio),
Equity (capital adequacy) and Strategy (interest income to
interest cost and non-interest income to non-interest cost).
Ratio
Meaning
Ratio is also a relationship between two groups or amounts
that expresses how much bigger one is than the other.
In other words ratio is the relationship between two
amounts, represented by two numbers or a percentage,
expressing how much bigger one is the other.
Ex:- 2:6, 8:4 etc.
Definition
In mathematics, a ratio is a comparison of two or more
numbers that indicates their sizes in relation to each other.
A ratio compares two values. It shows you that when you
have this much of something, you will need to have that
much of something else.
Ratio Analysis
Ratio analysis is the process of determining and interpreting
numerical relationship based on financial statements.
In other words, ratio analysis is the technique of inter-
pretation of financial statements with the help of accounting
ratios derived from the balancesheet and profit & loss
account.
Types of Ratio Analysis
Basic EPS
Earning Per Share (EPS), also called net income per share,
is a market prospect ratio that measure the amount of net
income earned per share of stock outstanding. In other
words, this is the amount of money each share of stock
would receive if all of the profits were distributed to the
outstanding shares at the end of the year.
EPS or basic earnings per share is calculated by subtracting
preferred dividends from net income & dividing by the
weight average common shares outstanding. The earnings
per share formula looks like this.
EPS = Net income preferred dividends/ Weighted average
common shares outstanding.
Book Value (Excl.Reval reserve)/ Share
Book value of equity per share (BVPS) is the equity available
to common shareholders divided by the number of
outstandings shares. This represents the minimum value
of a company’s equity.
BVPS metric can be used by investors to gauge whether a
stock price is undervalued, by comparing it to the firm’s
market value per share.
BVPS = Total equity preferred equity/ Total shares out-
standings.
Book Value (Incl.reval Reserve)/ Share
Revaluation reserve is an accounting term used when a
company creates a line item on its balance sheet for the
purpose of maintaining a reserve account tied to certain
assets. This line item can be used when a revaluation
assessment finds that the carrying value of the asset has
changed.
Operating Revenue/ Share
Operating revenue is revenue generated from a company’s
primary business activities. Distinguishing operating
revenue from total revenue is important as it provides
valuable information about the productivity & profitability
of a company’s primary business operations.
Net Profit Share
The net profit ratio includes the total revenue of the firm.
It takes into account both the operating incomes as well
as non-operating income. Then it compares net profits to
these incomes. This ratio too represented as a percentage.
The formula for net profit ratio is.
This ratio helps measure the overall profitability of the firm.
It indicates the portion of the net revenue that is available
to the proprietors. It also reflects on the efficiency of the
business is a very important ratio for investors & financiers.
Net profit ratio = Net profit/Net revenue*100 (or)
= Net profit after tax/Net sales
Net Profit Margin
The net profit margin is equal to how much net income or
profit is generated as a percentage of revenue. Net profit
margin is the ratio of net profits to revenues for a company
or business segment.
It is typically expressed as percentages but can also
be represented in decimal form. The net profit margin
illustrates how much of each dollar in revenue collected
by a company translates into netprofit.
NPM = R - COGS - E - I - T/ R*100
Where:
R = Revenue
COGS = The cost of goods sold
E = Operating & other expenses
I = Interest
T = Taxes
Net Income per Employee Ratio
It is a company’s net income divided by no of employees.
This number shows the company how efficient it is with its
employees. Theoretically, the higher the net income per
employee the better. Aside from increasing the productivity
of employ’s, this number could be increased by a number
of other factors.
39
Vibhute NS et al.
J. Adv. Res. Eco. Busi. Mgmt. 2021; 4(2)
Interest Income Ratio
It is the amount paid to an entity for lending its money or
letting another entity use in funds. On a large scale, interest
income is the amount earned by an investor’s money that
he places in an investment project. A very simple & basic
way of computing it is by multiplying the principal amount
by the interest rate applied, considering the number of
months or years the money lent.
Interest income is usually taxable income & is presented
in the income statement for the simple reason that it is
an income account.
Total Assets Ratio
Total debt to total assets is a leverage ratio that defines
the total amount of debt relative to assets. This metric
enablescomparisonsofleveragetobemadeacrossdifferent
companies.
In other words total debt to assets is a measure of the
company’s assets that are financed by debt, rather than
equity.
TD/ TA = Short-term debt + Long-term debt / Total assets.
Interest Expense Ratio
Interest expense is the cost of money or recorded on the
income statement.
In other words interest expense is the cost incurred by an
entity for borrowed funds. It is a non-operating expense
shown on the income statement. It represents interest
payable on any borrowings-bonds, loans, convertible debt
or lines of credit.
Data Analysis and Interpretation
Earnings per Share
The below graph and table 1 interpreates that the basic
EPS among five responded out of which HDFC bank EPS
level very high then compare to the next four despondence
where has the data collected & mentioned below state that
the five years EPS level of HDFC (58.916) is high and later
SBI(7.452) returns EPS level is second highest & the next
EPS level of Axis bank (20.1) and rest to respondance that
is Canara and Andhra bank have a negative rate in their
EPS levels that is Canara bank -8.03 and Andhra bank 8.36
respectively and even it has been clearly explained with
the help of graph mentioned below.
The above table (Table 2) interpreates that the book value
among the five respondance the Canara bank has the
highest returns from the last 5 years is 461.34 with the
risk level of 67.88% and the HDFC bank has an returns of
368.29 with the risk level of 117.76% later the Axis bank
gives up to returns of 230.178 & with the risk level of 27.07%
and next to respondance SBI has returns of 230.928 with
the risk level of 29.53%. And the last respondance that is
Andhra bank which has the least returns that is 126.22
with the risk level of 55.53%.
From the above information I can suggest that Axis bank
has on highest growth rate when compare to the next four
respondance with growth rate of 0.082%. Hence we can
conclude that the book value are Axis bank is highest/ the
gives the best returns and better book value per share.
Year   Basic EPS (Rs.)      
  SBI HDFC AXIS Canara Andhra
Mar-15 17.55 42.15 31.18 58.59 10.82
Mar-16 12.98 48.84 34.59 -53.61 8.6
Mar-17 13.43 57.18 15.4 20.63 2.56
Mar-18 -7.67 67.76 1.13 -70.47 -42.12
Mar-19 0.97 78.65 18.2 4.71 -21.66
Returns 7.452 58.916 20.1 -8.03 -8.36
Risk 10.47563936 14.60552395 13.40044216 53.38121767 22.8658479
Consistency 1.405748706 0.247904202 0.666688665 -6.647723247 -2.73514927
Growth -0.515131854 0.168759858 -0.125924758 -0.467524841 #NUM!
Table 1
Figure 1
40
Vibhute NS et al.
J. Adv. Res. Eco. Busi. Mgmt. 2021; 4(2)
Year Book Value (Excl. Reval Reserve) (Rs.)
SBI HDFC AXIS Canara Andhra
Mar-15 172.04 247.39 188.47 556.68 166.94
Mar-16 185.85 287.47 223.12 484.75 161.41
Mar-17 196.53 349.12 232.83 474.01 166.87
Mar-18 217.69 409.6 247.2 396.59 90.24
Mar-19 247.53 547.89 259.27 394.68 45.64
Returns 203.928 368.294 230.178 461.342 126.22
Risk 29.53352366 117.7697407 27.07627504 67.88665311 55.53506505
Consistency 0.144823289 0.319771 0.117631898 0.147150385 0.439986255
Growth 0.095215552 0.219910048 0.082997638 -0.082386329 -0.276903421
Table 2
Figure 3
The above graph and table interpreates that the operating
revenue of Canara bank is highest out of five respondance
in which the average returns of Canara bank is with 721.67%
and for the remaining respondance where the returns of
HDFC 274.93, SBI with returns of 230.944 andhra bank
with returns of 202.16.
From this analysis I can interpreate that Canara bank has
given an highest them compare to the rest four respondance
and Axis bank has the lowest returns with less operating
revenue.
Year Operating Revenue(Rs.)
SBI HDFC AXIS CANARA ANDHRA
Mar-15 204.13 193.38 149.67 920.67 271.52
Mar-16 211.26 238.2 172.02 810.73 258.89
Mar-17 220.13 270.46 185.98 692.92 264.66
Mar-18 247.07 309.2 178.37 562.6 149.93
Mar-19 272.13 363.43 213.82 621.45 65.63
Returns 230.944 274.934 179.972 721.674 202.126
Risk 28.19453635 65.24216259 23.26905176 144.6604294 91.24658969
Consistency 0.122083866 0.23730118 0.129292622 0.200451214 0.451434203
Growth 0.074527158 0.170852815 0.093272418 -0.093588201 -0.298827064
Table 3
Figure 2
41
Vibhute NS et al.
J. Adv. Res. Eco. Busi. Mgmt. 2021; 4(2)
The above graph and table interpreates that the net profit
among five responded out of which HDFC bank is net profit
level is very high than compare to the next four respondance
where has mentioned the above the state that the five years
net profit level of returns 58.192 of HDFC is high and later
Axis bank level of returns 20.034 is second highest of net
profit and next SBI level of returns 7.43 andhra bank level
of returns -3.41 and lastly Canara bank level of returns
-5.824 respectvely and even has been clearly explained
with the help of graph mentioned above. I can suggest
that the HDFC is gives the highest and best returns than
compare to the respondance to the net profit.
The above graph and table interpreates that the net profit
margin among five respondance out of which the HDFC
bank is highest out of five respondance and the returns
21.11% and remaining respondance where the returns of
SBI bank 3.602%, Axis bank with the returns of 11.63%,
Canara bank with the returns of -1.506% and lastly Andhra
bank returns of -5.154%.
Finally I can suggest that HDFC bank is gives the highest
return than compare to another respondance. So we can
conclude that HDFC bank is gives the best return to the
net profit margin.
The above graph and below table 6 interpreates that the
interest income among five respondance with the returns of
SBI 6.768%, HDFC with the returns of 8.04%, Axis bank with
the level of return 7.272%, Canara bank with the returns of
7.288% and finally Andhra bank with the returns of 8.052%.
Year Net Profit Margin (%)
SBI HDFC AXIS Canara Andhra
Mar-15 8.59 21.07 20.73 6.17 3.90
Mar-16 6.06 20.41 20.06 -6.38 3.06
Mar-17 5.97 20.99 8.26 2.17 0.96
Mar-18 -2.96 21.79 0.60 -10.23 -18.98
Mar-19 0.35 21.29 8.50 0.74 -14.71
Returns 3.602 21.11 11.63 -1.506 -5.154
Risk 4.747754206 0.50019996 8.612339984 6.658500582 10.83167946
Consistency 1.318088341 0.023694929 0.740527944 -4.421315127 -2.101606415
Growth -0.55071831 0.002600187 -0.199788284 -0.411513318 #NUM!
Year Net Profit (Rs.)
SBI HDFC AXIS Canara Andhra
Mar-15 17.55 40.76 31.04 56.87 10.59
Mar-16 12.82 48.64 34.51 -51.8 7.93
Mar-17 13.15 56.78 15.36 18.78 2.56
Mar-18 -7.34 67.38 1.07 -57.58 -28.47
Mar-19 0.97 77.4 18.19 4.61 -9.66
Returns 7.43 58.192 20.034 -5.824 -3.41
Risk 10.2964727 14.58145809 13.37503757 48.57272619 16.02578079
Consistency 1.385797133 0.25057496 0.66761693 -8.340097218 -4.699642461
Growth -0.515131854 0.17388809 -0.125061058 -0.466414002 #NUM!
Table 4
Figure 4
Table 5
42
Vibhute NS et al.
J. Adv. Res. Eco. Busi. Mgmt. 2021; 4(2)
Figure 5
The lowest level of returns recorded in CANARA bank.
•	 The growth rate of book value recorded in ANDHRA
bank,CANARAbank,AXISbank,HDFCbankandSBIbank
as -0.276, -8.082, 0.082, 0.219 & 0.095 respectively.
The highest level of growth rate recorded as AXIS bank
and lowest is HDFC bank.
•	 Among five years out of five respondance the level of
returns operating revenue as recorded in SBI bank,
HDFC bank, AXIS bank, CANARA bank and ANDHRA
bank as 230.944, 274.934, 179.972, 721.674 & 202.126
respectively. The highest level of returns recorded as
CANARA bank and lowest is AXIS bank.
•	 The total level of returns for net profit as recorded in
SBI, HDFC, AXIS, CANARA & ANDHRA banks as Rs.7.43,
58.192, 20.034, -5.824 and -3.41 respectively. The
lowest level of returns is recorded ANDHRA bank &
highest is recorded as HDFC bank.
•	 The study found that in the year Mar 2015-19, the
returns of net profit margin of HDFC bank (21.11%) is
the highest among all the selected banks followed by
SBI, AXIS andHRA bank and CANARA bank (-1.506%)
has the lowest returns of net profit margin.
•	 The study found that in the year Mar 2015-19 andHRA
bank (8.052%) has performed well and has the highest
levelofreturnsofinterestincomeandSBIbank(6.768%)
have lowest returns among all the selected banks.
Suggestions
•	 The banks should improve their capital base by issuing
more share to the public or through government
contribution.
•	 The banks should bring new product/services based
on the aspirations of customers.
•	 The bank should motivate and impart right knowledge
about banking to their staff.
•	 Thebanksshouldbeimprovethefinancialperformance.
Figure 6
Year Interesy Income (%)
SBI HDFC AXIS Canara Andhra
Mar-15 7.44 8.20 7.68 7.98 8.33
Mar-16 6.95 8.49 7.80 7.96 8.81
Mar-17 6.48 8.02 7.40 7.09 8.11
Mar-18 6.38 7.54 6.62 6.68 7.42
Mar-19 6.59 7.95 6.86 6.73 7.59
Returns 6.768 8.04 7.272 7.288 8.052
Risk 0.432978059 0.348783601 0.513926065 0.64239396 0.563045291
Consistency 0.0639743 0.043381045 0.070671901 0.088144067 0.069926141
Growth -0.029874054 -0.007710675 -0.027833338 -0.041696569 -0.022989584
Table 6
Finally I can suggest that Andhra bank is highest returns
than compare the respondance the SBI, HDFC, AXIS &
CANARA bank with the returns 8.052%. We can conclude
that Andhra bank is highest and gives the best return to
the interest income.
Findings
•	 The level of returns of Basic EPS recorded in SBI bank,
HDFCbank,AXISbank,CANARAbankandANDHRAbank
as 7.452, 58.916, 20.1, -8.03 and -8.36 respectively.
The highest level of returns records in HDFC bank.
43
Vibhute NS et al.
J. Adv. Res. Eco. Busi. Mgmt. 2021; 4(2)
Conclusion
The project of ratio analysis in the production concern is
not merely a work of the project. But a brief knowledge and
experience of that how to analyze the financial performance
of the firm. The study undertaken has brought in to the
light of the following conclusions. According to this project
I came know that from the analysis of financial statements
the banking industry play important role in nation’s growth/
development and entire economy revolves around its
strength. In modernization and growth is mirror of nation’s
economy which can be only achieved by heavy investment
largely borrowed funds. Banks being socio-economic entity
depending largely upon leverage financing are bound to
satisfy their investors and stakeholders and have to justify
risk undertaken by them.
In last, along with performance it is also important for a
bank to understand the relationship between profitability
& variables in balanced scorecard frame work, since
performance can be improved if the influencing factors
are known. Banks are organizer, promoter and architect
of nation economy, their growth is regarded as mirror of
nation economical strength. In order to become global from
local they have to become competitive and fundamentally
strong. This study has revealed the fact that future of Indian
banks is bright, they are achieving the expected targets and
will grow with time and become more competitive under
unforeseen circumstances and will make India proud of
their strategic universal economic domination.
References
1.	 Haralayya B, Aithal PS. Inter Bank Analysis of Cost
Efficiency Using Mean. International Journal of
Innovative Research in Science, Engineering and
Technology 2021; 10(6): 6391-6397.
2.	 Haralayya B, Aithal PS. Analysis of Total Factor
Productivityand Profitability Matrix of Banks By Hmtfp
and FPTFP. Science, Technology and Development
Journal 2021; 10(6): 190-203.
3.	 Haralayya B, Aithal PS. Analysis of Banks Total Factor
Productivity by Aggregate Level. Journal of Xi’an
University of Architecture & Technology 2021; 13(6):
296-314.
4.	 Haralayya B, Aithal PS. Analysis Of Banks Total Factor
Productivity By Disaggregate Level. International
Journal of Creative Research Thoughts 2021; 9(6):
488-502.
5.	 Haralayya B. Importance of CRM in Banking and
Financial Sectors. Journal of Advanced Research in
Quality Control and Management  2021, 6(1): 8-9.
6.	 HaralayyaB.HowDigitalBankinghasBroughtInnovative
Products and Services to India. Journal of Advanced
Research in Quality Control and Management  2021;
6(1): 16-18.
7.	 Haralayya B. Top 5 Priorities That will Shape The Future
of Retail Banking Industry in India. Journal of Advanced
Research in HR and Organizational Management 2021;
8(1&2): 17-18.
8.	 Haralayya B. Millennials and Mobile-Savvy Consumers
are Driving a Huge Shift in The Retail Banking Industry.
Journal of Advanced Research in Operational and
Marketing Management 2021; 4(1): 17-19.
9.	 Haralayya B. Core Banking Technology and Its Top
6 Implementation Challenges. Journal of Advanced
Research in Operational and Marketing Management
2021; 4(1): 25-27.
10.	 Vibhute NS, Jewargi CB, Haralayya B. Study on Non-
Performing Assets of Public Sector Banks. Iconic
Research and Engineering Journals 2021; 4(12): 52-61.
11.	 Basha, Jeelan and Haralayya, Dr. Bhadrappa,
Performance Analysis of Financial Ratios - Indian Public
Non-Life Insurance Sector 2021.
12.	 Haralayya B. Testing Weak Form Efficiency of Indian
Stock Market - An Empirical Study on NSE. Emerging
Global Strategies for Indian Industry.
13.	 Vinoth S, Vemula HL, Haralayya B et al. Application
of cloud computing in banking and e-commerce and
related security threats, Materials Today: Proceedings,
2021.
14.	 Haralayya B, Aithal PS. Performance Affecting Factors
of Indian Banking Sector: An Empirical Analysis. George
Washington International Law Review; 7(1): 607-621.
15.	 Haralayya B, Aithal PS. Technical Efficiency Affecting
Factors In Indian Banking Sector: An Empirical Analysis.
Turkish Online Journal of Qualitative Inquiry 2021;
12(3): 2021, PAGE No : 603-620.
16.	 Haralayya B, Aithal PS. Implications of Banking Sector
on Economic Development In India. GeorgeWashington
International Law Review 2021; 7(1): 631-642.
17.	 Haralayya B, Aithal PS. Study on Productive Efficiency
of Banks in Developing Country. International Research
Journal of Humanities and Interdisciplinary Studies
2021; 2, Issue: 5, May 2021, Page No : 184-194.
18.	 Haralayya B, Aithal PS. Study on Model and Camel
Analysis of Banking. Iconic Research And Engineering
Journals 2021; 4(11): 244-259.
19.	 Haralayya B, Aithal PS. Analysis of cost efficiency on
scheduled commercial banks in India. International
Journal of Current Research 2021; 13(6): 17718-17725.
20.	 Haralayya B, Aithal PS. A Study on Structure and Growth
of Banking Industry in India. International Journal of
Research in Engineering, Science and Management
2021; 4(5): 225-230.
21.	 HaralayyaB.RetailBankingTrendsinIndia.International
JournalofAllResearchEducationandScientificMethods
2021; 9(5): 3730-3732.
22.	 Haralayya B, Aithal PS. Factors Determining the
44
Vibhute NS et al.
J. Adv. Res. Eco. Busi. Mgmt. 2021; 4(2)
Efficiency in Indian Banking Sector : A Tobit Regression
Analysis. International Journal of Science & Engineering
Development Research 2021; 6(6): 1-6.
23.	 Haralayya B, Aithal PS. Implications of Banking Sector
on Economic Development In India, flusserstudies
2021; 30: Page No:1068-1080.
24.	 Haralayya B, Aithal PS. Study on Productive Efficiency
Of Financial Institutions. International Journal of
Innovative Research in Technology 2021; 8(1): 159-164.
25.	 Haralayya B. Study of Banking Services Provided By
Banks In India. International Research Journal of
Humanities and Interdisciplinary Studies 2021; 2(6): 06-
12.
26.	 Haralayya B, Aithal PS. Analysis of Bank Performance
Using Camel Approach. International Journal of
Emerging Technologies and Innovative Research 2021;
8(5): 305-314.
27.	 Haralayya B, Aithal PS. Analysis of Bank Productivity
using Panel Causality test. Journal of Huazhong
University of Science and Technology 2021; 50(6): 1-16.
28.	 Jeelan BV. Financial Performance Analysis of Post-
Merger and Acquisition. International Journal of
Business and Administration Research Review 2016;
1(1).
29.	 Jeelan BV. Empirical Study on Estimation of Value
using Constant Dividend Growth (Gordon) Model: With
Special Reference to Selected Companies. International
Journal of Management and Social Sciences Research.
30.	 Jeelan BV. Empirical Study on Determinants of Foreign
Exchange Rates with Reference to Indian Rupee v/s
US Dollar. International Journal of Business and
Administration Research Review 2015; 2(10).
31.	 Jeelan BV. An Empirical Study on Relationship between
Future and Spot Price. International Journal of Current
Research 2016; 8(6): 33775-33779.
32.	 Jeelan BV. A Study on Private placement - A Key
to Primary Market. International Multidisciplinary
E-Journal 2015.
33.	 JeelanBV.xaminationofGARCHModelforDeterminants
of Infosys Stock Returns. International Journal of
Current Research 2015; 7(12): 24811-24815.
34.	 Jeelan BV. Impact of Buyback Announcements on
Stock Market in India. Global Journal For Research
Analysis 2015.
35.	 Jeelan BV. An Empirical Study on Analysis of Stock
Brokers in Indian Stock Markets with Special Reference
Cash Market. Indian Journal of Applied Research 2014.
36.	 JeelanBV.PerformanceEvaluationofMutualFundswith
Special Reference to Selected Schemes. International
Journal of Current Research 2015; 7(4): 15316-15318.
37.	 Jeelan BV. Wealth Maximization: An Empirical Analysis
of Bonus Shares and Right Issue. Indian Journal of
Applied Research 2014.
38.	 Jeelan BV. Forecasting Imports of India Using Auto-
regressive Integrated Moving Average. International
Journal of Business and Administration Research Review
2015.
39.	 Jeelan BV. Comparative Study on NPAs (With Special
Reference to Scheduled Commercial Banks, Public
Sector Banks and Foreign Banks in India). Global Journal
for Research Analysis 2016.
40.	 Jeelan BV. Testing for Granger Causality between
BSE Sensex and Forex Reserves: An Empirical Study.
International Journal of Current Research 2015; 7(11)-
23381-23385.
41.	 Jeelan BV. A Study on Type and Method of Issues - A
Corner Stone of Primary Market. International Journal
of Business and Administration Research Review 2015.

More Related Content

Similar to 1411-Article Text-5914-1-10-20220221.pdf

minor project on ratio analysis of "......"
minor project on ratio analysis of "......"minor project on ratio analysis of "......"
minor project on ratio analysis of "......"Kh Corporate
 
Doon business school pnb
Doon business school pnbDoon business school pnb
Doon business school pnbRagneeChauhan
 
Ratios Analysis
Ratios Analysis Ratios Analysis
Ratios Analysis Ojas Narsale
 
A study on effect of liquidity management on profitability with select privat...
A study on effect of liquidity management on profitability with select privat...A study on effect of liquidity management on profitability with select privat...
A study on effect of liquidity management on profitability with select privat...Supriya Mondal
 
A study on financial performance of vijaya bank
A study on financial performance of vijaya bankA study on financial performance of vijaya bank
A study on financial performance of vijaya bankDattu MudhiRaj
 
Financial Performance Analysis of Sonali Bank
Financial Performance Analysis of Sonali BankFinancial Performance Analysis of Sonali Bank
Financial Performance Analysis of Sonali BankMd. Shohel Rana
 
Financial Performance Analysis Of Janata Bank Limited
Financial Performance Analysis Of Janata Bank LimitedFinancial Performance Analysis Of Janata Bank Limited
Financial Performance Analysis Of Janata Bank LimitedHasnan Imtiaz
 
FINANCIAL PERFORMANCE ANALYSIS OF BHARTI AIRTEL LIMITED
FINANCIAL PERFORMANCE ANALYSIS OF BHARTI AIRTEL LIMITEDFINANCIAL PERFORMANCE ANALYSIS OF BHARTI AIRTEL LIMITED
FINANCIAL PERFORMANCE ANALYSIS OF BHARTI AIRTEL LIMITEDyashmin khatun
 
Research paper on NIM
Research paper on NIMResearch paper on NIM
Research paper on NIMKETUL KHANDAGALE
 
Financial Performance Analysis of Conventional and Non – Conventional Banks
Financial Performance Analysis of Conventional and Non – Conventional BanksFinancial Performance Analysis of Conventional and Non – Conventional Banks
Financial Performance Analysis of Conventional and Non – Conventional BanksAN_Rajin
 
Analysis of Internal, Market & Economic Based Financial Performance Measureme...
Analysis of Internal, Market & Economic Based Financial Performance Measureme...Analysis of Internal, Market & Economic Based Financial Performance Measureme...
Analysis of Internal, Market & Economic Based Financial Performance Measureme...IOSRJBM
 
financial statement analysis. trishit
financial statement analysis. trishitfinancial statement analysis. trishit
financial statement analysis. trishitTrishit Dutta
 
DETERMINANTS OF BANK PROFITABILITY: EVIDENCE FROM COMMERCIAL BANKS OF BANGLADESH
DETERMINANTS OF BANK PROFITABILITY: EVIDENCE FROM COMMERCIAL BANKS OF BANGLADESHDETERMINANTS OF BANK PROFITABILITY: EVIDENCE FROM COMMERCIAL BANKS OF BANGLADESH
DETERMINANTS OF BANK PROFITABILITY: EVIDENCE FROM COMMERCIAL BANKS OF BANGLADESHMd. Shohel Rana
 
Market Response with Special Reference to Cash Reserve Ratio: An Event Study ...
Market Response with Special Reference to Cash Reserve Ratio: An Event Study ...Market Response with Special Reference to Cash Reserve Ratio: An Event Study ...
Market Response with Special Reference to Cash Reserve Ratio: An Event Study ...Mohammad Irfan
 
Analysis Of Financial Statements
Analysis Of Financial StatementsAnalysis Of Financial Statements
Analysis Of Financial StatementsTony Lisko
 
Corporate governance and sustainable development in nigeria ( a survey of sel...
Corporate governance and sustainable development in nigeria ( a survey of sel...Corporate governance and sustainable development in nigeria ( a survey of sel...
Corporate governance and sustainable development in nigeria ( a survey of sel...Newman Enyioko
 

Similar to 1411-Article Text-5914-1-10-20220221.pdf (20)

minor project on ratio analysis of "......"
minor project on ratio analysis of "......"minor project on ratio analysis of "......"
minor project on ratio analysis of "......"
 
Doon business school pnb
Doon business school pnbDoon business school pnb
Doon business school pnb
 
Ratios Analysis
Ratios Analysis Ratios Analysis
Ratios Analysis
 
A study on effect of liquidity management on profitability with select privat...
A study on effect of liquidity management on profitability with select privat...A study on effect of liquidity management on profitability with select privat...
A study on effect of liquidity management on profitability with select privat...
 
A study on financial performance of vijaya bank
A study on financial performance of vijaya bankA study on financial performance of vijaya bank
A study on financial performance of vijaya bank
 
Financial Performance Analysis of Sonali Bank
Financial Performance Analysis of Sonali BankFinancial Performance Analysis of Sonali Bank
Financial Performance Analysis of Sonali Bank
 
Financial Performance Analysis Of Janata Bank Limited
Financial Performance Analysis Of Janata Bank LimitedFinancial Performance Analysis Of Janata Bank Limited
Financial Performance Analysis Of Janata Bank Limited
 
FINANCIAL PERFORMANCE ANALYSIS OF BHARTI AIRTEL LIMITED
FINANCIAL PERFORMANCE ANALYSIS OF BHARTI AIRTEL LIMITEDFINANCIAL PERFORMANCE ANALYSIS OF BHARTI AIRTEL LIMITED
FINANCIAL PERFORMANCE ANALYSIS OF BHARTI AIRTEL LIMITED
 
Research paper on NIM
Research paper on NIMResearch paper on NIM
Research paper on NIM
 
Financial Performance Analysis of Conventional and Non – Conventional Banks
Financial Performance Analysis of Conventional and Non – Conventional BanksFinancial Performance Analysis of Conventional and Non – Conventional Banks
Financial Performance Analysis of Conventional and Non – Conventional Banks
 
Project wipro
Project wiproProject wipro
Project wipro
 
Wip
WipWip
Wip
 
Analysis of Internal, Market & Economic Based Financial Performance Measureme...
Analysis of Internal, Market & Economic Based Financial Performance Measureme...Analysis of Internal, Market & Economic Based Financial Performance Measureme...
Analysis of Internal, Market & Economic Based Financial Performance Measureme...
 
financial statement analysis. trishit
financial statement analysis. trishitfinancial statement analysis. trishit
financial statement analysis. trishit
 
DETERMINANTS OF BANK PROFITABILITY: EVIDENCE FROM COMMERCIAL BANKS OF BANGLADESH
DETERMINANTS OF BANK PROFITABILITY: EVIDENCE FROM COMMERCIAL BANKS OF BANGLADESHDETERMINANTS OF BANK PROFITABILITY: EVIDENCE FROM COMMERCIAL BANKS OF BANGLADESH
DETERMINANTS OF BANK PROFITABILITY: EVIDENCE FROM COMMERCIAL BANKS OF BANGLADESH
 
B480812.pdf
B480812.pdfB480812.pdf
B480812.pdf
 
Market Response with Special Reference to Cash Reserve Ratio: An Event Study ...
Market Response with Special Reference to Cash Reserve Ratio: An Event Study ...Market Response with Special Reference to Cash Reserve Ratio: An Event Study ...
Market Response with Special Reference to Cash Reserve Ratio: An Event Study ...
 
Market Response with Special Reference to Cash Reserve Ratio: An Event Study ...
Market Response with Special Reference to Cash Reserve Ratio: An Event Study ...Market Response with Special Reference to Cash Reserve Ratio: An Event Study ...
Market Response with Special Reference to Cash Reserve Ratio: An Event Study ...
 
Analysis Of Financial Statements
Analysis Of Financial StatementsAnalysis Of Financial Statements
Analysis Of Financial Statements
 
Corporate governance and sustainable development in nigeria ( a survey of sel...
Corporate governance and sustainable development in nigeria ( a survey of sel...Corporate governance and sustainable development in nigeria ( a survey of sel...
Corporate governance and sustainable development in nigeria ( a survey of sel...
 

More from DR BHADRAPPA HARALAYYA

Emerging Global Strategies for Indian Industry Bhadrappa Haralayya.pdf
Emerging Global Strategies for Indian Industry Bhadrappa Haralayya.pdfEmerging Global Strategies for Indian Industry Bhadrappa Haralayya.pdf
Emerging Global Strategies for Indian Industry Bhadrappa Haralayya.pdfDR BHADRAPPA HARALAYYA
 
E-Finance and the Financial Services Industry.pdf
E-Finance and the Financial Services Industry.pdfE-Finance and the Financial Services Industry.pdf
E-Finance and the Financial Services Industry.pdfDR BHADRAPPA HARALAYYA
 
TOP 10 WAYS TO IMPROVE THE COMMUNICATION SKILLS.pdf
TOP 10 WAYS TO IMPROVE THE COMMUNICATION SKILLS.pdfTOP 10 WAYS TO IMPROVE THE COMMUNICATION SKILLS.pdf
TOP 10 WAYS TO IMPROVE THE COMMUNICATION SKILLS.pdfDR BHADRAPPA HARALAYYA
 
1703263 PAPER Sales Promotion at Keshva Enterprise Bidar.pdf
1703263 PAPER Sales Promotion at Keshva Enterprise Bidar.pdf1703263 PAPER Sales Promotion at Keshva Enterprise Bidar.pdf
1703263 PAPER Sales Promotion at Keshva Enterprise Bidar.pdfDR BHADRAPPA HARALAYYA
 
ADR 23-30 STUDY ON COST EFFICIENCY IN INDIAN AND OTHER COUNTRIES EXPERIENCE.pdf
ADR 23-30 STUDY ON COST EFFICIENCY IN INDIAN AND OTHER COUNTRIES EXPERIENCE.pdfADR 23-30 STUDY ON COST EFFICIENCY IN INDIAN AND OTHER COUNTRIES EXPERIENCE.pdf
ADR 23-30 STUDY ON COST EFFICIENCY IN INDIAN AND OTHER COUNTRIES EXPERIENCE.pdfDR BHADRAPPA HARALAYYA
 
1703262 PAPER Impact of Ratio Analysis on Financial Performance in Royal Enfi...
1703262 PAPER Impact of Ratio Analysis on Financial Performance in Royal Enfi...1703262 PAPER Impact of Ratio Analysis on Financial Performance in Royal Enfi...
1703262 PAPER Impact of Ratio Analysis on Financial Performance in Royal Enfi...DR BHADRAPPA HARALAYYA
 
1703333 PAPER Comparative Study on Performance Evaluation of Mutual Funds wit...
1703333 PAPER Comparative Study on Performance Evaluation of Mutual Funds wit...1703333 PAPER Comparative Study on Performance Evaluation of Mutual Funds wit...
1703333 PAPER Comparative Study on Performance Evaluation of Mutual Funds wit...DR BHADRAPPA HARALAYYA
 
1703272 PAPER Working Capital Management in Hyundai Showroom Bidar.pdf
1703272 PAPER Working Capital Management in Hyundai Showroom Bidar.pdf1703272 PAPER Working Capital Management in Hyundai Showroom Bidar.pdf
1703272 PAPER Working Capital Management in Hyundai Showroom Bidar.pdfDR BHADRAPPA HARALAYYA
 
1703331 PAPER The Performance of Mutual Fund Schemes in The Framework of Risk...
1703331 PAPER The Performance of Mutual Fund Schemes in The Framework of Risk...1703331 PAPER The Performance of Mutual Fund Schemes in The Framework of Risk...
1703331 PAPER The Performance of Mutual Fund Schemes in The Framework of Risk...DR BHADRAPPA HARALAYYA
 
1703267 PAPER Employee Compensation Management at Vani Organic Pvt Ltd Bidar.pdf
1703267 PAPER Employee Compensation Management at Vani Organic Pvt Ltd Bidar.pdf1703267 PAPER Employee Compensation Management at Vani Organic Pvt Ltd Bidar.pdf
1703267 PAPER Employee Compensation Management at Vani Organic Pvt Ltd Bidar.pdfDR BHADRAPPA HARALAYYA
 
ADR 1-10 STUDY ON PROFITABILITY EFFICIENCY IN INDIAN AND OTHER COUNTRIES EXPE...
ADR 1-10 STUDY ON PROFITABILITY EFFICIENCY IN INDIAN AND OTHER COUNTRIES EXPE...ADR 1-10 STUDY ON PROFITABILITY EFFICIENCY IN INDIAN AND OTHER COUNTRIES EXPE...
ADR 1-10 STUDY ON PROFITABILITY EFFICIENCY IN INDIAN AND OTHER COUNTRIES EXPE...DR BHADRAPPA HARALAYYA
 
AN OVERVIEW ON PRODUCTIVE EFFICIENCY OF BANKS & FINANCIAL INSTITUTION.pdf
AN OVERVIEW ON PRODUCTIVE EFFICIENCY OF BANKS & FINANCIAL INSTITUTION.pdfAN OVERVIEW ON PRODUCTIVE EFFICIENCY OF BANKS & FINANCIAL INSTITUTION.pdf
AN OVERVIEW ON PRODUCTIVE EFFICIENCY OF BANKS & FINANCIAL INSTITUTION.pdfDR BHADRAPPA HARALAYYA
 
1703270 PAPER Study on Promotion Mix Strategy Towards Big Bazaar Bidar.pdf
1703270 PAPER Study on Promotion Mix Strategy Towards Big Bazaar Bidar.pdf1703270 PAPER Study on Promotion Mix Strategy Towards Big Bazaar Bidar.pdf
1703270 PAPER Study on Promotion Mix Strategy Towards Big Bazaar Bidar.pdfDR BHADRAPPA HARALAYYA
 
1703332 PAPER Risk And Return Analysis of Mutual Funds with Reference to Bank...
1703332 PAPER Risk And Return Analysis of Mutual Funds with Reference to Bank...1703332 PAPER Risk And Return Analysis of Mutual Funds with Reference to Bank...
1703332 PAPER Risk And Return Analysis of Mutual Funds with Reference to Bank...DR BHADRAPPA HARALAYYA
 
1703260 PAPER Employees Traning and Development at Mgssk Ltd Bhalki.pdf
1703260 PAPER Employees Traning and Development at Mgssk Ltd Bhalki.pdf1703260 PAPER Employees Traning and Development at Mgssk Ltd Bhalki.pdf
1703260 PAPER Employees Traning and Development at Mgssk Ltd Bhalki.pdfDR BHADRAPPA HARALAYYA
 
1703265 PAPER Comparative Analysis of Mutual Funds in Geojit Financial Servic...
1703265 PAPER Comparative Analysis of Mutual Funds in Geojit Financial Servic...1703265 PAPER Comparative Analysis of Mutual Funds in Geojit Financial Servic...
1703265 PAPER Comparative Analysis of Mutual Funds in Geojit Financial Servic...DR BHADRAPPA HARALAYYA
 
ADR 12-23 2021 STUDY ON THEORTICAL FOUNDATION OF BANK EFFICIENCY.pdf
ADR 12-23  2021 STUDY ON THEORTICAL FOUNDATION OF BANK EFFICIENCY.pdfADR 12-23  2021 STUDY ON THEORTICAL FOUNDATION OF BANK EFFICIENCY.pdf
ADR 12-23 2021 STUDY ON THEORTICAL FOUNDATION OF BANK EFFICIENCY.pdfDR BHADRAPPA HARALAYYA
 
1703264 PAPER The Impact of Safety and Health Measures of Employees at KJD Ph...
1703264 PAPER The Impact of Safety and Health Measures of Employees at KJD Ph...1703264 PAPER The Impact of Safety and Health Measures of Employees at KJD Ph...
1703264 PAPER The Impact of Safety and Health Measures of Employees at KJD Ph...DR BHADRAPPA HARALAYYA
 
1703254 PAPER A Study on Customer Satisfaction at TVS Vanish Motors Bidar.pdf
1703254 PAPER A Study on Customer Satisfaction at TVS Vanish Motors Bidar.pdf1703254 PAPER A Study on Customer Satisfaction at TVS Vanish Motors Bidar.pdf
1703254 PAPER A Study on Customer Satisfaction at TVS Vanish Motors Bidar.pdfDR BHADRAPPA HARALAYYA
 

More from DR BHADRAPPA HARALAYYA (20)

E-PAYMENT AN OVERVIEW.pdf
E-PAYMENT AN OVERVIEW.pdfE-PAYMENT AN OVERVIEW.pdf
E-PAYMENT AN OVERVIEW.pdf
 
Emerging Global Strategies for Indian Industry Bhadrappa Haralayya.pdf
Emerging Global Strategies for Indian Industry Bhadrappa Haralayya.pdfEmerging Global Strategies for Indian Industry Bhadrappa Haralayya.pdf
Emerging Global Strategies for Indian Industry Bhadrappa Haralayya.pdf
 
E-Finance and the Financial Services Industry.pdf
E-Finance and the Financial Services Industry.pdfE-Finance and the Financial Services Industry.pdf
E-Finance and the Financial Services Industry.pdf
 
TOP 10 WAYS TO IMPROVE THE COMMUNICATION SKILLS.pdf
TOP 10 WAYS TO IMPROVE THE COMMUNICATION SKILLS.pdfTOP 10 WAYS TO IMPROVE THE COMMUNICATION SKILLS.pdf
TOP 10 WAYS TO IMPROVE THE COMMUNICATION SKILLS.pdf
 
1703263 PAPER Sales Promotion at Keshva Enterprise Bidar.pdf
1703263 PAPER Sales Promotion at Keshva Enterprise Bidar.pdf1703263 PAPER Sales Promotion at Keshva Enterprise Bidar.pdf
1703263 PAPER Sales Promotion at Keshva Enterprise Bidar.pdf
 
ADR 23-30 STUDY ON COST EFFICIENCY IN INDIAN AND OTHER COUNTRIES EXPERIENCE.pdf
ADR 23-30 STUDY ON COST EFFICIENCY IN INDIAN AND OTHER COUNTRIES EXPERIENCE.pdfADR 23-30 STUDY ON COST EFFICIENCY IN INDIAN AND OTHER COUNTRIES EXPERIENCE.pdf
ADR 23-30 STUDY ON COST EFFICIENCY IN INDIAN AND OTHER COUNTRIES EXPERIENCE.pdf
 
1703262 PAPER Impact of Ratio Analysis on Financial Performance in Royal Enfi...
1703262 PAPER Impact of Ratio Analysis on Financial Performance in Royal Enfi...1703262 PAPER Impact of Ratio Analysis on Financial Performance in Royal Enfi...
1703262 PAPER Impact of Ratio Analysis on Financial Performance in Royal Enfi...
 
1703333 PAPER Comparative Study on Performance Evaluation of Mutual Funds wit...
1703333 PAPER Comparative Study on Performance Evaluation of Mutual Funds wit...1703333 PAPER Comparative Study on Performance Evaluation of Mutual Funds wit...
1703333 PAPER Comparative Study on Performance Evaluation of Mutual Funds wit...
 
1703272 PAPER Working Capital Management in Hyundai Showroom Bidar.pdf
1703272 PAPER Working Capital Management in Hyundai Showroom Bidar.pdf1703272 PAPER Working Capital Management in Hyundai Showroom Bidar.pdf
1703272 PAPER Working Capital Management in Hyundai Showroom Bidar.pdf
 
1703331 PAPER The Performance of Mutual Fund Schemes in The Framework of Risk...
1703331 PAPER The Performance of Mutual Fund Schemes in The Framework of Risk...1703331 PAPER The Performance of Mutual Fund Schemes in The Framework of Risk...
1703331 PAPER The Performance of Mutual Fund Schemes in The Framework of Risk...
 
1703267 PAPER Employee Compensation Management at Vani Organic Pvt Ltd Bidar.pdf
1703267 PAPER Employee Compensation Management at Vani Organic Pvt Ltd Bidar.pdf1703267 PAPER Employee Compensation Management at Vani Organic Pvt Ltd Bidar.pdf
1703267 PAPER Employee Compensation Management at Vani Organic Pvt Ltd Bidar.pdf
 
ADR 1-10 STUDY ON PROFITABILITY EFFICIENCY IN INDIAN AND OTHER COUNTRIES EXPE...
ADR 1-10 STUDY ON PROFITABILITY EFFICIENCY IN INDIAN AND OTHER COUNTRIES EXPE...ADR 1-10 STUDY ON PROFITABILITY EFFICIENCY IN INDIAN AND OTHER COUNTRIES EXPE...
ADR 1-10 STUDY ON PROFITABILITY EFFICIENCY IN INDIAN AND OTHER COUNTRIES EXPE...
 
AN OVERVIEW ON PRODUCTIVE EFFICIENCY OF BANKS & FINANCIAL INSTITUTION.pdf
AN OVERVIEW ON PRODUCTIVE EFFICIENCY OF BANKS & FINANCIAL INSTITUTION.pdfAN OVERVIEW ON PRODUCTIVE EFFICIENCY OF BANKS & FINANCIAL INSTITUTION.pdf
AN OVERVIEW ON PRODUCTIVE EFFICIENCY OF BANKS & FINANCIAL INSTITUTION.pdf
 
1703270 PAPER Study on Promotion Mix Strategy Towards Big Bazaar Bidar.pdf
1703270 PAPER Study on Promotion Mix Strategy Towards Big Bazaar Bidar.pdf1703270 PAPER Study on Promotion Mix Strategy Towards Big Bazaar Bidar.pdf
1703270 PAPER Study on Promotion Mix Strategy Towards Big Bazaar Bidar.pdf
 
1703332 PAPER Risk And Return Analysis of Mutual Funds with Reference to Bank...
1703332 PAPER Risk And Return Analysis of Mutual Funds with Reference to Bank...1703332 PAPER Risk And Return Analysis of Mutual Funds with Reference to Bank...
1703332 PAPER Risk And Return Analysis of Mutual Funds with Reference to Bank...
 
1703260 PAPER Employees Traning and Development at Mgssk Ltd Bhalki.pdf
1703260 PAPER Employees Traning and Development at Mgssk Ltd Bhalki.pdf1703260 PAPER Employees Traning and Development at Mgssk Ltd Bhalki.pdf
1703260 PAPER Employees Traning and Development at Mgssk Ltd Bhalki.pdf
 
1703265 PAPER Comparative Analysis of Mutual Funds in Geojit Financial Servic...
1703265 PAPER Comparative Analysis of Mutual Funds in Geojit Financial Servic...1703265 PAPER Comparative Analysis of Mutual Funds in Geojit Financial Servic...
1703265 PAPER Comparative Analysis of Mutual Funds in Geojit Financial Servic...
 
ADR 12-23 2021 STUDY ON THEORTICAL FOUNDATION OF BANK EFFICIENCY.pdf
ADR 12-23  2021 STUDY ON THEORTICAL FOUNDATION OF BANK EFFICIENCY.pdfADR 12-23  2021 STUDY ON THEORTICAL FOUNDATION OF BANK EFFICIENCY.pdf
ADR 12-23 2021 STUDY ON THEORTICAL FOUNDATION OF BANK EFFICIENCY.pdf
 
1703264 PAPER The Impact of Safety and Health Measures of Employees at KJD Ph...
1703264 PAPER The Impact of Safety and Health Measures of Employees at KJD Ph...1703264 PAPER The Impact of Safety and Health Measures of Employees at KJD Ph...
1703264 PAPER The Impact of Safety and Health Measures of Employees at KJD Ph...
 
1703254 PAPER A Study on Customer Satisfaction at TVS Vanish Motors Bidar.pdf
1703254 PAPER A Study on Customer Satisfaction at TVS Vanish Motors Bidar.pdf1703254 PAPER A Study on Customer Satisfaction at TVS Vanish Motors Bidar.pdf
1703254 PAPER A Study on Customer Satisfaction at TVS Vanish Motors Bidar.pdf
 

Recently uploaded

TEST BANK For Corporate Finance, 13th Edition By Stephen Ross, Randolph Weste...
TEST BANK For Corporate Finance, 13th Edition By Stephen Ross, Randolph Weste...TEST BANK For Corporate Finance, 13th Edition By Stephen Ross, Randolph Weste...
TEST BANK For Corporate Finance, 13th Edition By Stephen Ross, Randolph Weste...ssifa0344
 
02_Fabio Colombo_Accenture_MeetupDora&Cybersecurity.pptx
02_Fabio Colombo_Accenture_MeetupDora&Cybersecurity.pptx02_Fabio Colombo_Accenture_MeetupDora&Cybersecurity.pptx
02_Fabio Colombo_Accenture_MeetupDora&Cybersecurity.pptxFinTech Belgium
 
The Economic History of the U.S. Lecture 19.pdf
The Economic History of the U.S. Lecture 19.pdfThe Economic History of the U.S. Lecture 19.pdf
The Economic History of the U.S. Lecture 19.pdfGale Pooley
 
20240429 Calibre April 2024 Investor Presentation.pdf
20240429 Calibre April 2024 Investor Presentation.pdf20240429 Calibre April 2024 Investor Presentation.pdf
20240429 Calibre April 2024 Investor Presentation.pdfAdnet Communications
 
20240417-Calibre-April-2024-Investor-Presentation.pdf
20240417-Calibre-April-2024-Investor-Presentation.pdf20240417-Calibre-April-2024-Investor-Presentation.pdf
20240417-Calibre-April-2024-Investor-Presentation.pdfAdnet Communications
 
Q3 2024 Earnings Conference Call and Webcast Slides
Q3 2024 Earnings Conference Call and Webcast SlidesQ3 2024 Earnings Conference Call and Webcast Slides
Q3 2024 Earnings Conference Call and Webcast SlidesMarketing847413
 
High Class Call Girls Nagpur Grishma Call 7001035870 Meet With Nagpur Escorts
High Class Call Girls Nagpur Grishma Call 7001035870 Meet With Nagpur EscortsHigh Class Call Girls Nagpur Grishma Call 7001035870 Meet With Nagpur Escorts
High Class Call Girls Nagpur Grishma Call 7001035870 Meet With Nagpur Escortsranjana rawat
 
Independent Lucknow Call Girls 8923113531WhatsApp Lucknow Call Girls make you...
Independent Lucknow Call Girls 8923113531WhatsApp Lucknow Call Girls make you...Independent Lucknow Call Girls 8923113531WhatsApp Lucknow Call Girls make you...
Independent Lucknow Call Girls 8923113531WhatsApp Lucknow Call Girls make you...makika9823
 
The Economic History of the U.S. Lecture 17.pdf
The Economic History of the U.S. Lecture 17.pdfThe Economic History of the U.S. Lecture 17.pdf
The Economic History of the U.S. Lecture 17.pdfGale Pooley
 
The Economic History of the U.S. Lecture 20.pdf
The Economic History of the U.S. Lecture 20.pdfThe Economic History of the U.S. Lecture 20.pdf
The Economic History of the U.S. Lecture 20.pdfGale Pooley
 
OAT_RI_Ep19 WeighingTheRisks_Apr24_TheYellowMetal.pptx
OAT_RI_Ep19 WeighingTheRisks_Apr24_TheYellowMetal.pptxOAT_RI_Ep19 WeighingTheRisks_Apr24_TheYellowMetal.pptx
OAT_RI_Ep19 WeighingTheRisks_Apr24_TheYellowMetal.pptxhiddenlevers
 
Call US đź“ž 9892124323 âś… Kurla Call Girls In Kurla ( Mumbai ) secure service
Call US đź“ž 9892124323 âś… Kurla Call Girls In Kurla ( Mumbai ) secure serviceCall US đź“ž 9892124323 âś… Kurla Call Girls In Kurla ( Mumbai ) secure service
Call US đź“ž 9892124323 âś… Kurla Call Girls In Kurla ( Mumbai ) secure servicePooja Nehwal
 
03_Emmanuel Ndiaye_Degroof Petercam.pptx
03_Emmanuel Ndiaye_Degroof Petercam.pptx03_Emmanuel Ndiaye_Degroof Petercam.pptx
03_Emmanuel Ndiaye_Degroof Petercam.pptxFinTech Belgium
 
00_Main ppt_MeetupDORA&CyberSecurity.pptx
00_Main ppt_MeetupDORA&CyberSecurity.pptx00_Main ppt_MeetupDORA&CyberSecurity.pptx
00_Main ppt_MeetupDORA&CyberSecurity.pptxFinTech Belgium
 
Dividend Policy and Dividend Decision Theories.pptx
Dividend Policy and Dividend Decision Theories.pptxDividend Policy and Dividend Decision Theories.pptx
Dividend Policy and Dividend Decision Theories.pptxanshikagoel52
 
Dharavi Russian callg Girls, { 09892124323 } || Call Girl In Mumbai ...
Dharavi Russian callg Girls, { 09892124323 } || Call Girl In Mumbai ...Dharavi Russian callg Girls, { 09892124323 } || Call Girl In Mumbai ...
Dharavi Russian callg Girls, { 09892124323 } || Call Girl In Mumbai ...Pooja Nehwal
 
Log your LOA pain with Pension Lab's brilliant campaign
Log your LOA pain with Pension Lab's brilliant campaignLog your LOA pain with Pension Lab's brilliant campaign
Log your LOA pain with Pension Lab's brilliant campaignHenry Tapper
 
The Economic History of the U.S. Lecture 18.pdf
The Economic History of the U.S. Lecture 18.pdfThe Economic History of the U.S. Lecture 18.pdf
The Economic History of the U.S. Lecture 18.pdfGale Pooley
 
Instant Issue Debit Cards - School Designs
Instant Issue Debit Cards - School DesignsInstant Issue Debit Cards - School Designs
Instant Issue Debit Cards - School Designsegoetzinger
 
Malad Call Girl in Services 9892124323 | â‚ą,4500 With Room Free Delivery
Malad Call Girl in Services  9892124323 | â‚ą,4500 With Room Free DeliveryMalad Call Girl in Services  9892124323 | â‚ą,4500 With Room Free Delivery
Malad Call Girl in Services 9892124323 | â‚ą,4500 With Room Free DeliveryPooja Nehwal
 

Recently uploaded (20)

TEST BANK For Corporate Finance, 13th Edition By Stephen Ross, Randolph Weste...
TEST BANK For Corporate Finance, 13th Edition By Stephen Ross, Randolph Weste...TEST BANK For Corporate Finance, 13th Edition By Stephen Ross, Randolph Weste...
TEST BANK For Corporate Finance, 13th Edition By Stephen Ross, Randolph Weste...
 
02_Fabio Colombo_Accenture_MeetupDora&Cybersecurity.pptx
02_Fabio Colombo_Accenture_MeetupDora&Cybersecurity.pptx02_Fabio Colombo_Accenture_MeetupDora&Cybersecurity.pptx
02_Fabio Colombo_Accenture_MeetupDora&Cybersecurity.pptx
 
The Economic History of the U.S. Lecture 19.pdf
The Economic History of the U.S. Lecture 19.pdfThe Economic History of the U.S. Lecture 19.pdf
The Economic History of the U.S. Lecture 19.pdf
 
20240429 Calibre April 2024 Investor Presentation.pdf
20240429 Calibre April 2024 Investor Presentation.pdf20240429 Calibre April 2024 Investor Presentation.pdf
20240429 Calibre April 2024 Investor Presentation.pdf
 
20240417-Calibre-April-2024-Investor-Presentation.pdf
20240417-Calibre-April-2024-Investor-Presentation.pdf20240417-Calibre-April-2024-Investor-Presentation.pdf
20240417-Calibre-April-2024-Investor-Presentation.pdf
 
Q3 2024 Earnings Conference Call and Webcast Slides
Q3 2024 Earnings Conference Call and Webcast SlidesQ3 2024 Earnings Conference Call and Webcast Slides
Q3 2024 Earnings Conference Call and Webcast Slides
 
High Class Call Girls Nagpur Grishma Call 7001035870 Meet With Nagpur Escorts
High Class Call Girls Nagpur Grishma Call 7001035870 Meet With Nagpur EscortsHigh Class Call Girls Nagpur Grishma Call 7001035870 Meet With Nagpur Escorts
High Class Call Girls Nagpur Grishma Call 7001035870 Meet With Nagpur Escorts
 
Independent Lucknow Call Girls 8923113531WhatsApp Lucknow Call Girls make you...
Independent Lucknow Call Girls 8923113531WhatsApp Lucknow Call Girls make you...Independent Lucknow Call Girls 8923113531WhatsApp Lucknow Call Girls make you...
Independent Lucknow Call Girls 8923113531WhatsApp Lucknow Call Girls make you...
 
The Economic History of the U.S. Lecture 17.pdf
The Economic History of the U.S. Lecture 17.pdfThe Economic History of the U.S. Lecture 17.pdf
The Economic History of the U.S. Lecture 17.pdf
 
The Economic History of the U.S. Lecture 20.pdf
The Economic History of the U.S. Lecture 20.pdfThe Economic History of the U.S. Lecture 20.pdf
The Economic History of the U.S. Lecture 20.pdf
 
OAT_RI_Ep19 WeighingTheRisks_Apr24_TheYellowMetal.pptx
OAT_RI_Ep19 WeighingTheRisks_Apr24_TheYellowMetal.pptxOAT_RI_Ep19 WeighingTheRisks_Apr24_TheYellowMetal.pptx
OAT_RI_Ep19 WeighingTheRisks_Apr24_TheYellowMetal.pptx
 
Call US đź“ž 9892124323 âś… Kurla Call Girls In Kurla ( Mumbai ) secure service
Call US đź“ž 9892124323 âś… Kurla Call Girls In Kurla ( Mumbai ) secure serviceCall US đź“ž 9892124323 âś… Kurla Call Girls In Kurla ( Mumbai ) secure service
Call US đź“ž 9892124323 âś… Kurla Call Girls In Kurla ( Mumbai ) secure service
 
03_Emmanuel Ndiaye_Degroof Petercam.pptx
03_Emmanuel Ndiaye_Degroof Petercam.pptx03_Emmanuel Ndiaye_Degroof Petercam.pptx
03_Emmanuel Ndiaye_Degroof Petercam.pptx
 
00_Main ppt_MeetupDORA&CyberSecurity.pptx
00_Main ppt_MeetupDORA&CyberSecurity.pptx00_Main ppt_MeetupDORA&CyberSecurity.pptx
00_Main ppt_MeetupDORA&CyberSecurity.pptx
 
Dividend Policy and Dividend Decision Theories.pptx
Dividend Policy and Dividend Decision Theories.pptxDividend Policy and Dividend Decision Theories.pptx
Dividend Policy and Dividend Decision Theories.pptx
 
Dharavi Russian callg Girls, { 09892124323 } || Call Girl In Mumbai ...
Dharavi Russian callg Girls, { 09892124323 } || Call Girl In Mumbai ...Dharavi Russian callg Girls, { 09892124323 } || Call Girl In Mumbai ...
Dharavi Russian callg Girls, { 09892124323 } || Call Girl In Mumbai ...
 
Log your LOA pain with Pension Lab's brilliant campaign
Log your LOA pain with Pension Lab's brilliant campaignLog your LOA pain with Pension Lab's brilliant campaign
Log your LOA pain with Pension Lab's brilliant campaign
 
The Economic History of the U.S. Lecture 18.pdf
The Economic History of the U.S. Lecture 18.pdfThe Economic History of the U.S. Lecture 18.pdf
The Economic History of the U.S. Lecture 18.pdf
 
Instant Issue Debit Cards - School Designs
Instant Issue Debit Cards - School DesignsInstant Issue Debit Cards - School Designs
Instant Issue Debit Cards - School Designs
 
Malad Call Girl in Services 9892124323 | â‚ą,4500 With Room Free Delivery
Malad Call Girl in Services  9892124323 | â‚ą,4500 With Room Free DeliveryMalad Call Girl in Services  9892124323 | â‚ą,4500 With Room Free Delivery
Malad Call Girl in Services 9892124323 | â‚ą,4500 With Room Free Delivery
 

1411-Article Text-5914-1-10-20220221.pdf

  • 1. Research Article Journal of Advanced Research in Economics and Business Management Copyright (c) 2021: Author(s). Published by: Advanced Research Publications Journal of Advanced Research in Economics and Business Management Volume 4, Issue 2 - 2021, Pg. No. 36-44 Peer Reviewed Journal I N F O A B S T R A C T Corresponding Author: Nitesh S Vibhute, Faculty of Business Studies MBA, Sharnbasva University Kalaburagi, India. E-mail Id: niteshsv21@gmail.com How to cite this article: Vibhute NS, Haralayya B, Jeelan BV. Performance Evaluation of Selected Banks using Ratio Analysis. J Adv Res Eco Busi Mgmt 2021; 4(2): 36-44. Date of Submission: 2021-11-25 Date of Acceptance: 2021-12-03 Performance Evaluation of Selected Banks using Ratio Analysis Nitesh S Vibhute1 , Bhadrappa Haralayya2 , Jeelan Basha V3 1 Assistant Professor, Faculty of Business Studies MBA, Sharnbasva University Kalaburagi, India. 2 HOD and Associate Professor, Department of MBA, Lingaraj Appa Engineering College Bidar, India. 3 Dean and Professor of Commerce, Vijayanagara Sri Krishnadevaraya University, Bellary, India. Ratio analysis a accounting tool, which can be used to measure the solvency, the probability and the over all financial strength of a business, by analyzing its financial accounts (specifically the balance sheet and profit and loss account). It is a quantitative method of gaining insight into company’s liquidity,operational efficiency and profitability by comparing information contained in its financial statements. Ratio analysis can be used to establish a trend line for one company’s results over a large number of financial reporting periods. This can highlight company changes that would not be evident if looking at a given ratio that represents just one point in time. Keywords: Financial ratios, Operating revenue, Smart bank, Eagles model, Investment project Introduction Banks are life blood & the nervous system of the Indian economy. Banking plays an important role in the economic development of a country & forms the core of money market in an advanced country. In India, the money market is characterized by the existence of both the organized & unorganized sectors. The organized sector includes commercial bank, co-operative banks & regional Rural banks while the unorganized sectors includes indigenous bankers and private money lenders. Among the banking institutions in the organized sector , the commercial banks are the oldest institutions having a wide network of branches, commanding utmost public confidence and having the lion’s share in the total banking operations. Initially, they were established as corporate bodies with share-holding by private individuals, but subsequently there has been a drift towards state ownership and control. In modern times banking is the kingpin of all business activity. It is an important instrument of mobilizing the community’s resources through institutional framework. As a matter of fact, economic & industrial development of a country depends, is the main, upon how efficiently funds are managed by the banks. Hence, banking plays an important in the economic development of the country. Adequacy of capital and competency of management are the two pillars upon which the earnings of the banks depend. Sufficiency of capital instills depositor’s confidence, which helps in mobilizing of deposits. Increase in deposits increases the leading business & therefore enhances the possibilities of income generation for the bank. Moreover, a bank with a sound capital base can take business opportunity more effectively and can concentrate well on dealing with problem arising from unexpected loses. The success & survival of a bank depends to a great extent upon the dedication & competence of its managers. A smart bank manager can, not only help to mobilize resources and deploy them in profitable channels, the manager can also reduce the amount of idle balances and help to more profits. The banks now focus on integrated balance sheet management where all the relevant factors which effect an appropriate balancesheetcompositiondeserveconsideration.Therefore various components of balance sheet are analyzed keeping in view the strengths of a bank. Analyzing assets & liability behaviour means managing both assets and liabilities simultaneously for the purpose of minimizing the adverse
  • 2. 37 Vibhute NS et al. J. Adv. Res. Eco. Busi. Mgmt. 2021; 4(2) impact of interest rate movement, providing liquidity & enhancing the market value of equity. Statement of the Problem Financial ratios are used almost universally by companies of allsizestoprovidenumericalinformationontheprofitability, health & direction of the business. Financial ratios provide useful analysis & can help drivemanagement toward making better decisions if they are interpreted correctly. However, there are some drawbacks to relying on these metrics. Analysis and interpretation of financial statement is a regular exercise to review the performance of the company. It was proposed to conduct a review to study the short term prospects as well as the long term trends & to arrive at the conclusion on the performance of the company. Performance review resulting in taking corrective action optimizes the performance in the subsequent period. Aftergoingthroughexistingliteratureofthelibraryreviewing various articles from everywhere and knowledgeable discussion with the concerned respected guide & by following the existing circumstances, the researcher has selected this topic, after considering available information, data, existing literate, external sources of information & other inclusive source. Researcher has framed following problem for this work. Need for the Study Ratio analysis is a quantitative method of gaining insight into a company’s liquidity, operational efficiency and profitability by comparing information contained in its financial statements. Effective planning & financial management are the keys to running a financially successful small business. Ratio analysis is critical for helping you understand financial statements, for identifying trends over time and for measuring the overall financial state of your business. In addition, lenders & potential investors often rely on ratio analysis when making lending and investing decisions. Significance of the Study This study for the financial performance in major aspects as under: 1. It helpful in simplifying financial data. 2. It helpful in analysis of financial strength. 3. It helpful in decision-making. 4. It help financial forecasting. 5. It help in financial planning. Scope of the study The scope of the study is limited to collecting financial data published in the annual reports of the company every year. The analysis is done to suggest the possible solutions. The study is carried out 5 years (2015-2019). It is analyze and interpret the relevant data of the company in a balanced way ratio analysis. The analysis is done to suggest the possible solutions. Objectives of the Study • To evaluate the performance of sample banks using liquidity or short-term solvency, long-term solvency • To assess the operating efficiency of the business • To help in comparative analysis, inter-firm and intra- firm comparisions Research Methodology The main aim of the study is to know the financial performance of the banks. Research Any efforts which are directed to study of strategy needed to identify the problems and selection of best solutions for better results are known as research. Research Design Inviewoftheobjectsofthestudylistedaboveanexploratory research design has been adopted. Exploratory research is one which largely interprets & already available information and it lays particular emphasis on analysis and interpretation of the existing and available information. • To know the financial status of the company • To know the credit worthiness of the company • To offer suggestion based on research finding Research Methodology Eagles model is basically ratio-based model for evaluating the performance of banks. It is a management tool that measures earnings, asset quality, growth, liquidity, equity and strategy. The present study adopts analytical and descriptive design. The data of the sample banks from 2011 to 2019 has been collected from annual reports published by banks. Thirteen variables related to Eagles model are used in the study. For analyzing and interpreting the results, the statistical tools used are arithmetic mean, standard deviation, coefficient of variation, growth rate and t-test. The t-test is used to test the hypotheses. It determines the significant difference between the average value of selected public and private sector banks. The SPSS 19 software is used for data analysis. The present study is based on secondary data that has been collected from the annual reports and websites of the respective banks, magazines, journals, documents and other published information. The total assets of the selected banks for 2015 are presented in Eagles’ model has been adopted for analyzing and comparing the banks. The following Eagles’ parameters are considered for the study: Earnings (ROA, RONW and IOR), Asset Quality (gross NPA, net NPA and provision coverage ratio), Growth (loans and deposits),
  • 3. 38 Vibhute NS et al. J. Adv. Res. Eco. Busi. Mgmt. 2021; 4(2) Liquidity (loan-to-deposit and investment-to-deposit ratio), Equity (capital adequacy) and Strategy (interest income to interest cost and non-interest income to non-interest cost). Ratio Meaning Ratio is also a relationship between two groups or amounts that expresses how much bigger one is than the other. In other words ratio is the relationship between two amounts, represented by two numbers or a percentage, expressing how much bigger one is the other. Ex:- 2:6, 8:4 etc. Definition In mathematics, a ratio is a comparison of two or more numbers that indicates their sizes in relation to each other. A ratio compares two values. It shows you that when you have this much of something, you will need to have that much of something else. Ratio Analysis Ratio analysis is the process of determining and interpreting numerical relationship based on financial statements. In other words, ratio analysis is the technique of inter- pretation of financial statements with the help of accounting ratios derived from the balancesheet and profit & loss account. Types of Ratio Analysis Basic EPS Earning Per Share (EPS), also called net income per share, is a market prospect ratio that measure the amount of net income earned per share of stock outstanding. In other words, this is the amount of money each share of stock would receive if all of the profits were distributed to the outstanding shares at the end of the year. EPS or basic earnings per share is calculated by subtracting preferred dividends from net income & dividing by the weight average common shares outstanding. The earnings per share formula looks like this. EPS = Net income preferred dividends/ Weighted average common shares outstanding. Book Value (Excl.Reval reserve)/ Share Book value of equity per share (BVPS) is the equity available to common shareholders divided by the number of outstandings shares. This represents the minimum value of a company’s equity. BVPS metric can be used by investors to gauge whether a stock price is undervalued, by comparing it to the firm’s market value per share. BVPS = Total equity preferred equity/ Total shares out- standings. Book Value (Incl.reval Reserve)/ Share Revaluation reserve is an accounting term used when a company creates a line item on its balance sheet for the purpose of maintaining a reserve account tied to certain assets. This line item can be used when a revaluation assessment finds that the carrying value of the asset has changed. Operating Revenue/ Share Operating revenue is revenue generated from a company’s primary business activities. Distinguishing operating revenue from total revenue is important as it provides valuable information about the productivity & profitability of a company’s primary business operations. Net Profit Share The net profit ratio includes the total revenue of the firm. It takes into account both the operating incomes as well as non-operating income. Then it compares net profits to these incomes. This ratio too represented as a percentage. The formula for net profit ratio is. This ratio helps measure the overall profitability of the firm. It indicates the portion of the net revenue that is available to the proprietors. It also reflects on the efficiency of the business is a very important ratio for investors & financiers. Net profit ratio = Net profit/Net revenue*100 (or) = Net profit after tax/Net sales Net Profit Margin The net profit margin is equal to how much net income or profit is generated as a percentage of revenue. Net profit margin is the ratio of net profits to revenues for a company or business segment. It is typically expressed as percentages but can also be represented in decimal form. The net profit margin illustrates how much of each dollar in revenue collected by a company translates into netprofit. NPM = R - COGS - E - I - T/ R*100 Where: R = Revenue COGS = The cost of goods sold E = Operating & other expenses I = Interest T = Taxes Net Income per Employee Ratio It is a company’s net income divided by no of employees. This number shows the company how efficient it is with its employees. Theoretically, the higher the net income per employee the better. Aside from increasing the productivity of employ’s, this number could be increased by a number of other factors.
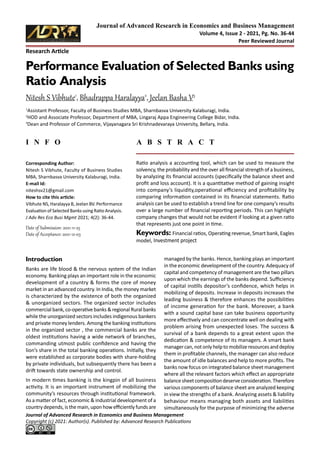
  • 4. 39 Vibhute NS et al. J. Adv. Res. Eco. Busi. Mgmt. 2021; 4(2) Interest Income Ratio It is the amount paid to an entity for lending its money or letting another entity use in funds. On a large scale, interest income is the amount earned by an investor’s money that he places in an investment project. A very simple & basic way of computing it is by multiplying the principal amount by the interest rate applied, considering the number of months or years the money lent. Interest income is usually taxable income & is presented in the income statement for the simple reason that it is an income account. Total Assets Ratio Total debt to total assets is a leverage ratio that defines the total amount of debt relative to assets. This metric enablescomparisonsofleveragetobemadeacrossdifferent companies. In other words total debt to assets is a measure of the company’s assets that are financed by debt, rather than equity. TD/ TA = Short-term debt + Long-term debt / Total assets. Interest Expense Ratio Interest expense is the cost of money or recorded on the income statement. In other words interest expense is the cost incurred by an entity for borrowed funds. It is a non-operating expense shown on the income statement. It represents interest payable on any borrowings-bonds, loans, convertible debt or lines of credit. Data Analysis and Interpretation Earnings per Share The below graph and table 1 interpreates that the basic EPS among five responded out of which HDFC bank EPS level very high then compare to the next four despondence where has the data collected & mentioned below state that the five years EPS level of HDFC (58.916) is high and later SBI(7.452) returns EPS level is second highest & the next EPS level of Axis bank (20.1) and rest to respondance that is Canara and Andhra bank have a negative rate in their EPS levels that is Canara bank -8.03 and Andhra bank 8.36 respectively and even it has been clearly explained with the help of graph mentioned below. The above table (Table 2) interpreates that the book value among the five respondance the Canara bank has the highest returns from the last 5 years is 461.34 with the risk level of 67.88% and the HDFC bank has an returns of 368.29 with the risk level of 117.76% later the Axis bank gives up to returns of 230.178 & with the risk level of 27.07% and next to respondance SBI has returns of 230.928 with the risk level of 29.53%. And the last respondance that is Andhra bank which has the least returns that is 126.22 with the risk level of 55.53%. From the above information I can suggest that Axis bank has on highest growth rate when compare to the next four respondance with growth rate of 0.082%. Hence we can conclude that the book value are Axis bank is highest/ the gives the best returns and better book value per share. Year   Basic EPS (Rs.)         SBI HDFC AXIS Canara Andhra Mar-15 17.55 42.15 31.18 58.59 10.82 Mar-16 12.98 48.84 34.59 -53.61 8.6 Mar-17 13.43 57.18 15.4 20.63 2.56 Mar-18 -7.67 67.76 1.13 -70.47 -42.12 Mar-19 0.97 78.65 18.2 4.71 -21.66 Returns 7.452 58.916 20.1 -8.03 -8.36 Risk 10.47563936 14.60552395 13.40044216 53.38121767 22.8658479 Consistency 1.405748706 0.247904202 0.666688665 -6.647723247 -2.73514927 Growth -0.515131854 0.168759858 -0.125924758 -0.467524841 #NUM! Table 1 Figure 1
  • 5. 40 Vibhute NS et al. J. Adv. Res. Eco. Busi. Mgmt. 2021; 4(2) Year Book Value (Excl. Reval Reserve) (Rs.) SBI HDFC AXIS Canara Andhra Mar-15 172.04 247.39 188.47 556.68 166.94 Mar-16 185.85 287.47 223.12 484.75 161.41 Mar-17 196.53 349.12 232.83 474.01 166.87 Mar-18 217.69 409.6 247.2 396.59 90.24 Mar-19 247.53 547.89 259.27 394.68 45.64 Returns 203.928 368.294 230.178 461.342 126.22 Risk 29.53352366 117.7697407 27.07627504 67.88665311 55.53506505 Consistency 0.144823289 0.319771 0.117631898 0.147150385 0.439986255 Growth 0.095215552 0.219910048 0.082997638 -0.082386329 -0.276903421 Table 2 Figure 3 The above graph and table interpreates that the operating revenue of Canara bank is highest out of five respondance in which the average returns of Canara bank is with 721.67% and for the remaining respondance where the returns of HDFC 274.93, SBI with returns of 230.944 andhra bank with returns of 202.16. From this analysis I can interpreate that Canara bank has given an highest them compare to the rest four respondance and Axis bank has the lowest returns with less operating revenue. Year Operating Revenue(Rs.) SBI HDFC AXIS CANARA ANDHRA Mar-15 204.13 193.38 149.67 920.67 271.52 Mar-16 211.26 238.2 172.02 810.73 258.89 Mar-17 220.13 270.46 185.98 692.92 264.66 Mar-18 247.07 309.2 178.37 562.6 149.93 Mar-19 272.13 363.43 213.82 621.45 65.63 Returns 230.944 274.934 179.972 721.674 202.126 Risk 28.19453635 65.24216259 23.26905176 144.6604294 91.24658969 Consistency 0.122083866 0.23730118 0.129292622 0.200451214 0.451434203 Growth 0.074527158 0.170852815 0.093272418 -0.093588201 -0.298827064 Table 3 Figure 2
  • 6. 41 Vibhute NS et al. J. Adv. Res. Eco. Busi. Mgmt. 2021; 4(2) The above graph and table interpreates that the net profit among five responded out of which HDFC bank is net profit level is very high than compare to the next four respondance where has mentioned the above the state that the five years net profit level of returns 58.192 of HDFC is high and later Axis bank level of returns 20.034 is second highest of net profit and next SBI level of returns 7.43 andhra bank level of returns -3.41 and lastly Canara bank level of returns -5.824 respectvely and even has been clearly explained with the help of graph mentioned above. I can suggest that the HDFC is gives the highest and best returns than compare to the respondance to the net profit. The above graph and table interpreates that the net profit margin among five respondance out of which the HDFC bank is highest out of five respondance and the returns 21.11% and remaining respondance where the returns of SBI bank 3.602%, Axis bank with the returns of 11.63%, Canara bank with the returns of -1.506% and lastly Andhra bank returns of -5.154%. Finally I can suggest that HDFC bank is gives the highest return than compare to another respondance. So we can conclude that HDFC bank is gives the best return to the net profit margin. The above graph and below table 6 interpreates that the interest income among five respondance with the returns of SBI 6.768%, HDFC with the returns of 8.04%, Axis bank with the level of return 7.272%, Canara bank with the returns of 7.288% and finally Andhra bank with the returns of 8.052%. Year Net Profit Margin (%) SBI HDFC AXIS Canara Andhra Mar-15 8.59 21.07 20.73 6.17 3.90 Mar-16 6.06 20.41 20.06 -6.38 3.06 Mar-17 5.97 20.99 8.26 2.17 0.96 Mar-18 -2.96 21.79 0.60 -10.23 -18.98 Mar-19 0.35 21.29 8.50 0.74 -14.71 Returns 3.602 21.11 11.63 -1.506 -5.154 Risk 4.747754206 0.50019996 8.612339984 6.658500582 10.83167946 Consistency 1.318088341 0.023694929 0.740527944 -4.421315127 -2.101606415 Growth -0.55071831 0.002600187 -0.199788284 -0.411513318 #NUM! Year Net Profit (Rs.) SBI HDFC AXIS Canara Andhra Mar-15 17.55 40.76 31.04 56.87 10.59 Mar-16 12.82 48.64 34.51 -51.8 7.93 Mar-17 13.15 56.78 15.36 18.78 2.56 Mar-18 -7.34 67.38 1.07 -57.58 -28.47 Mar-19 0.97 77.4 18.19 4.61 -9.66 Returns 7.43 58.192 20.034 -5.824 -3.41 Risk 10.2964727 14.58145809 13.37503757 48.57272619 16.02578079 Consistency 1.385797133 0.25057496 0.66761693 -8.340097218 -4.699642461 Growth -0.515131854 0.17388809 -0.125061058 -0.466414002 #NUM! Table 4 Figure 4 Table 5
  • 7. 42 Vibhute NS et al. J. Adv. Res. Eco. Busi. Mgmt. 2021; 4(2) Figure 5 The lowest level of returns recorded in CANARA bank. • The growth rate of book value recorded in ANDHRA bank,CANARAbank,AXISbank,HDFCbankandSBIbank as -0.276, -8.082, 0.082, 0.219 & 0.095 respectively. The highest level of growth rate recorded as AXIS bank and lowest is HDFC bank. • Among five years out of five respondance the level of returns operating revenue as recorded in SBI bank, HDFC bank, AXIS bank, CANARA bank and ANDHRA bank as 230.944, 274.934, 179.972, 721.674 & 202.126 respectively. The highest level of returns recorded as CANARA bank and lowest is AXIS bank. • The total level of returns for net profit as recorded in SBI, HDFC, AXIS, CANARA & ANDHRA banks as Rs.7.43, 58.192, 20.034, -5.824 and -3.41 respectively. The lowest level of returns is recorded ANDHRA bank & highest is recorded as HDFC bank. • The study found that in the year Mar 2015-19, the returns of net profit margin of HDFC bank (21.11%) is the highest among all the selected banks followed by SBI, AXIS andHRA bank and CANARA bank (-1.506%) has the lowest returns of net profit margin. • The study found that in the year Mar 2015-19 andHRA bank (8.052%) has performed well and has the highest levelofreturnsofinterestincomeandSBIbank(6.768%) have lowest returns among all the selected banks. Suggestions • The banks should improve their capital base by issuing more share to the public or through government contribution. • The banks should bring new product/services based on the aspirations of customers. • The bank should motivate and impart right knowledge about banking to their staff. • Thebanksshouldbeimprovethefinancialperformance. Figure 6 Year Interesy Income (%) SBI HDFC AXIS Canara Andhra Mar-15 7.44 8.20 7.68 7.98 8.33 Mar-16 6.95 8.49 7.80 7.96 8.81 Mar-17 6.48 8.02 7.40 7.09 8.11 Mar-18 6.38 7.54 6.62 6.68 7.42 Mar-19 6.59 7.95 6.86 6.73 7.59 Returns 6.768 8.04 7.272 7.288 8.052 Risk 0.432978059 0.348783601 0.513926065 0.64239396 0.563045291 Consistency 0.0639743 0.043381045 0.070671901 0.088144067 0.069926141 Growth -0.029874054 -0.007710675 -0.027833338 -0.041696569 -0.022989584 Table 6 Finally I can suggest that Andhra bank is highest returns than compare the respondance the SBI, HDFC, AXIS & CANARA bank with the returns 8.052%. We can conclude that Andhra bank is highest and gives the best return to the interest income. Findings • The level of returns of Basic EPS recorded in SBI bank, HDFCbank,AXISbank,CANARAbankandANDHRAbank as 7.452, 58.916, 20.1, -8.03 and -8.36 respectively. The highest level of returns records in HDFC bank.
  • 8. 43 Vibhute NS et al. J. Adv. Res. Eco. Busi. Mgmt. 2021; 4(2) Conclusion The project of ratio analysis in the production concern is not merely a work of the project. But a brief knowledge and experience of that how to analyze the financial performance of the firm. The study undertaken has brought in to the light of the following conclusions. According to this project I came know that from the analysis of financial statements the banking industry play important role in nation’s growth/ development and entire economy revolves around its strength. In modernization and growth is mirror of nation’s economy which can be only achieved by heavy investment largely borrowed funds. Banks being socio-economic entity depending largely upon leverage financing are bound to satisfy their investors and stakeholders and have to justify risk undertaken by them. In last, along with performance it is also important for a bank to understand the relationship between profitability & variables in balanced scorecard frame work, since performance can be improved if the influencing factors are known. Banks are organizer, promoter and architect of nation economy, their growth is regarded as mirror of nation economical strength. In order to become global from local they have to become competitive and fundamentally strong. This study has revealed the fact that future of Indian banks is bright, they are achieving the expected targets and will grow with time and become more competitive under unforeseen circumstances and will make India proud of their strategic universal economic domination. References 1. Haralayya B, Aithal PS. Inter Bank Analysis of Cost Efficiency Using Mean. International Journal of Innovative Research in Science, Engineering and Technology 2021; 10(6): 6391-6397. 2. Haralayya B, Aithal PS. Analysis of Total Factor Productivityand Profitability Matrix of Banks By Hmtfp and FPTFP. Science, Technology and Development Journal 2021; 10(6): 190-203. 3. Haralayya B, Aithal PS. Analysis of Banks Total Factor Productivity by Aggregate Level. Journal of Xi’an University of Architecture & Technology 2021; 13(6): 296-314. 4. Haralayya B, Aithal PS. Analysis Of Banks Total Factor Productivity By Disaggregate Level. International Journal of Creative Research Thoughts 2021; 9(6): 488-502. 5. Haralayya B. Importance of CRM in Banking and Financial Sectors. Journal of Advanced Research in Quality Control and Management  2021, 6(1): 8-9. 6. HaralayyaB.HowDigitalBankinghasBroughtInnovative Products and Services to India. Journal of Advanced Research in Quality Control and Management  2021; 6(1): 16-18. 7. Haralayya B. Top 5 Priorities That will Shape The Future of Retail Banking Industry in India. Journal of Advanced Research in HR and Organizational Management 2021; 8(1&2): 17-18. 8. Haralayya B. Millennials and Mobile-Savvy Consumers are Driving a Huge Shift in The Retail Banking Industry. Journal of Advanced Research in Operational and Marketing Management 2021; 4(1): 17-19. 9. Haralayya B. Core Banking Technology and Its Top 6 Implementation Challenges. Journal of Advanced Research in Operational and Marketing Management 2021; 4(1): 25-27. 10. Vibhute NS, Jewargi CB, Haralayya B. Study on Non- Performing Assets of Public Sector Banks. Iconic Research and Engineering Journals 2021; 4(12): 52-61. 11. Basha, Jeelan and Haralayya, Dr. Bhadrappa, Performance Analysis of Financial Ratios - Indian Public Non-Life Insurance Sector 2021. 12. Haralayya B. Testing Weak Form Efficiency of Indian Stock Market - An Empirical Study on NSE. Emerging Global Strategies for Indian Industry. 13. Vinoth S, Vemula HL, Haralayya B et al. Application of cloud computing in banking and e-commerce and related security threats, Materials Today: Proceedings, 2021. 14. Haralayya B, Aithal PS. Performance Affecting Factors of Indian Banking Sector: An Empirical Analysis. George Washington International Law Review; 7(1): 607-621. 15. Haralayya B, Aithal PS. Technical Efficiency Affecting Factors In Indian Banking Sector: An Empirical Analysis. Turkish Online Journal of Qualitative Inquiry 2021; 12(3): 2021, PAGE No : 603-620. 16. Haralayya B, Aithal PS. Implications of Banking Sector on Economic Development In India. GeorgeWashington International Law Review 2021; 7(1): 631-642. 17. Haralayya B, Aithal PS. Study on Productive Efficiency of Banks in Developing Country. International Research Journal of Humanities and Interdisciplinary Studies 2021; 2, Issue: 5, May 2021, Page No : 184-194. 18. Haralayya B, Aithal PS. Study on Model and Camel Analysis of Banking. Iconic Research And Engineering Journals 2021; 4(11): 244-259. 19. Haralayya B, Aithal PS. Analysis of cost efficiency on scheduled commercial banks in India. International Journal of Current Research 2021; 13(6): 17718-17725. 20. Haralayya B, Aithal PS. A Study on Structure and Growth of Banking Industry in India. International Journal of Research in Engineering, Science and Management 2021; 4(5): 225-230. 21. HaralayyaB.RetailBankingTrendsinIndia.International JournalofAllResearchEducationandScientificMethods 2021; 9(5): 3730-3732. 22. Haralayya B, Aithal PS. Factors Determining the
  • 9. 44 Vibhute NS et al. J. Adv. Res. Eco. Busi. Mgmt. 2021; 4(2) Efficiency in Indian Banking Sector : A Tobit Regression Analysis. International Journal of Science & Engineering Development Research 2021; 6(6): 1-6. 23. Haralayya B, Aithal PS. Implications of Banking Sector on Economic Development In India, flusserstudies 2021; 30: Page No:1068-1080. 24. Haralayya B, Aithal PS. Study on Productive Efficiency Of Financial Institutions. International Journal of Innovative Research in Technology 2021; 8(1): 159-164. 25. Haralayya B. Study of Banking Services Provided By Banks In India. International Research Journal of Humanities and Interdisciplinary Studies 2021; 2(6): 06- 12. 26. Haralayya B, Aithal PS. Analysis of Bank Performance Using Camel Approach. International Journal of Emerging Technologies and Innovative Research 2021; 8(5): 305-314. 27. Haralayya B, Aithal PS. Analysis of Bank Productivity using Panel Causality test. Journal of Huazhong University of Science and Technology 2021; 50(6): 1-16. 28. Jeelan BV. Financial Performance Analysis of Post- Merger and Acquisition. International Journal of Business and Administration Research Review 2016; 1(1). 29. Jeelan BV. Empirical Study on Estimation of Value using Constant Dividend Growth (Gordon) Model: With Special Reference to Selected Companies. International Journal of Management and Social Sciences Research. 30. Jeelan BV. Empirical Study on Determinants of Foreign Exchange Rates with Reference to Indian Rupee v/s US Dollar. International Journal of Business and Administration Research Review 2015; 2(10). 31. Jeelan BV. An Empirical Study on Relationship between Future and Spot Price. International Journal of Current Research 2016; 8(6): 33775-33779. 32. Jeelan BV. A Study on Private placement - A Key to Primary Market. International Multidisciplinary E-Journal 2015. 33. JeelanBV.xaminationofGARCHModelforDeterminants of Infosys Stock Returns. International Journal of Current Research 2015; 7(12): 24811-24815. 34. Jeelan BV. Impact of Buyback Announcements on Stock Market in India. Global Journal For Research Analysis 2015. 35. Jeelan BV. An Empirical Study on Analysis of Stock Brokers in Indian Stock Markets with Special Reference Cash Market. Indian Journal of Applied Research 2014. 36. JeelanBV.PerformanceEvaluationofMutualFundswith Special Reference to Selected Schemes. International Journal of Current Research 2015; 7(4): 15316-15318. 37. Jeelan BV. Wealth Maximization: An Empirical Analysis of Bonus Shares and Right Issue. Indian Journal of Applied Research 2014. 38. Jeelan BV. Forecasting Imports of India Using Auto- regressive Integrated Moving Average. International Journal of Business and Administration Research Review 2015. 39. Jeelan BV. Comparative Study on NPAs (With Special Reference to Scheduled Commercial Banks, Public Sector Banks and Foreign Banks in India). Global Journal for Research Analysis 2016. 40. Jeelan BV. Testing for Granger Causality between BSE Sensex and Forex Reserves: An Empirical Study. International Journal of Current Research 2015; 7(11)- 23381-23385. 41. Jeelan BV. A Study on Type and Method of Issues - A Corner Stone of Primary Market. International Journal of Business and Administration Research Review 2015.