Download as PDF, PPTX
![Query data from the
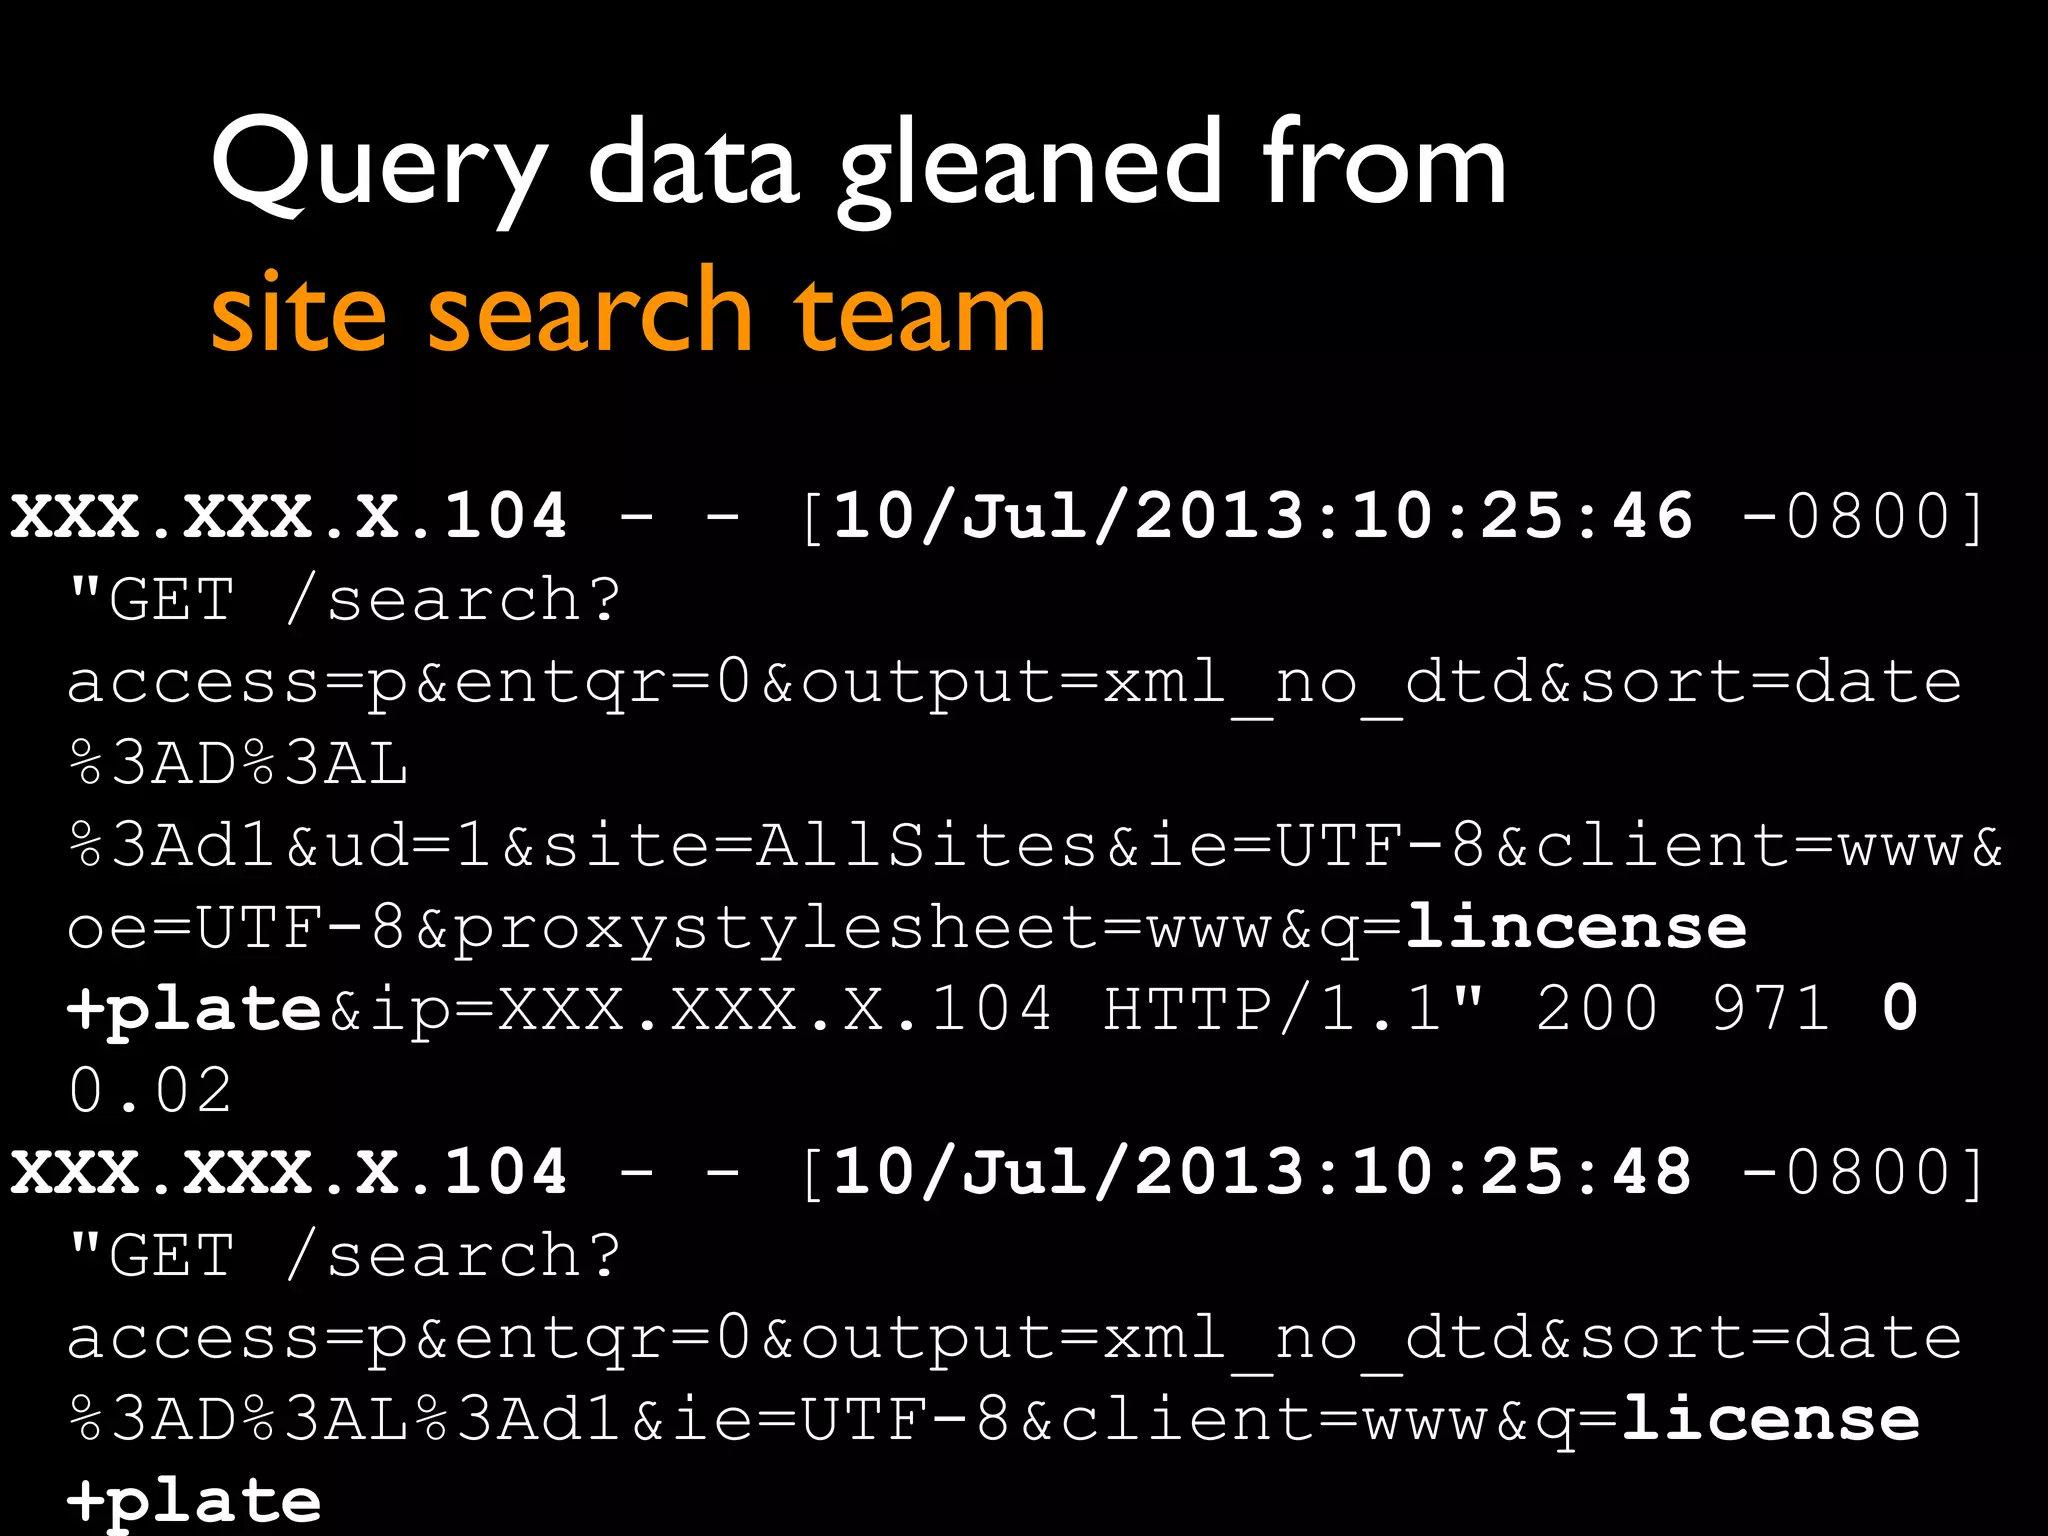
search team
XXX.XXX.X.104 - - [10/Jul/2013:10:25:46 -0800]
"GET /search?
access=p&entqr=0&output=xml_no_dtd&sort=date%
3AD%3AL%3Ad1&ud=1&site=AllSites&ie=UTF-8&clie
nt=www&oe=UTF-8&proxystylesheet=www&q=lincens
e+plate&ip=XXX.XXX.X.104 HTTP/1.1" 200 971 0
0.02
XXX.XXX.X.104 - - [10/Jul/2013:10:25:48 -0800]
"GET /search?
access=p&entqr=0&output=xml_no_dtd&sort=date%
3AD%3AL%3Ad1&ie=UTF-8&client=www&q=license+pl](https://image.slidesharecdn.com/iasummit-110307162802-phpapp01/75/Beyond-User-Research-10-2048.jpg)

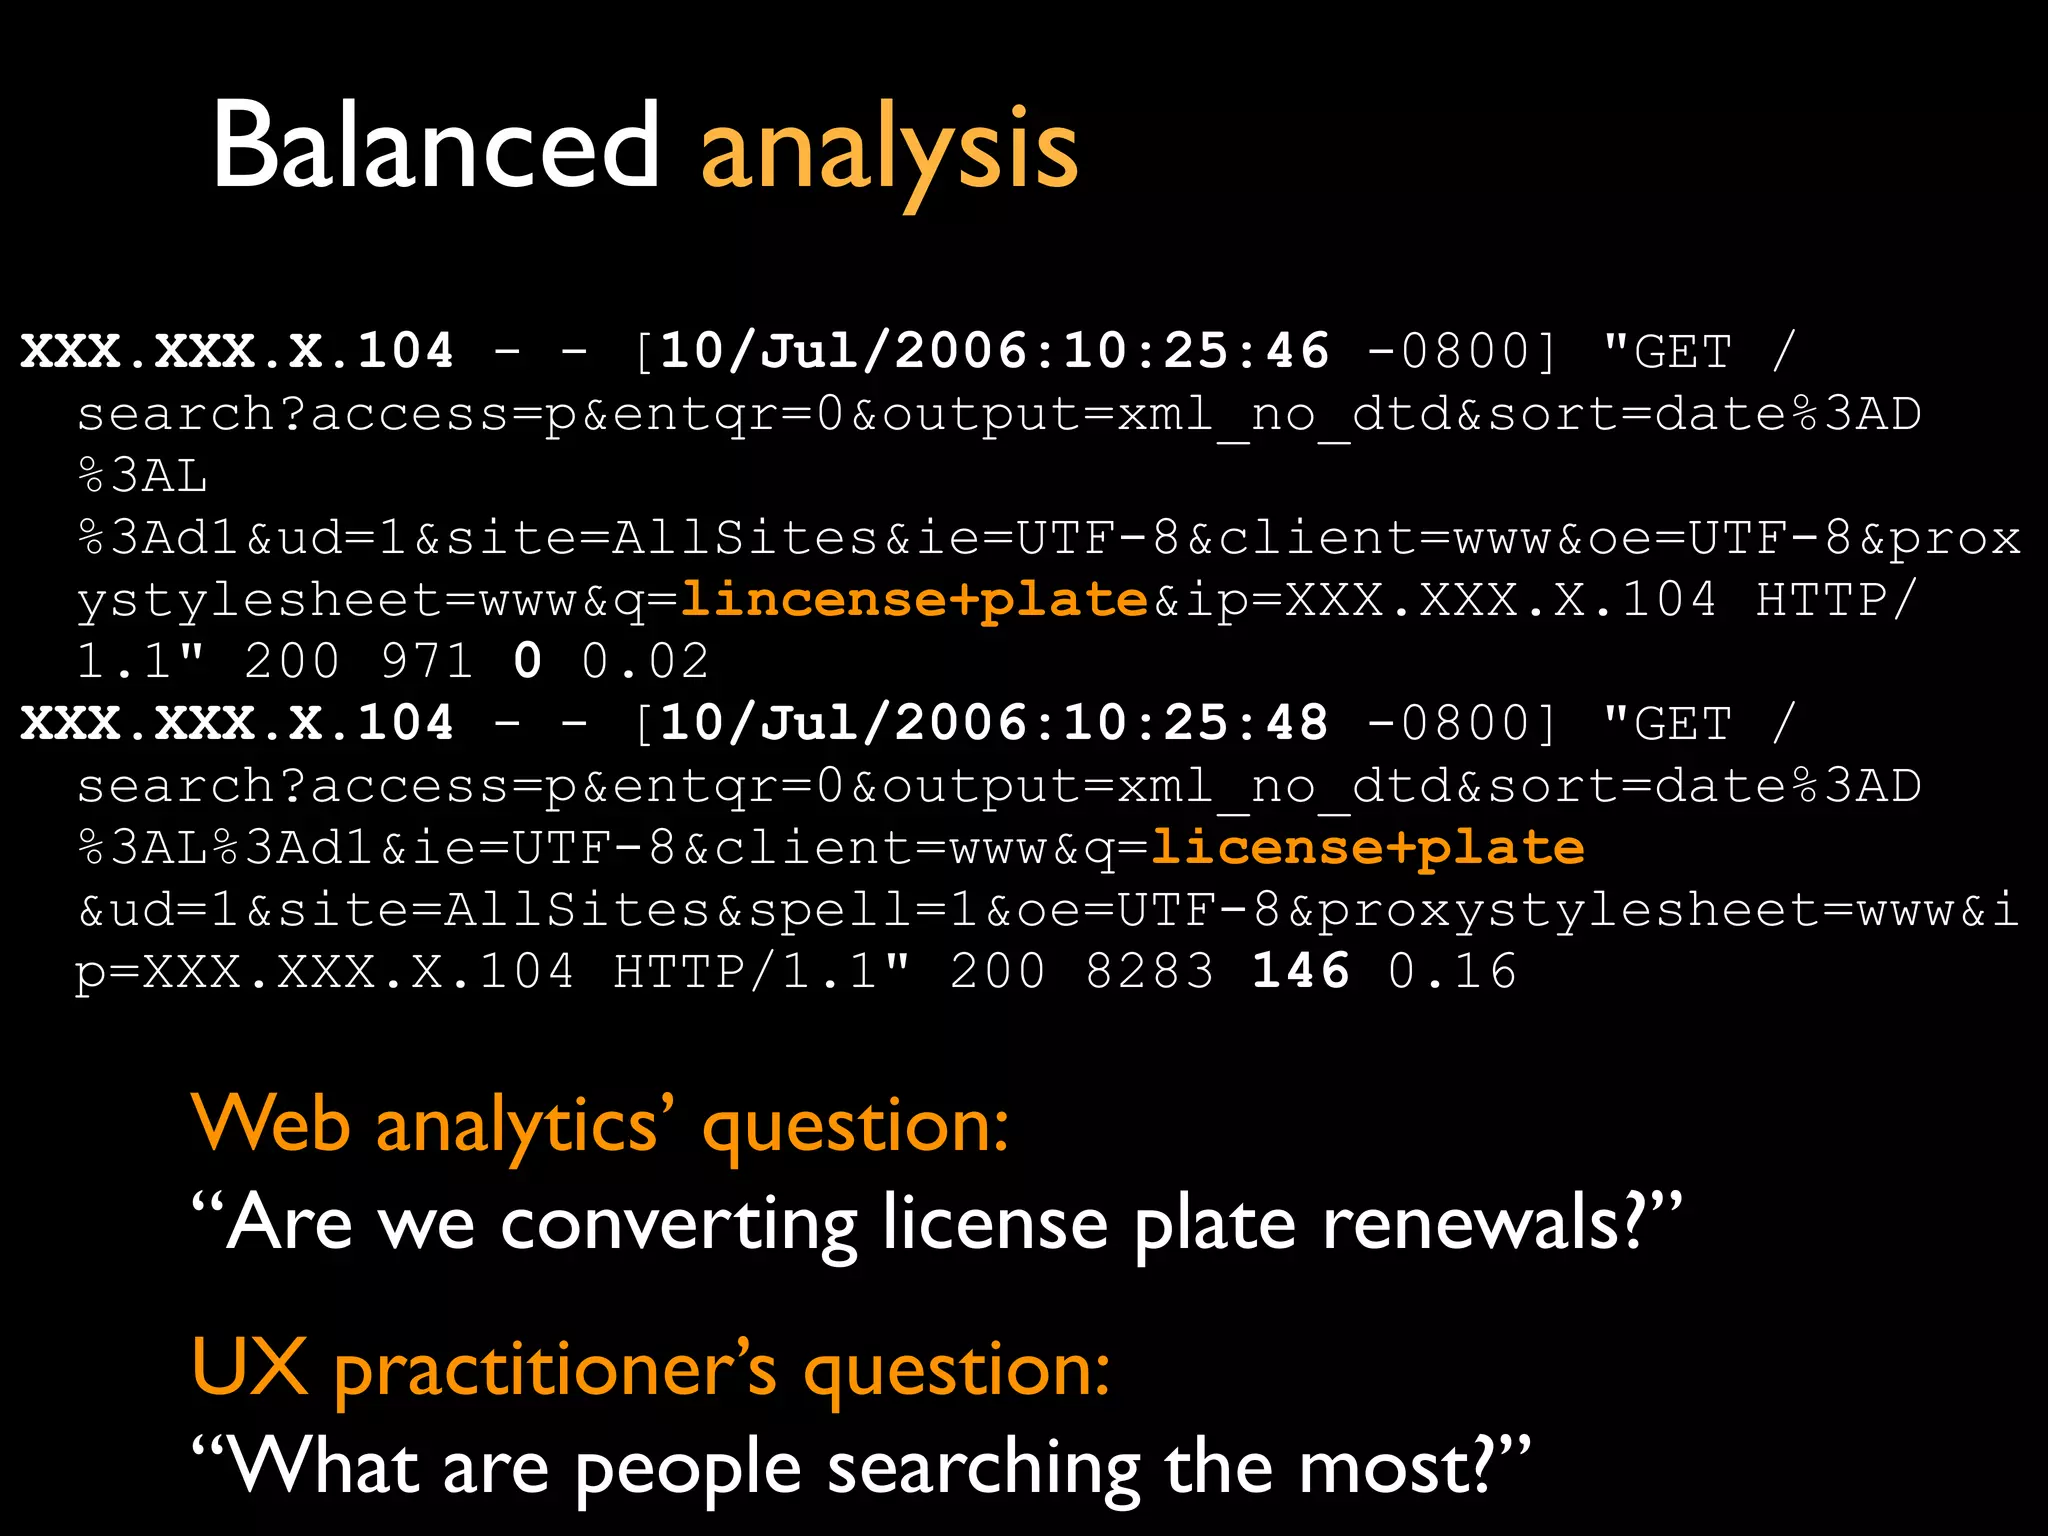
![XXX.XXX.X.104 - - [10/Jul/2006:10:25:46 -0800] "GET /
search?
access=p&entqr=0&output=xml_no_dtd&sort=date%3AD%3AL%3Ad1&
ud=1&site=AllSites&ie=UTF-8&client=www&oe=UTF-8&proxystyle
sheet=www&q=lincense+plate&ip=XXX.XXX.X.104 HTTP/1.1" 200
971 0 0.02
XXX.XXX.X.104 - - [10/Jul/2006:10:25:48 -0800] "GET /
search?
access=p&entqr=0&output=xml_no_dtd&sort=date%3AD%3AL%3Ad1&
ie=UTF-8&client=www&q=license+plate
&ud=1&site=AllSites&spell=1&oe=UTF-8&proxystylesheet=www&i
p=XXX.XXX.X.104 HTTP/1.1" 200 8283 146 0.16
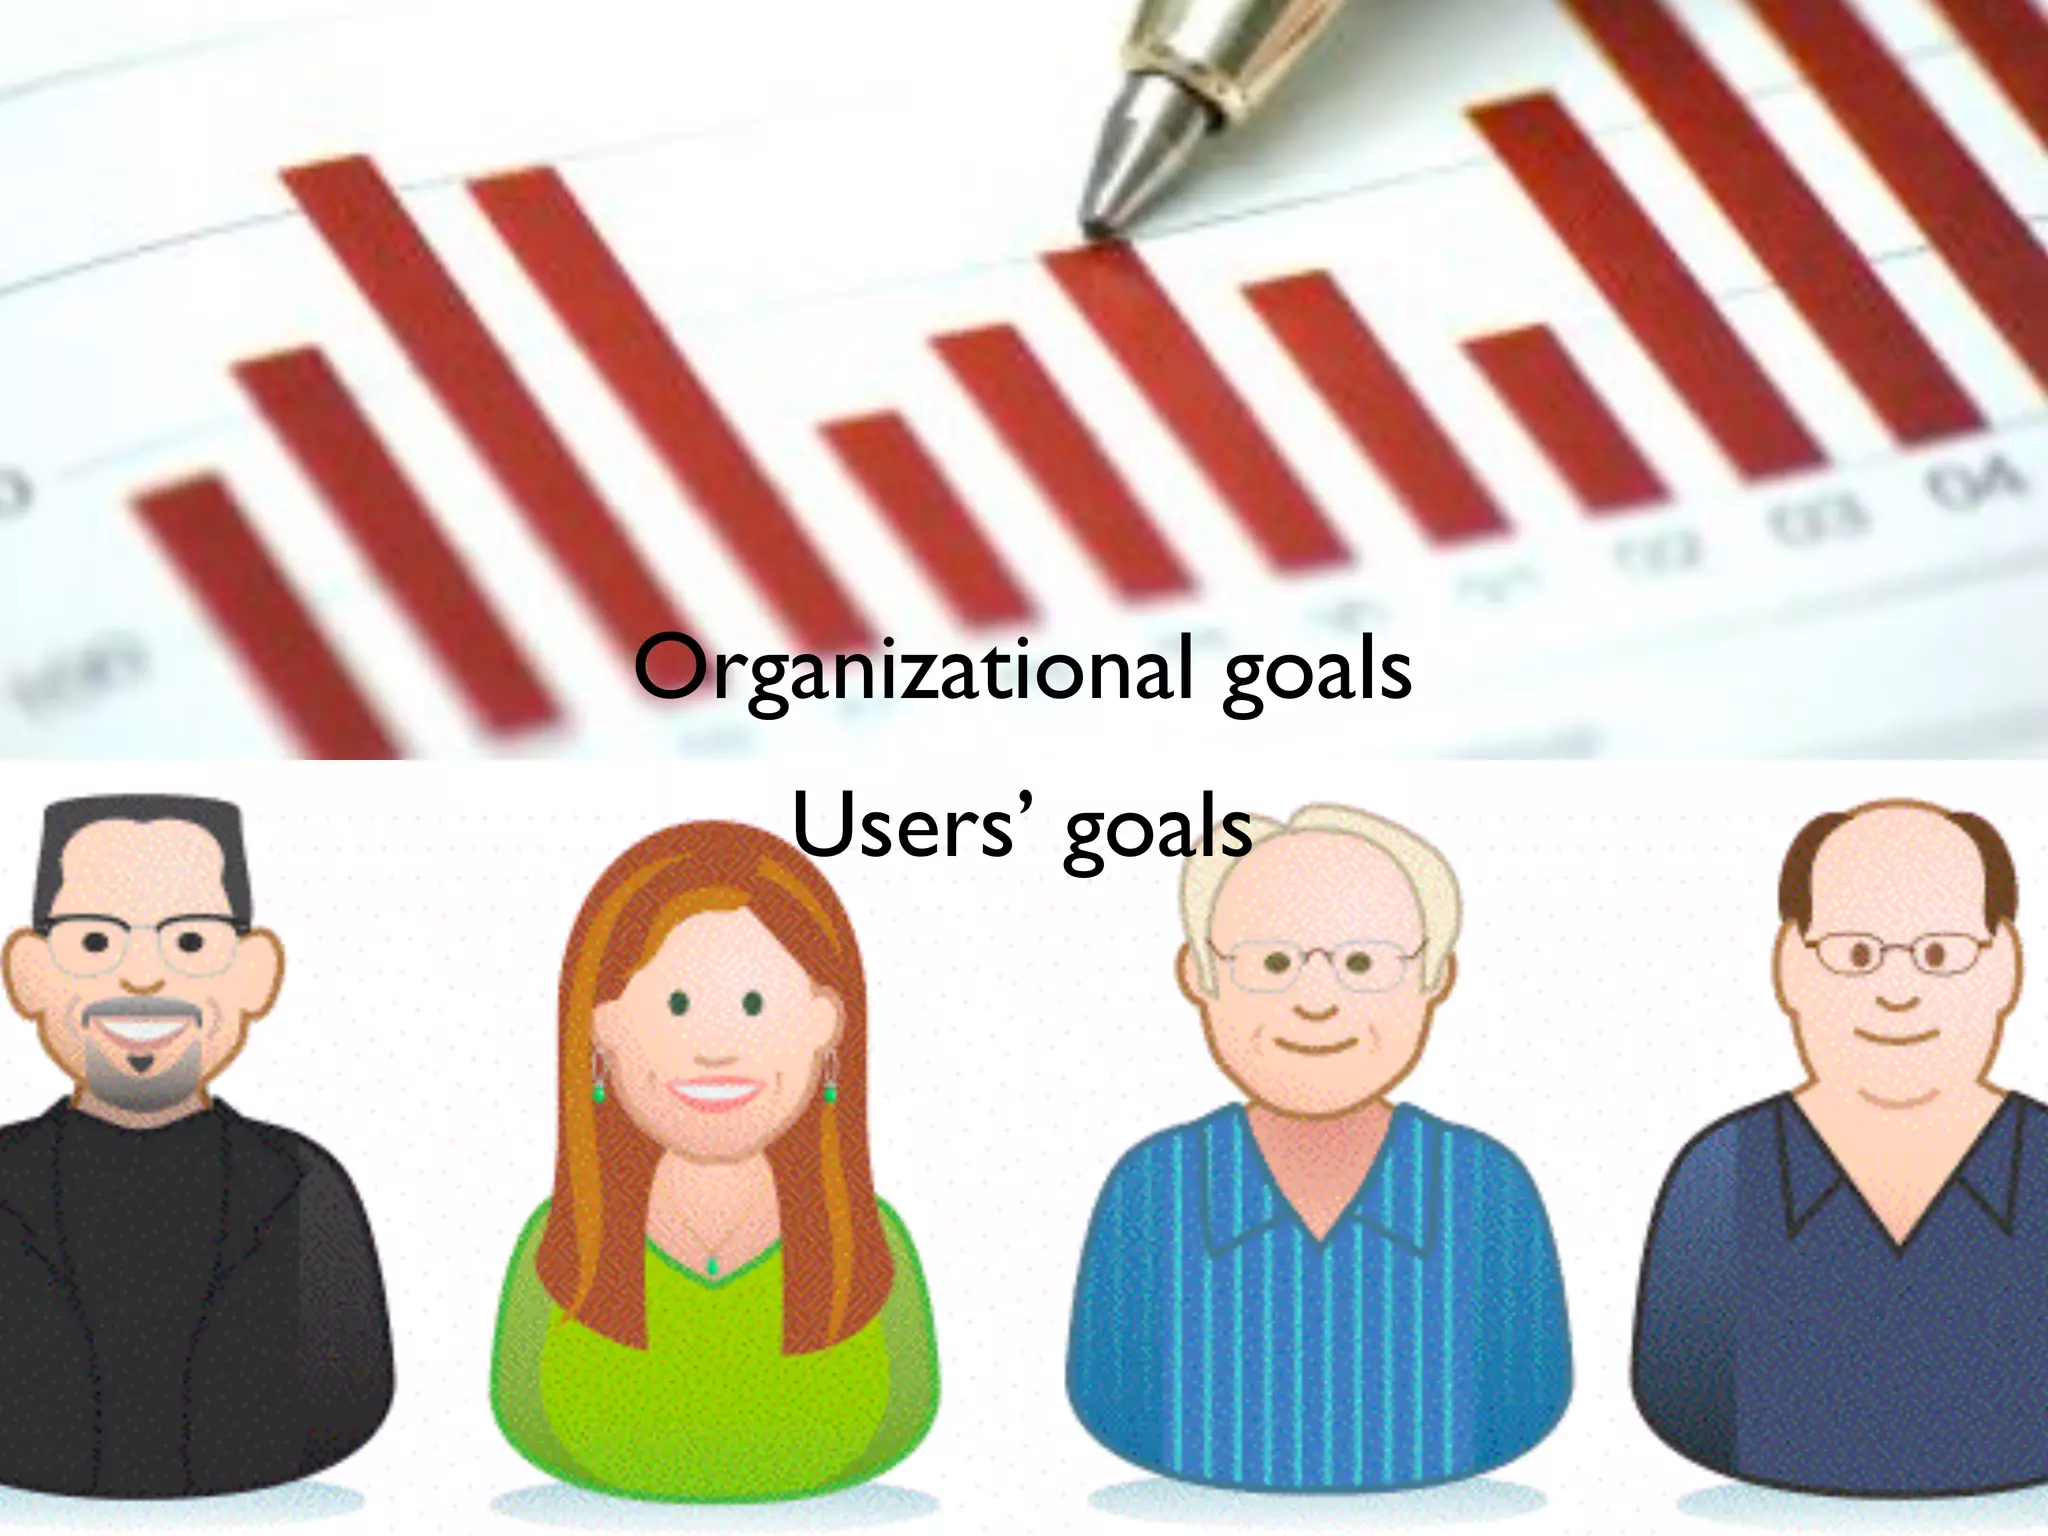
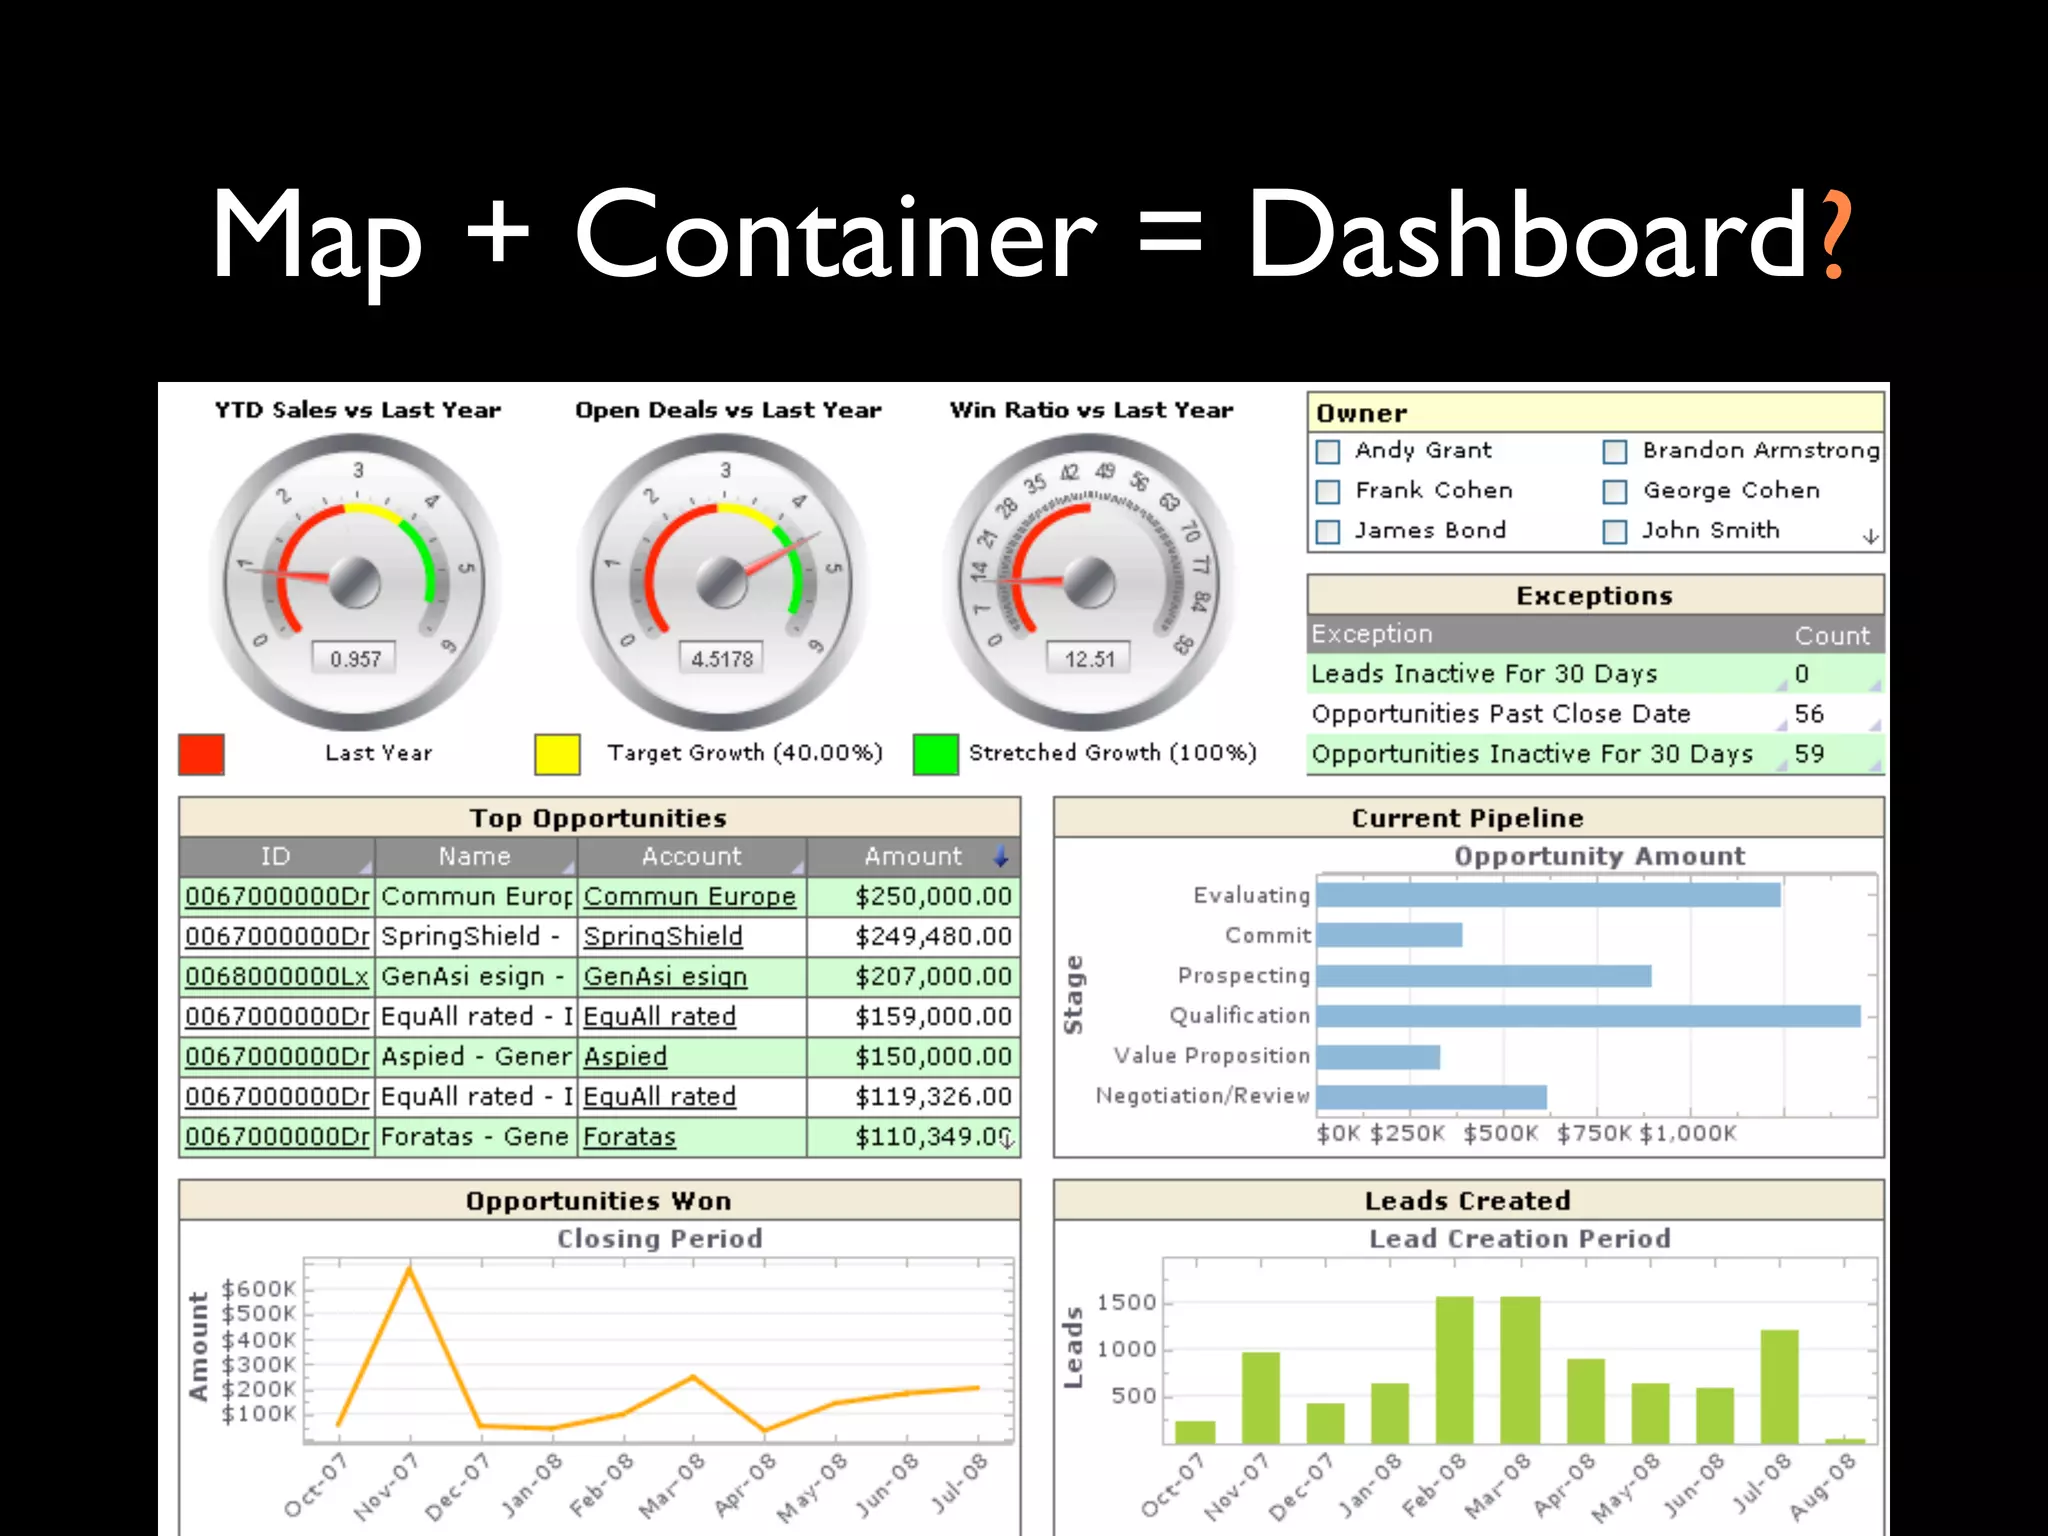
Web analytics asks:
“Are we converting license plate renewals?”
User researcher asks:
“What are people searching the most?”
Balanced analysis](https://image.slidesharecdn.com/iasummit-110307162802-phpapp01/75/Beyond-User-Research-36-2048.jpg)
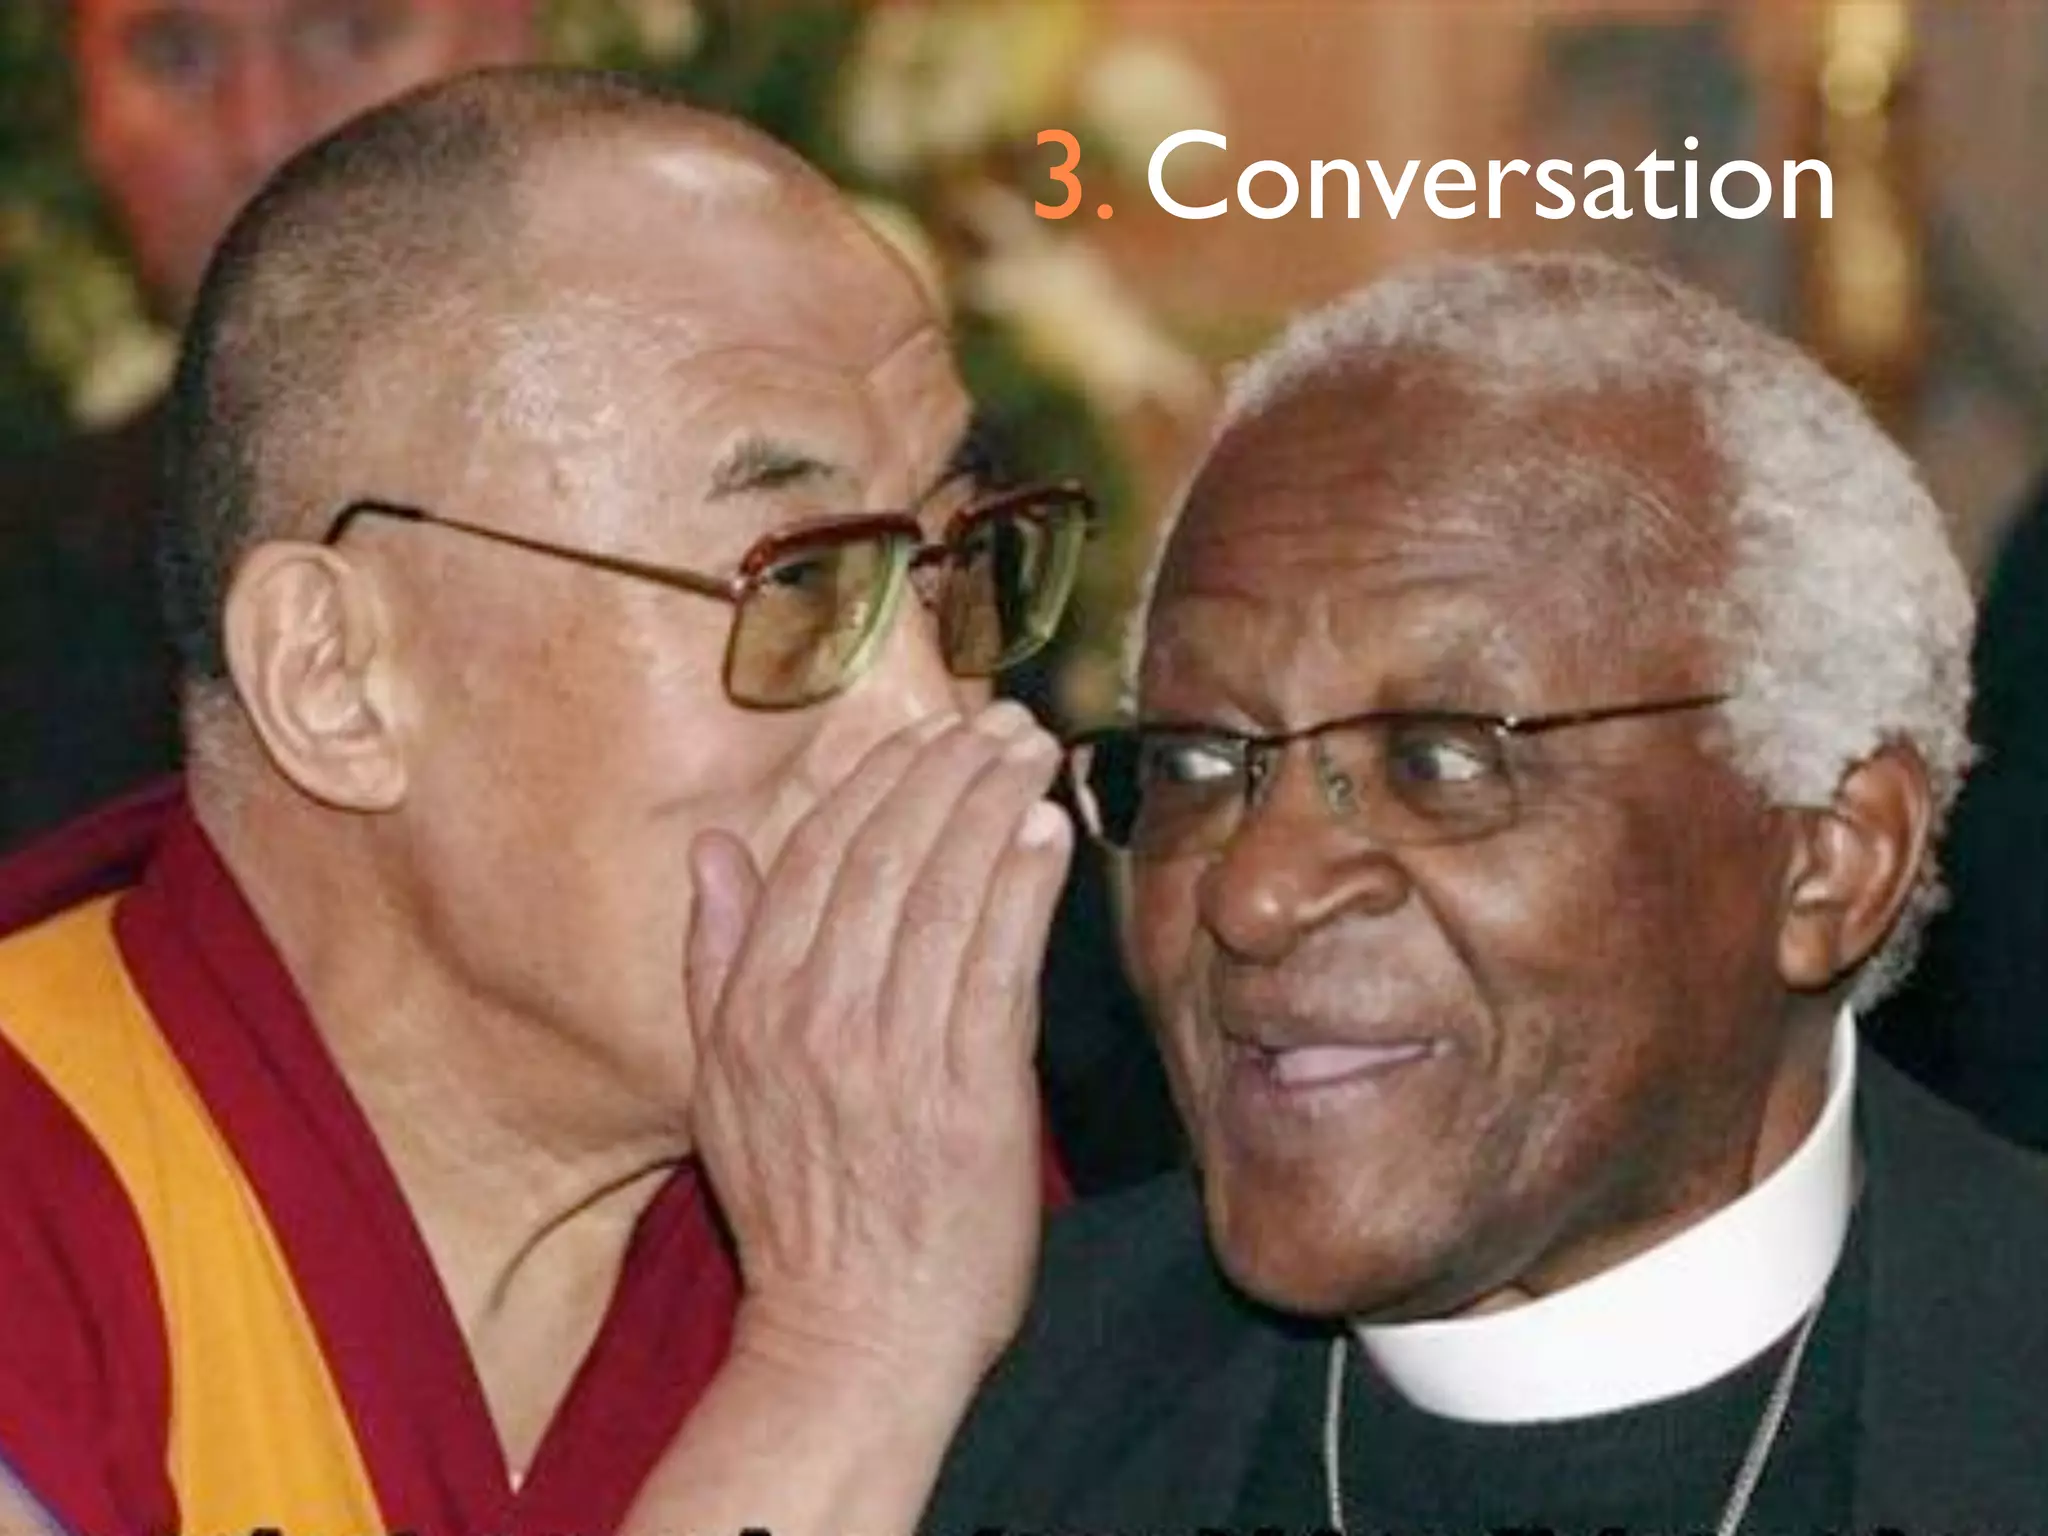
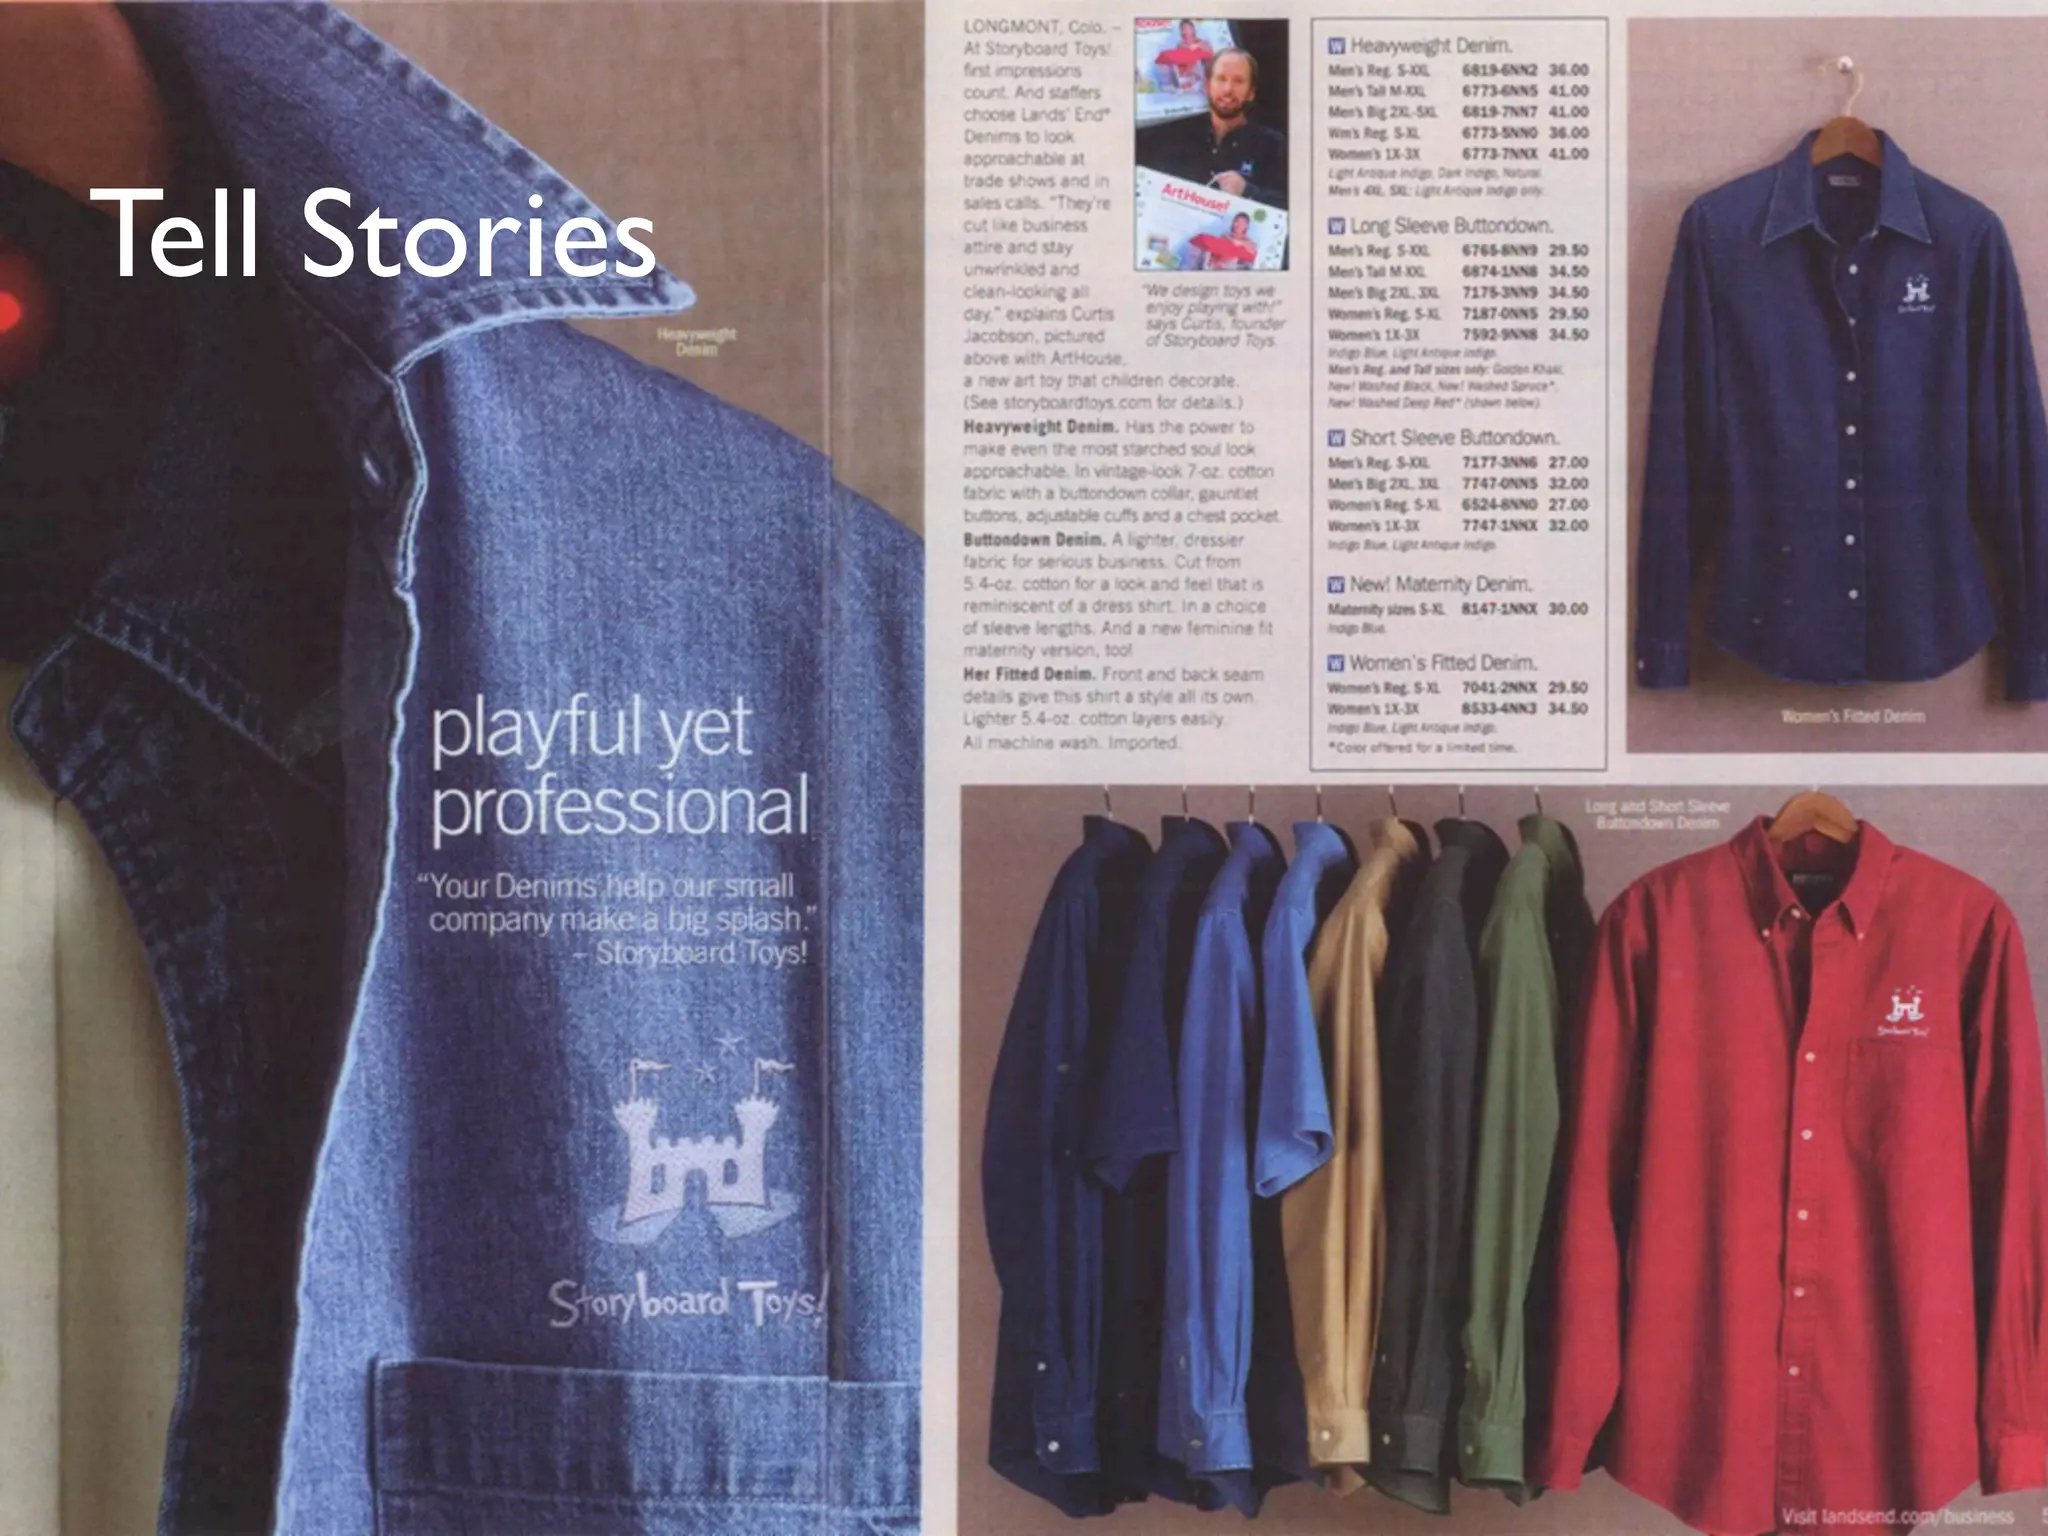
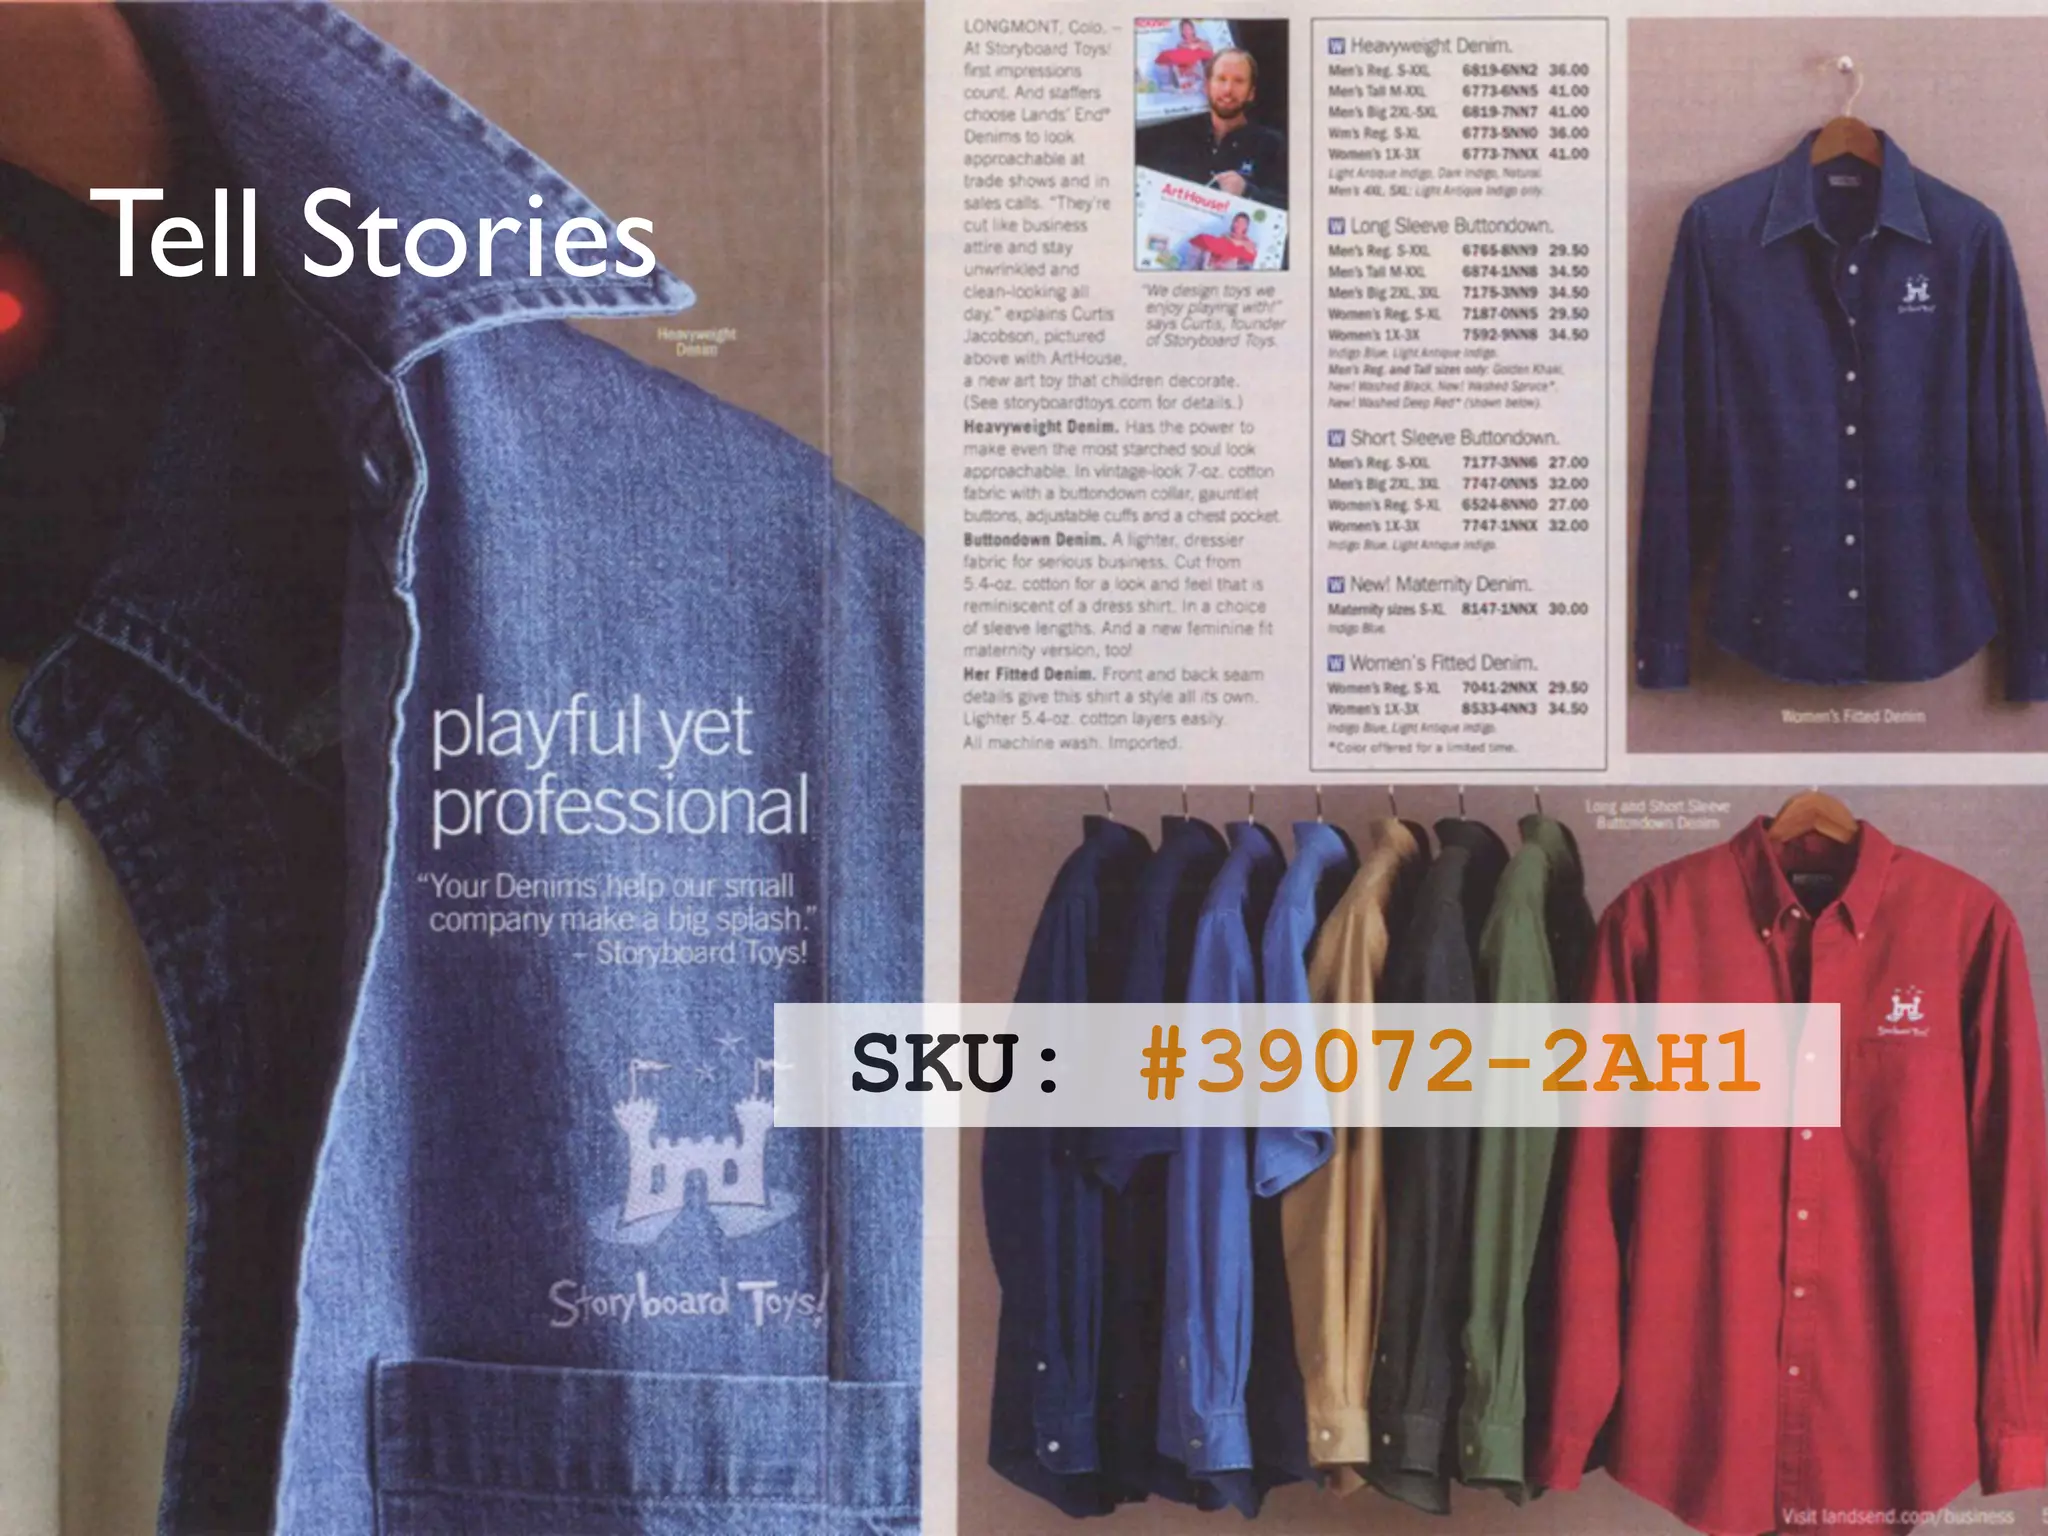

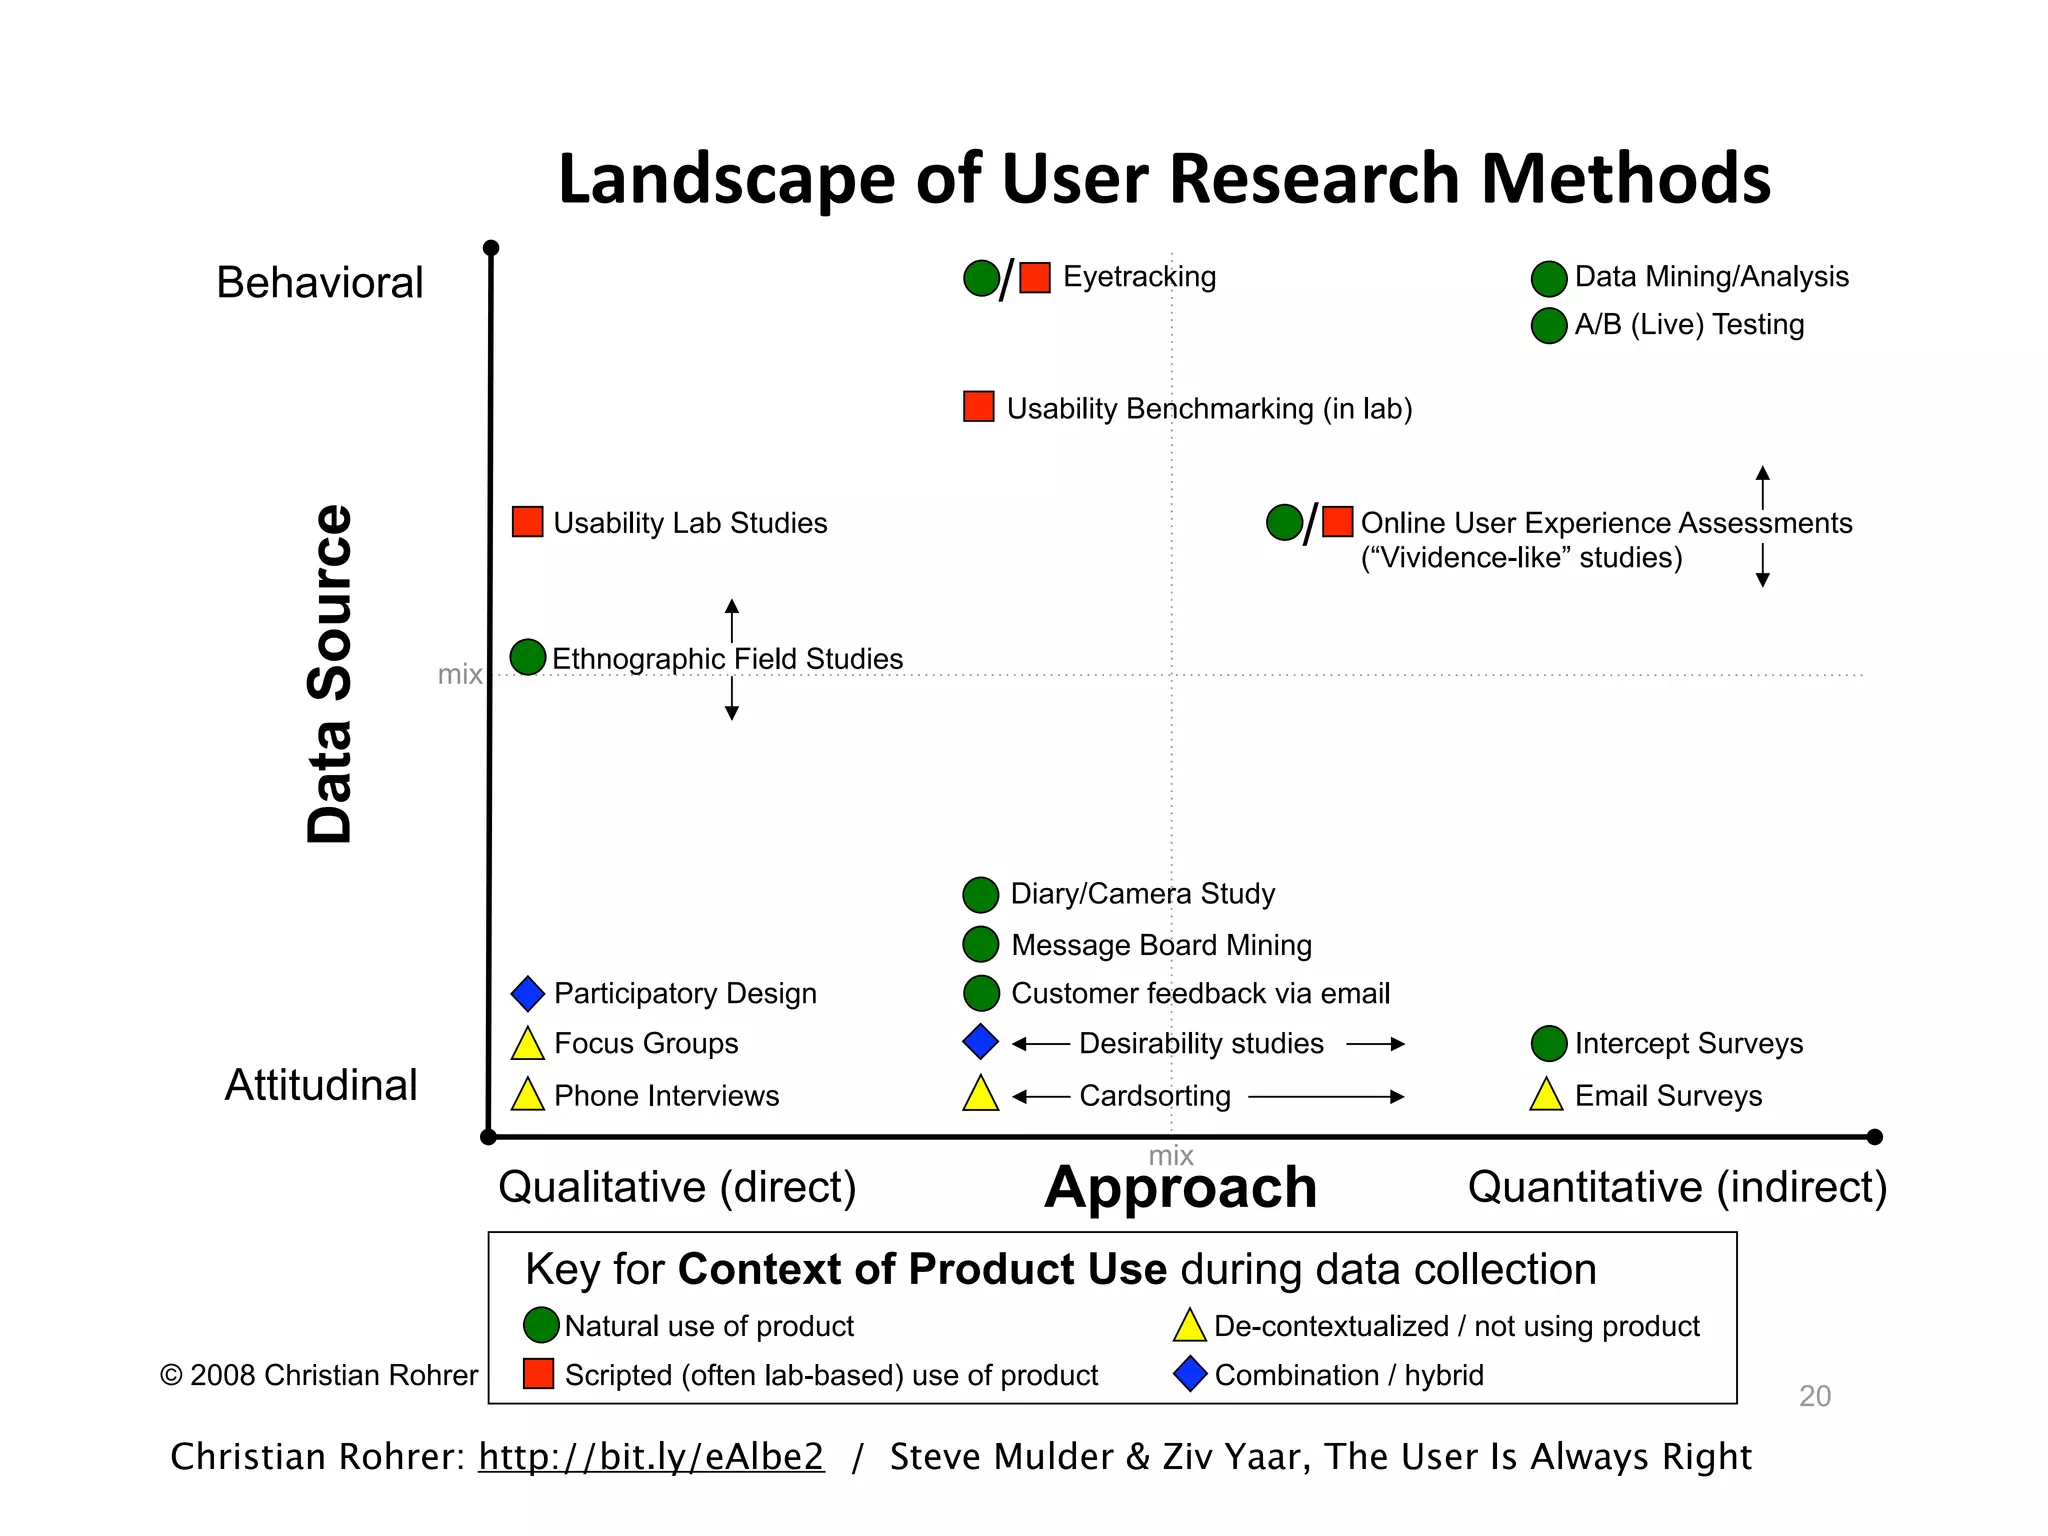
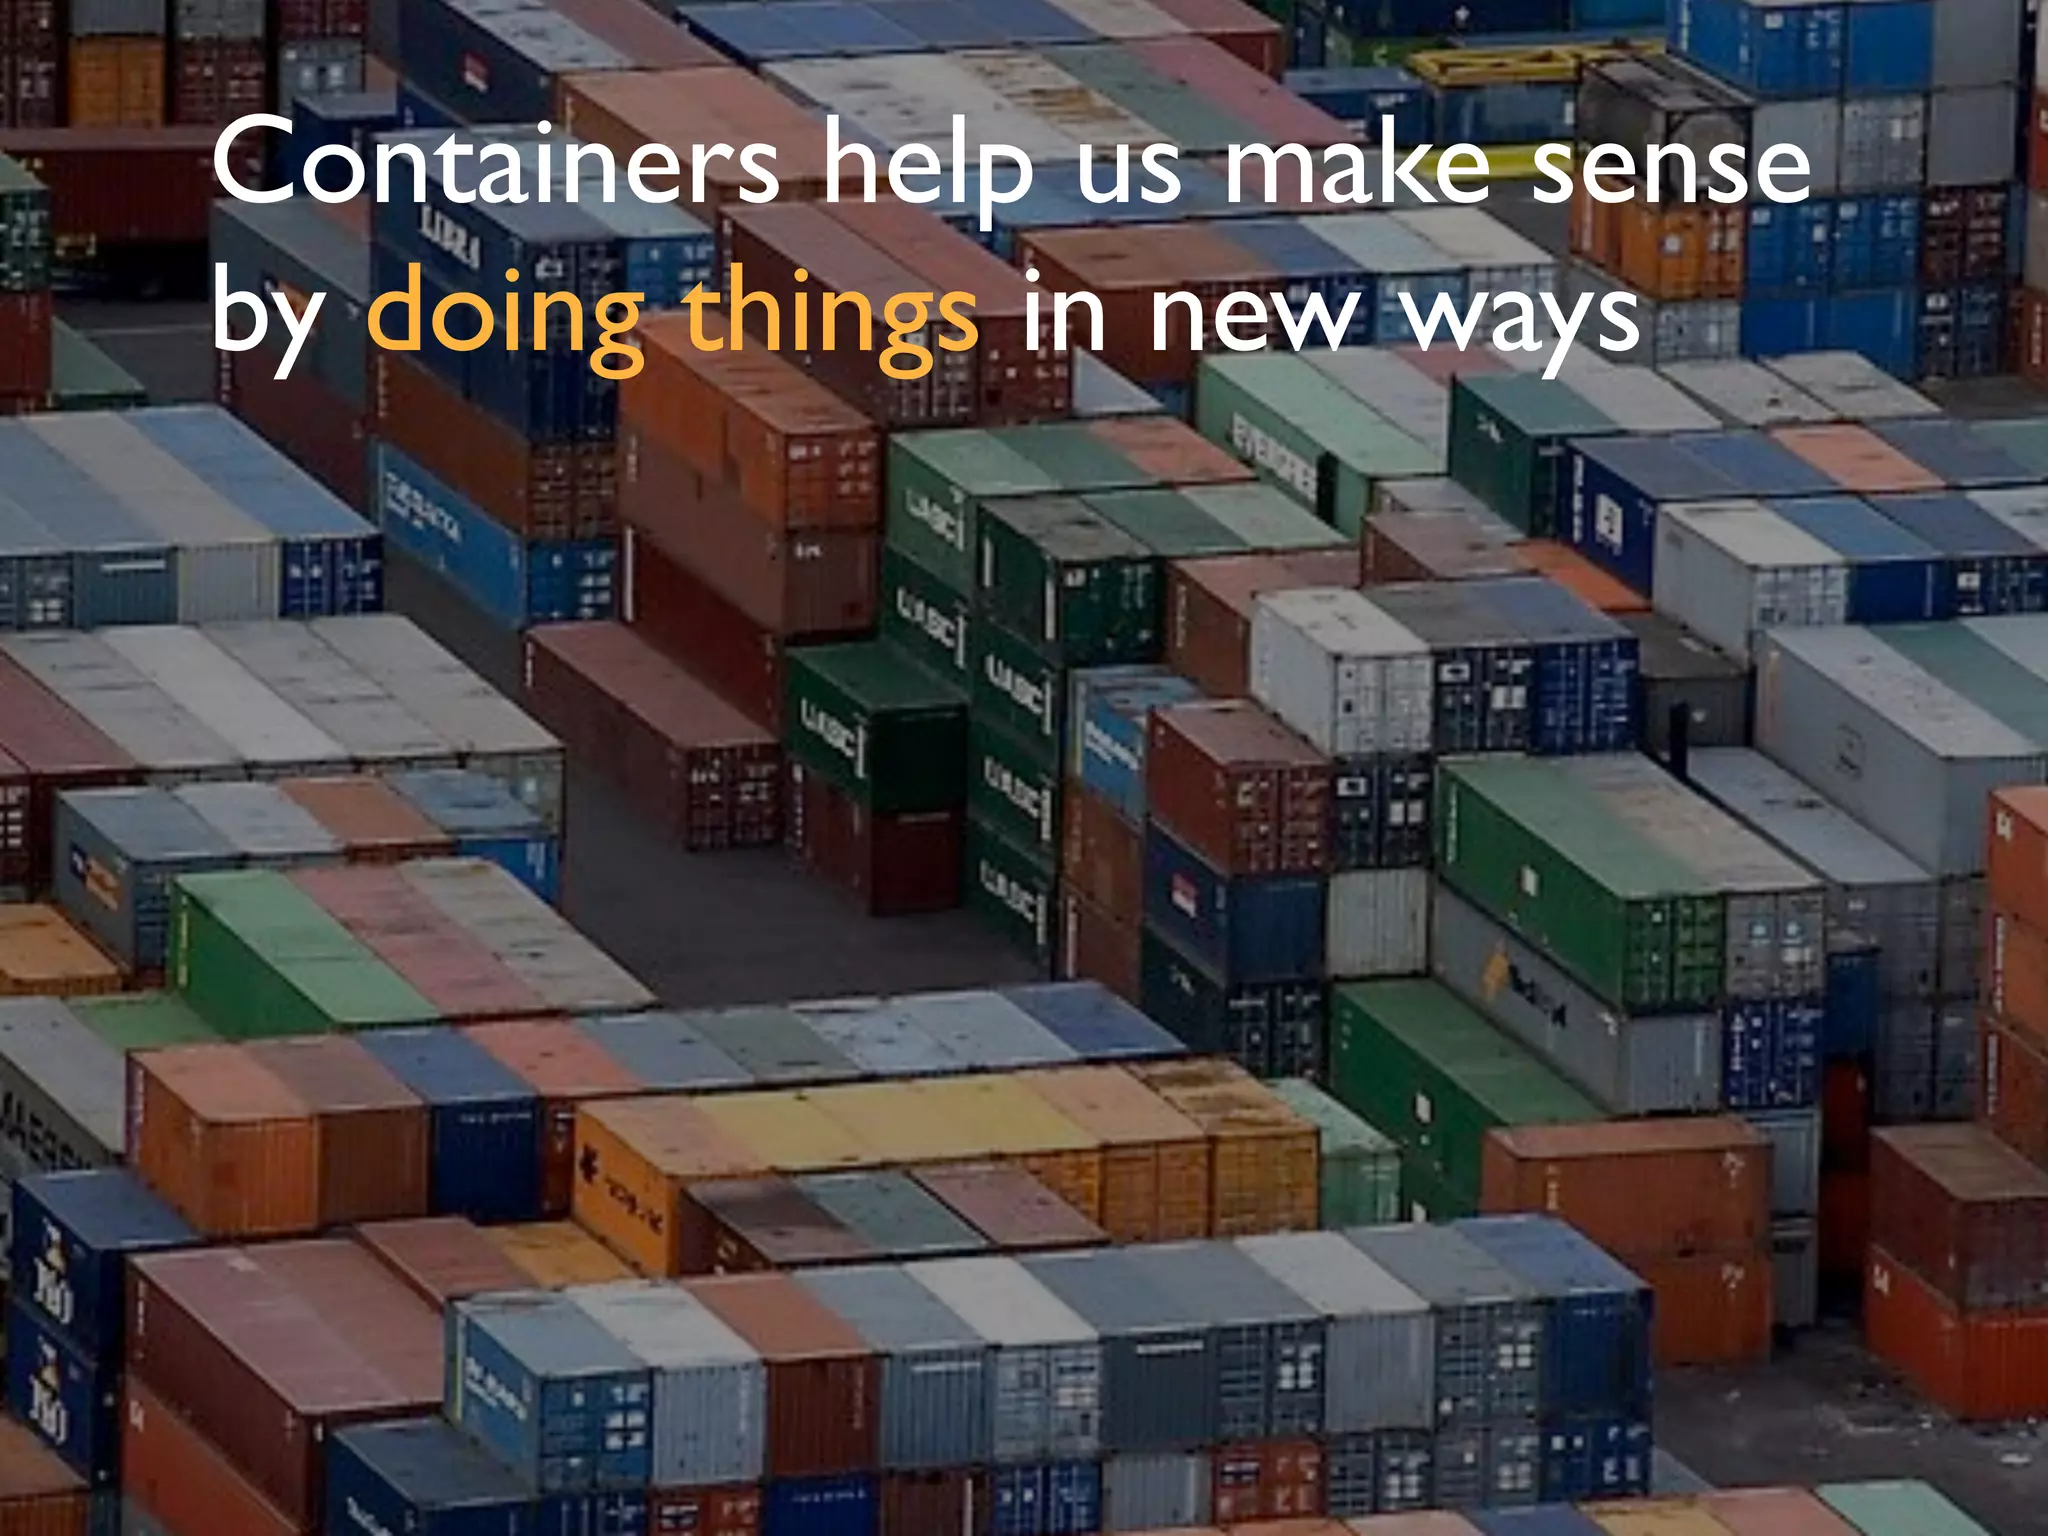
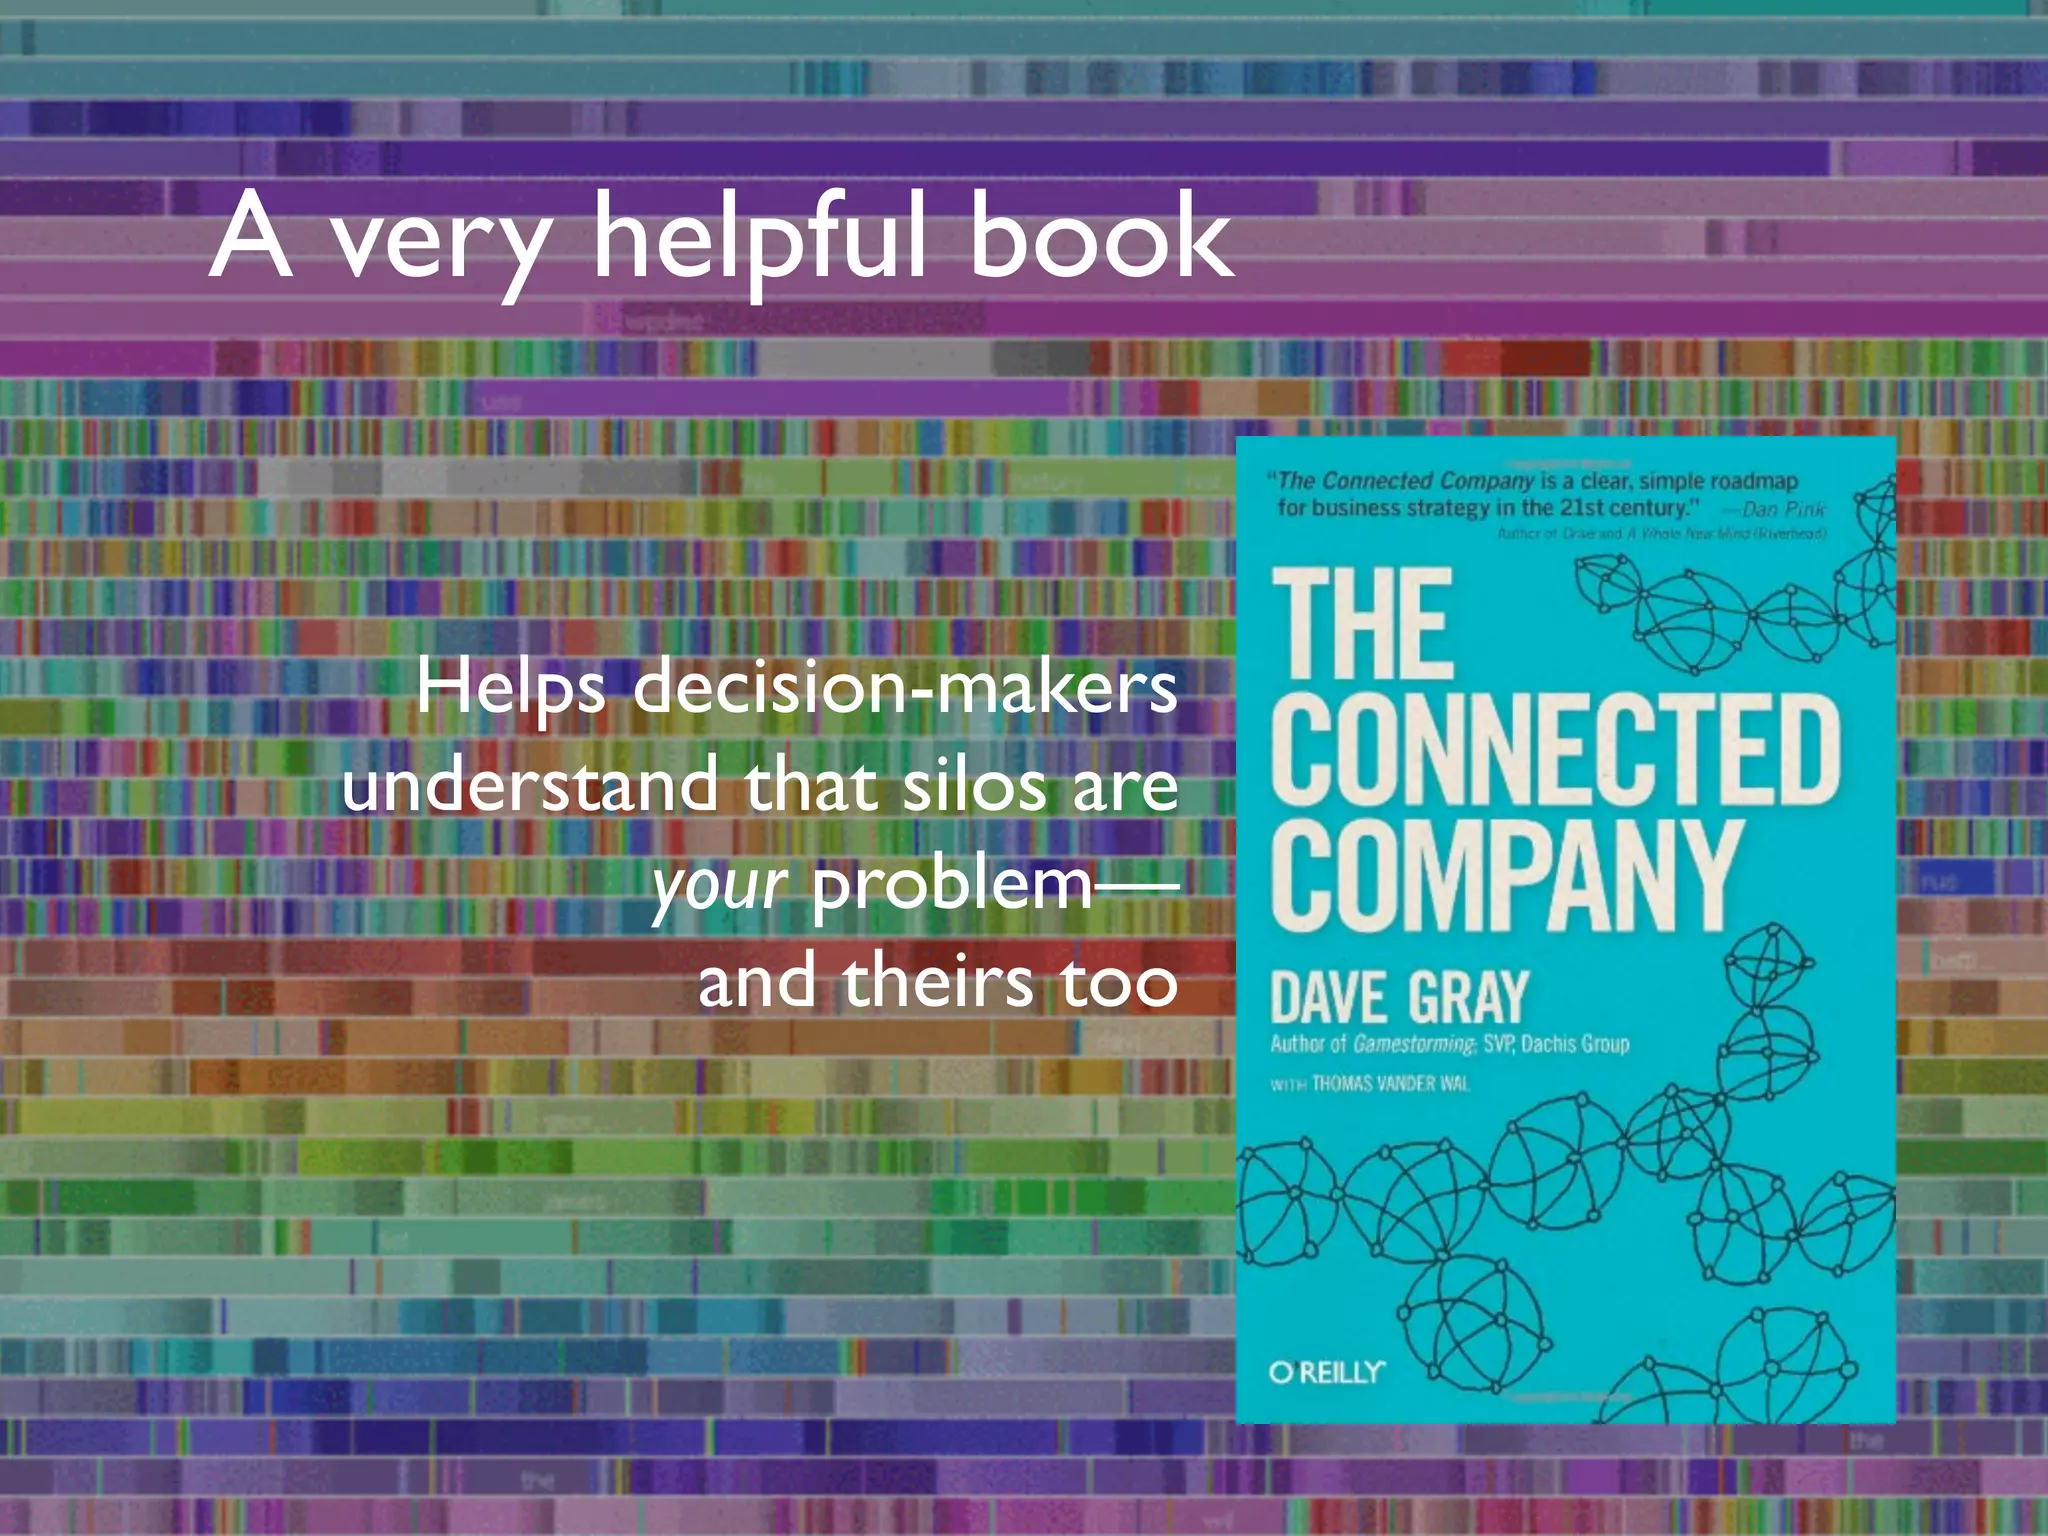


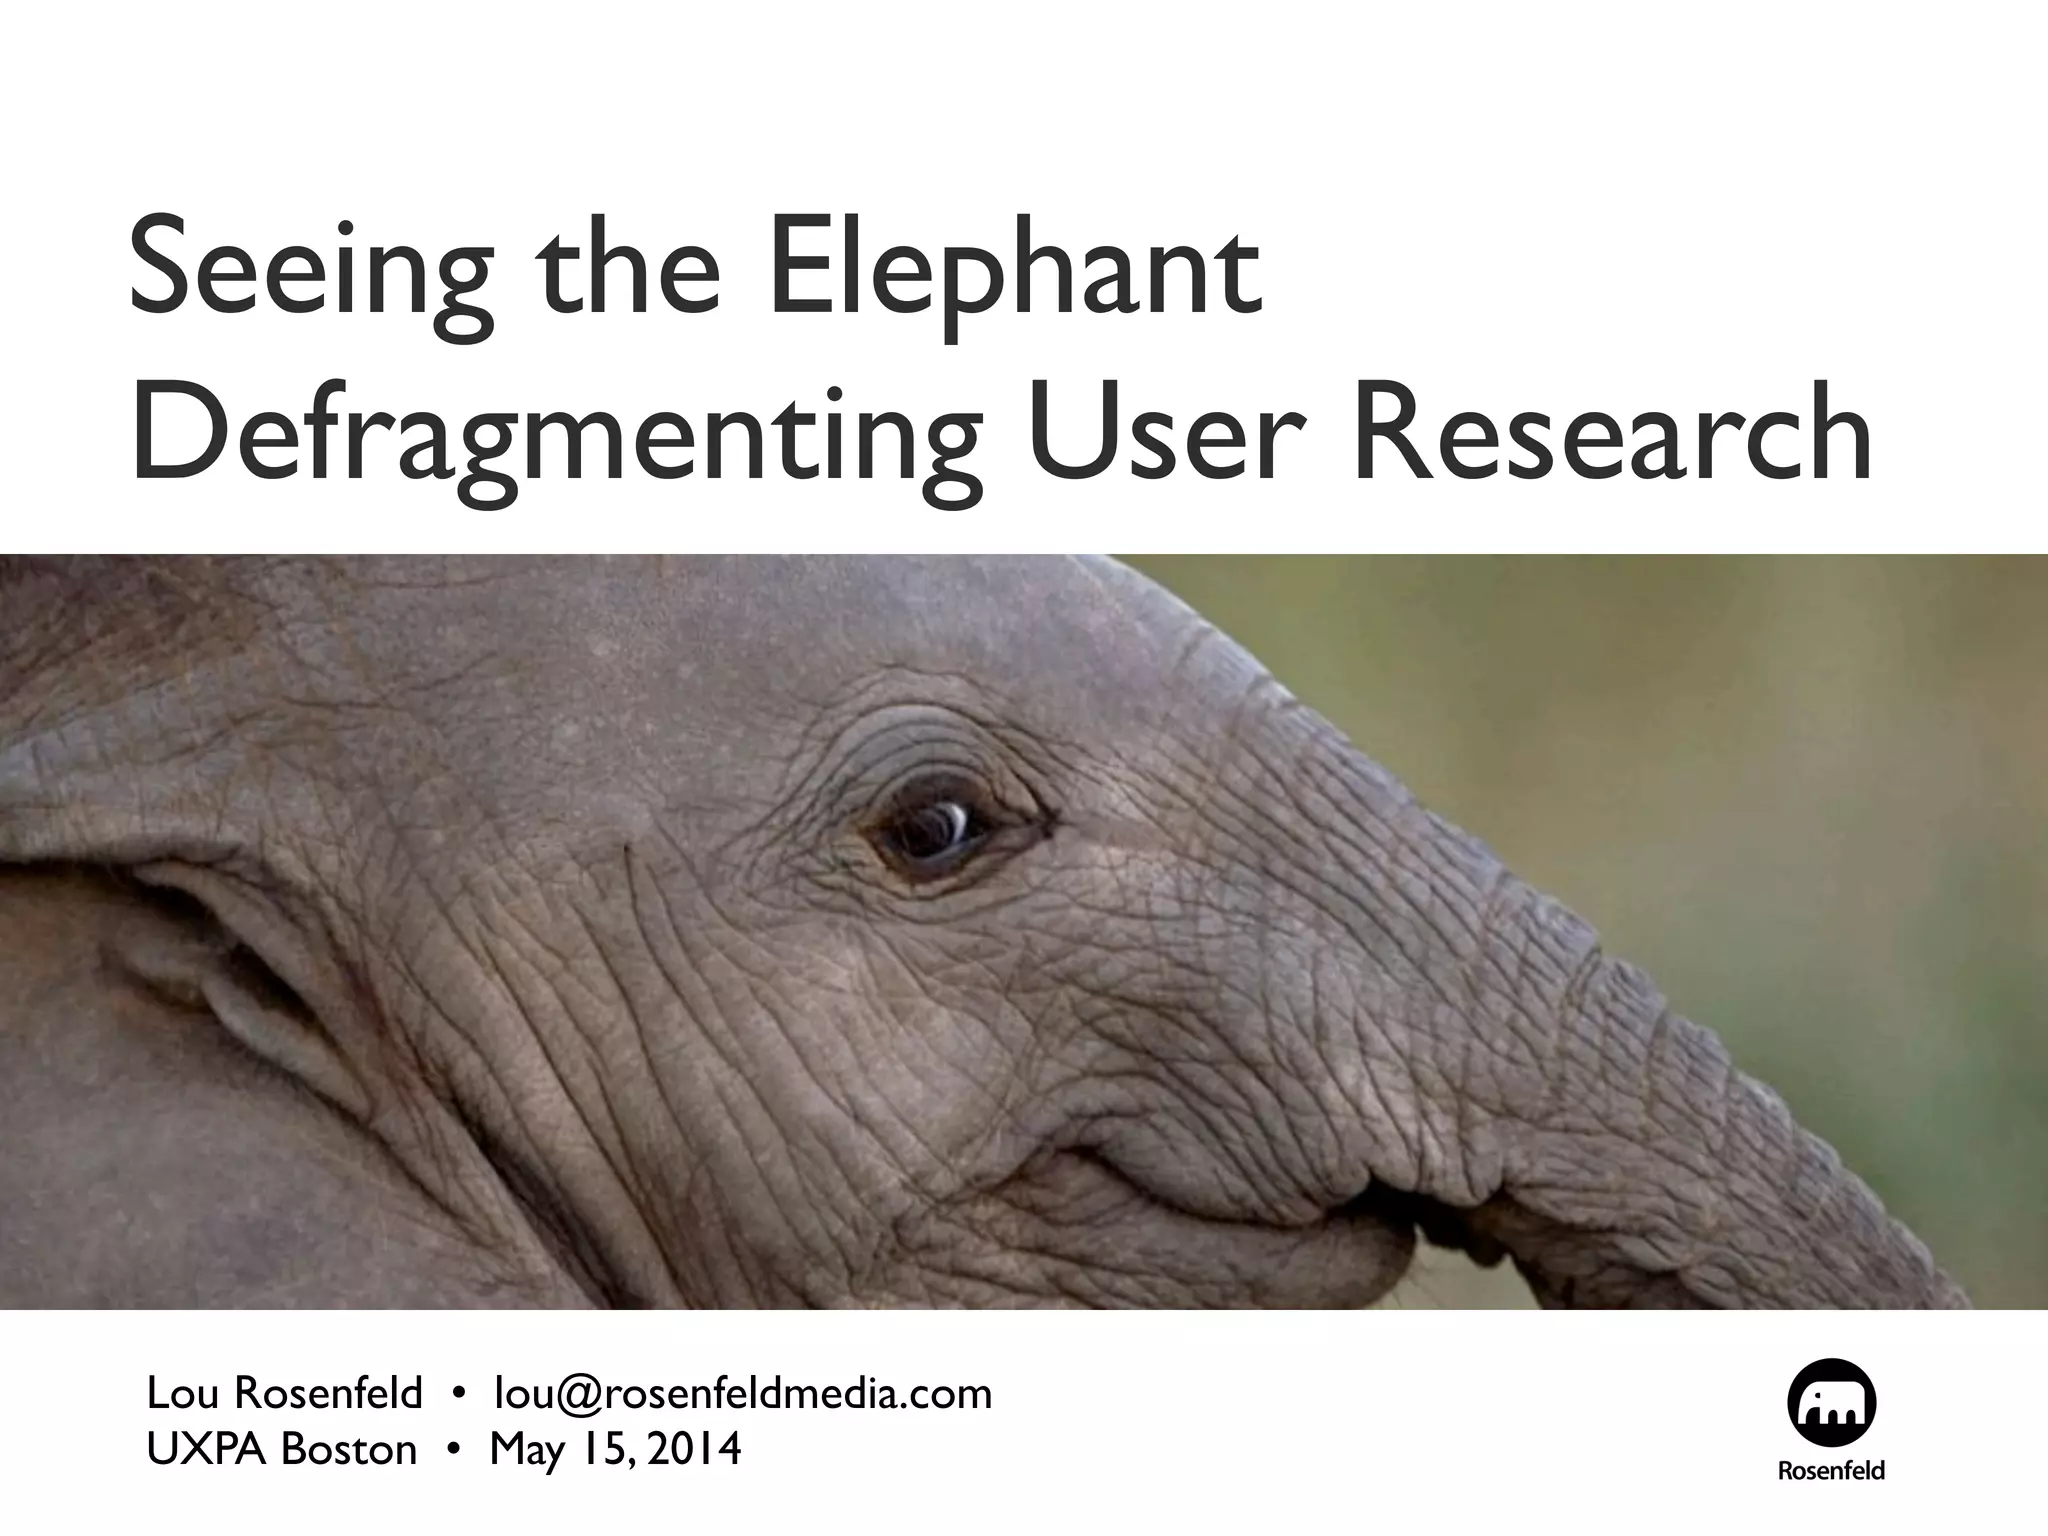
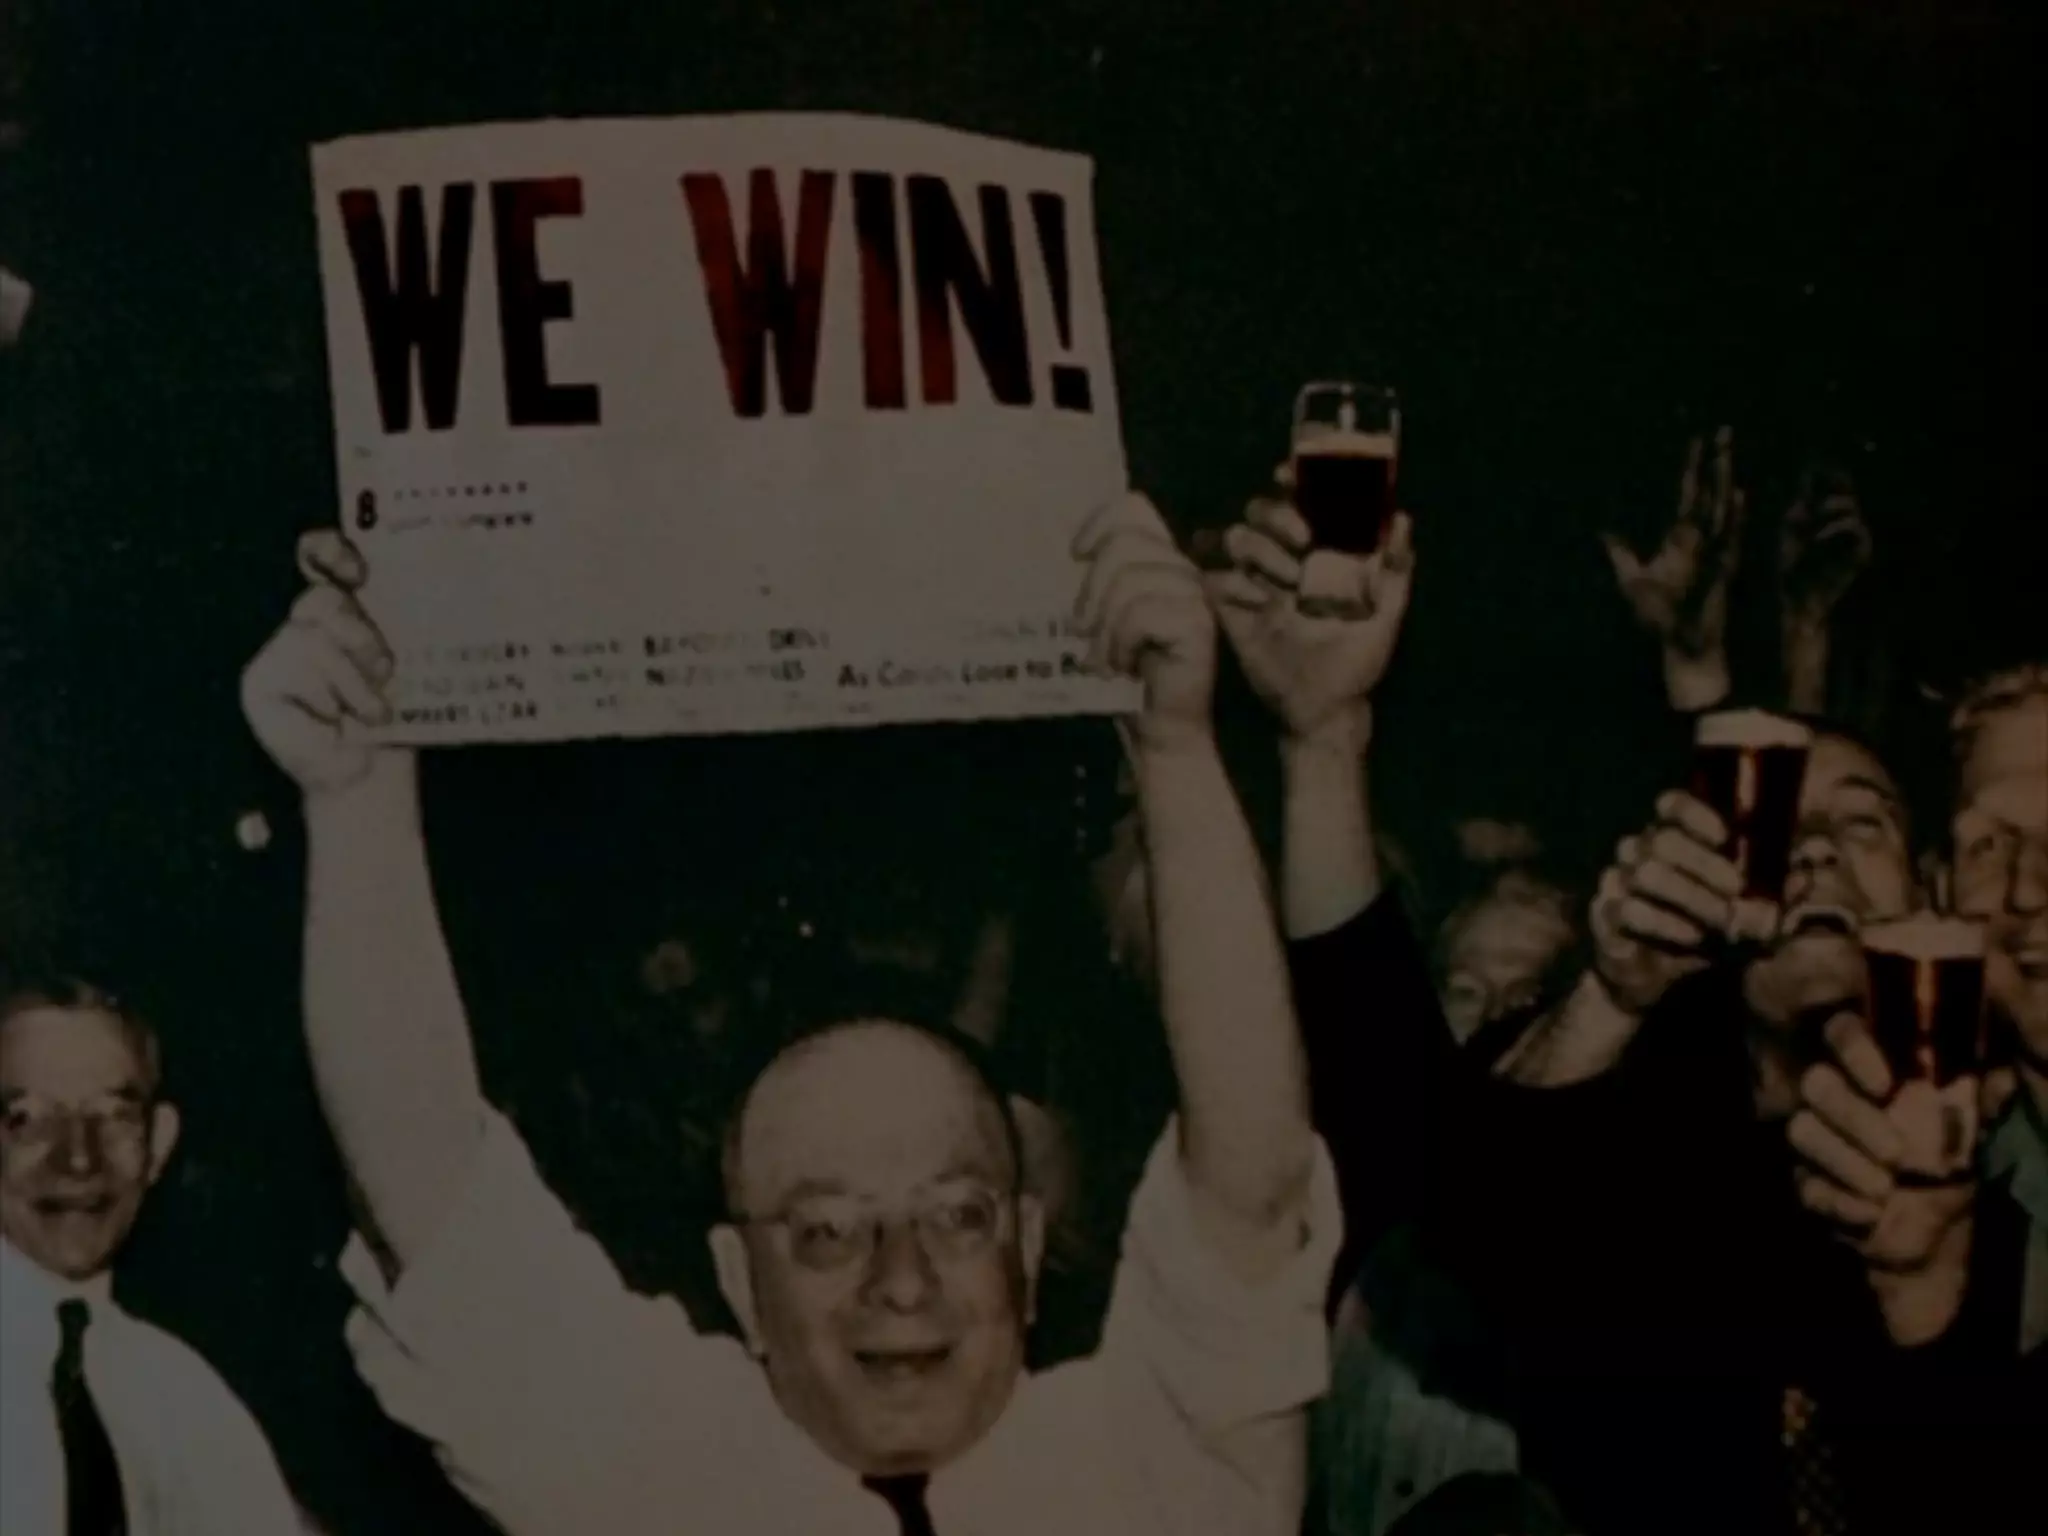
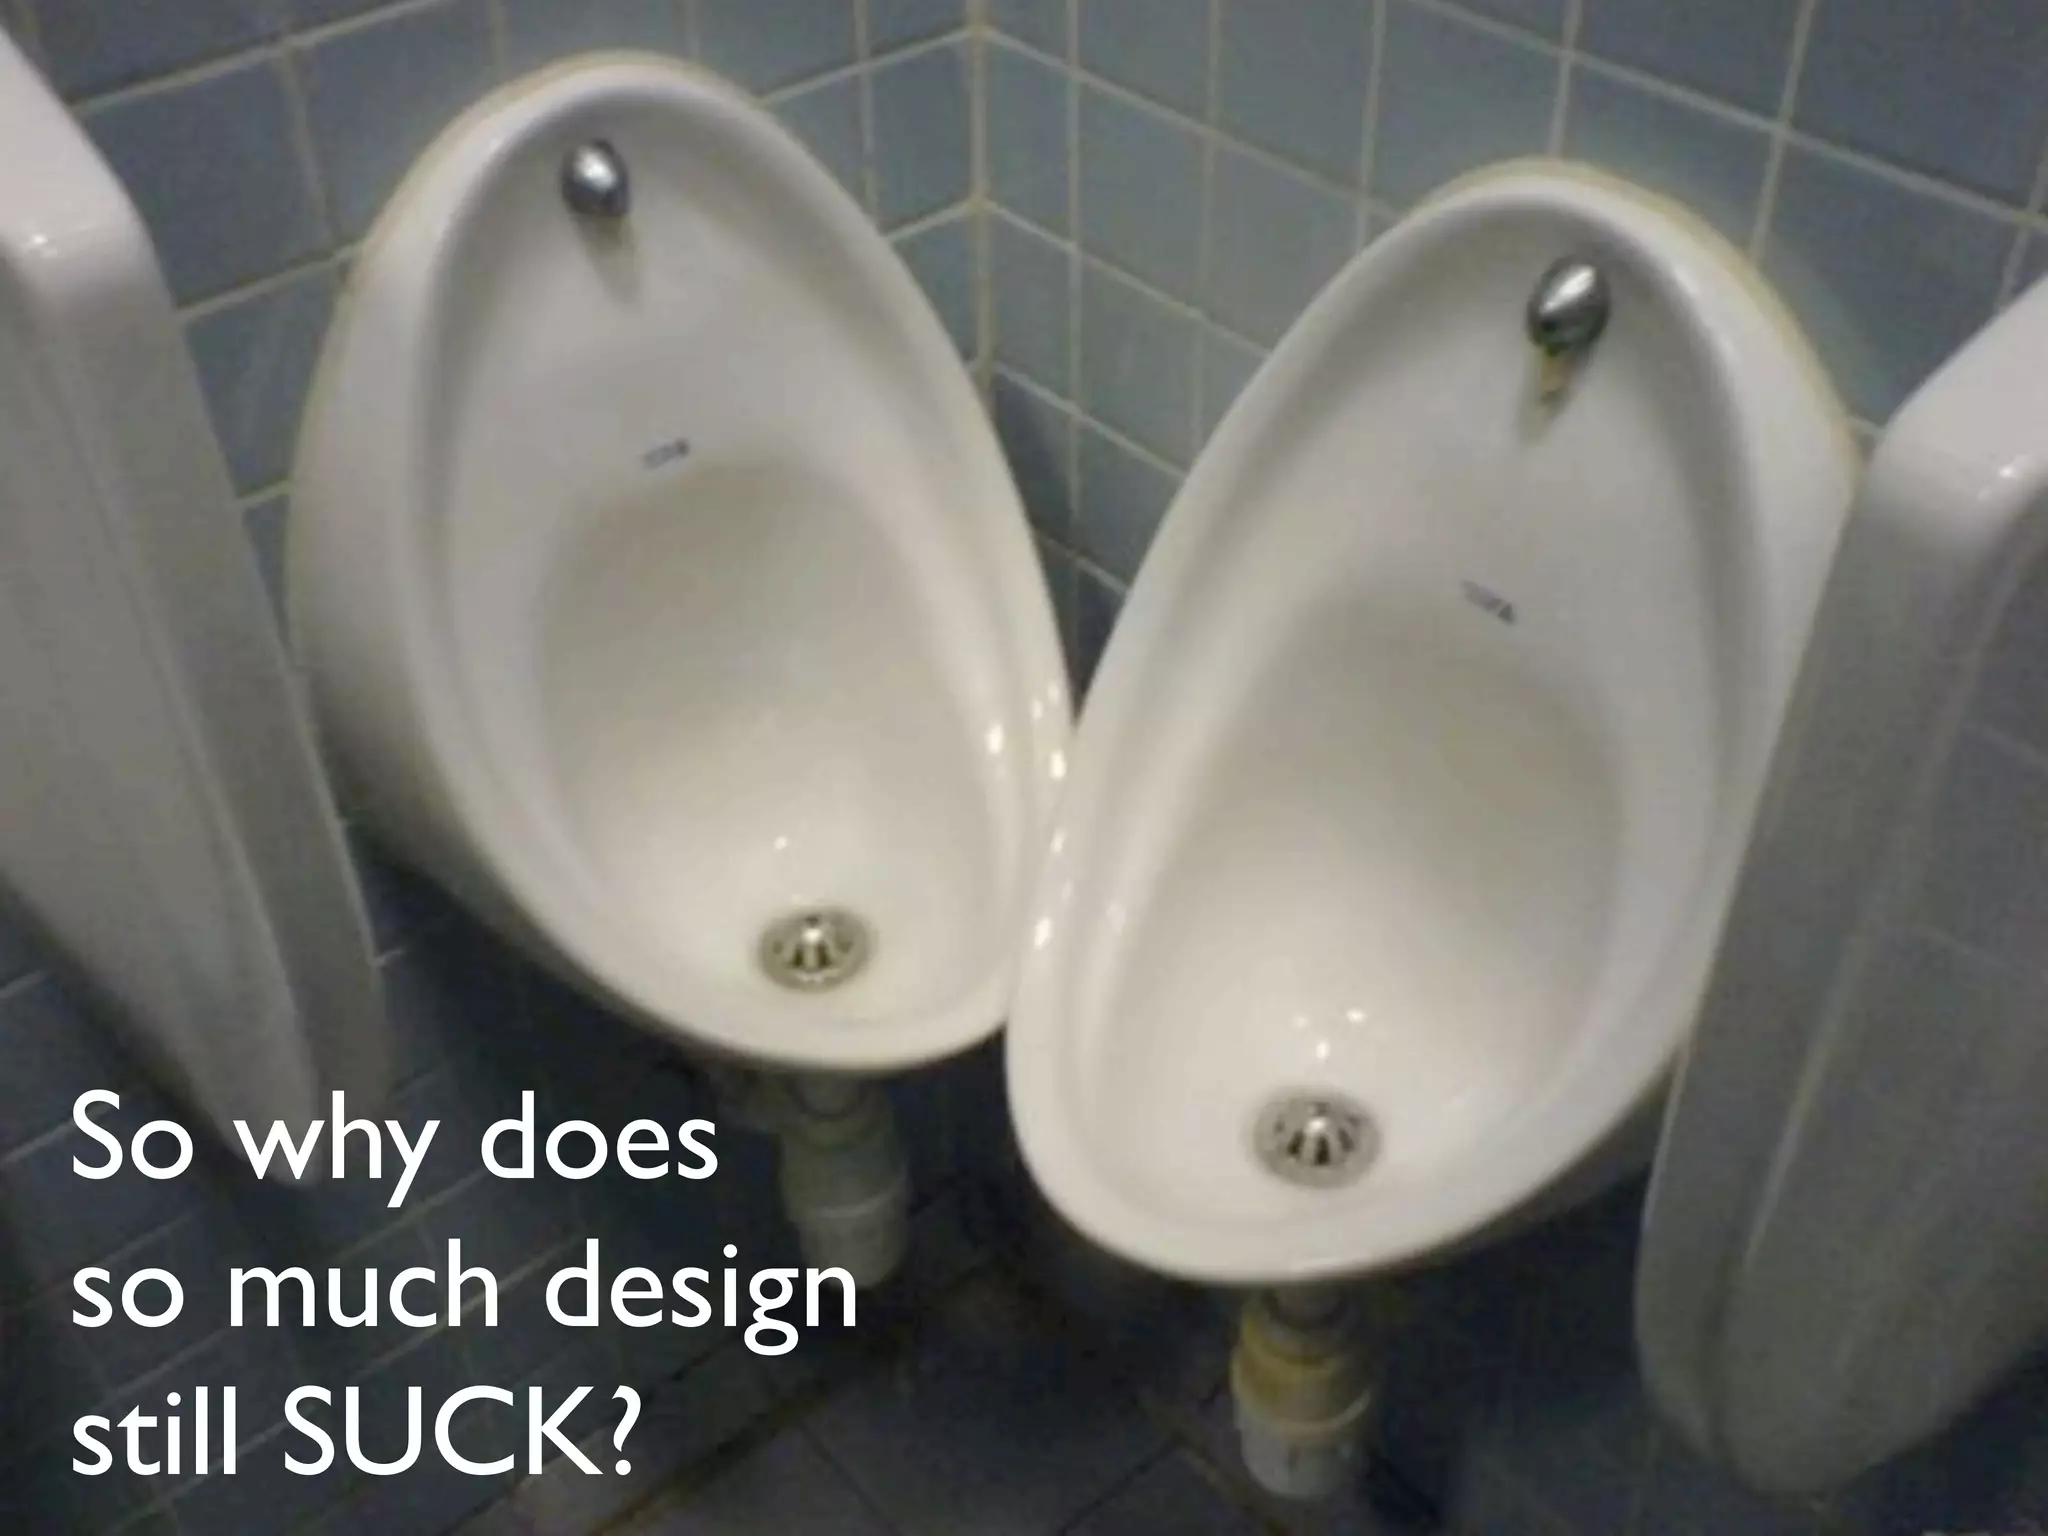
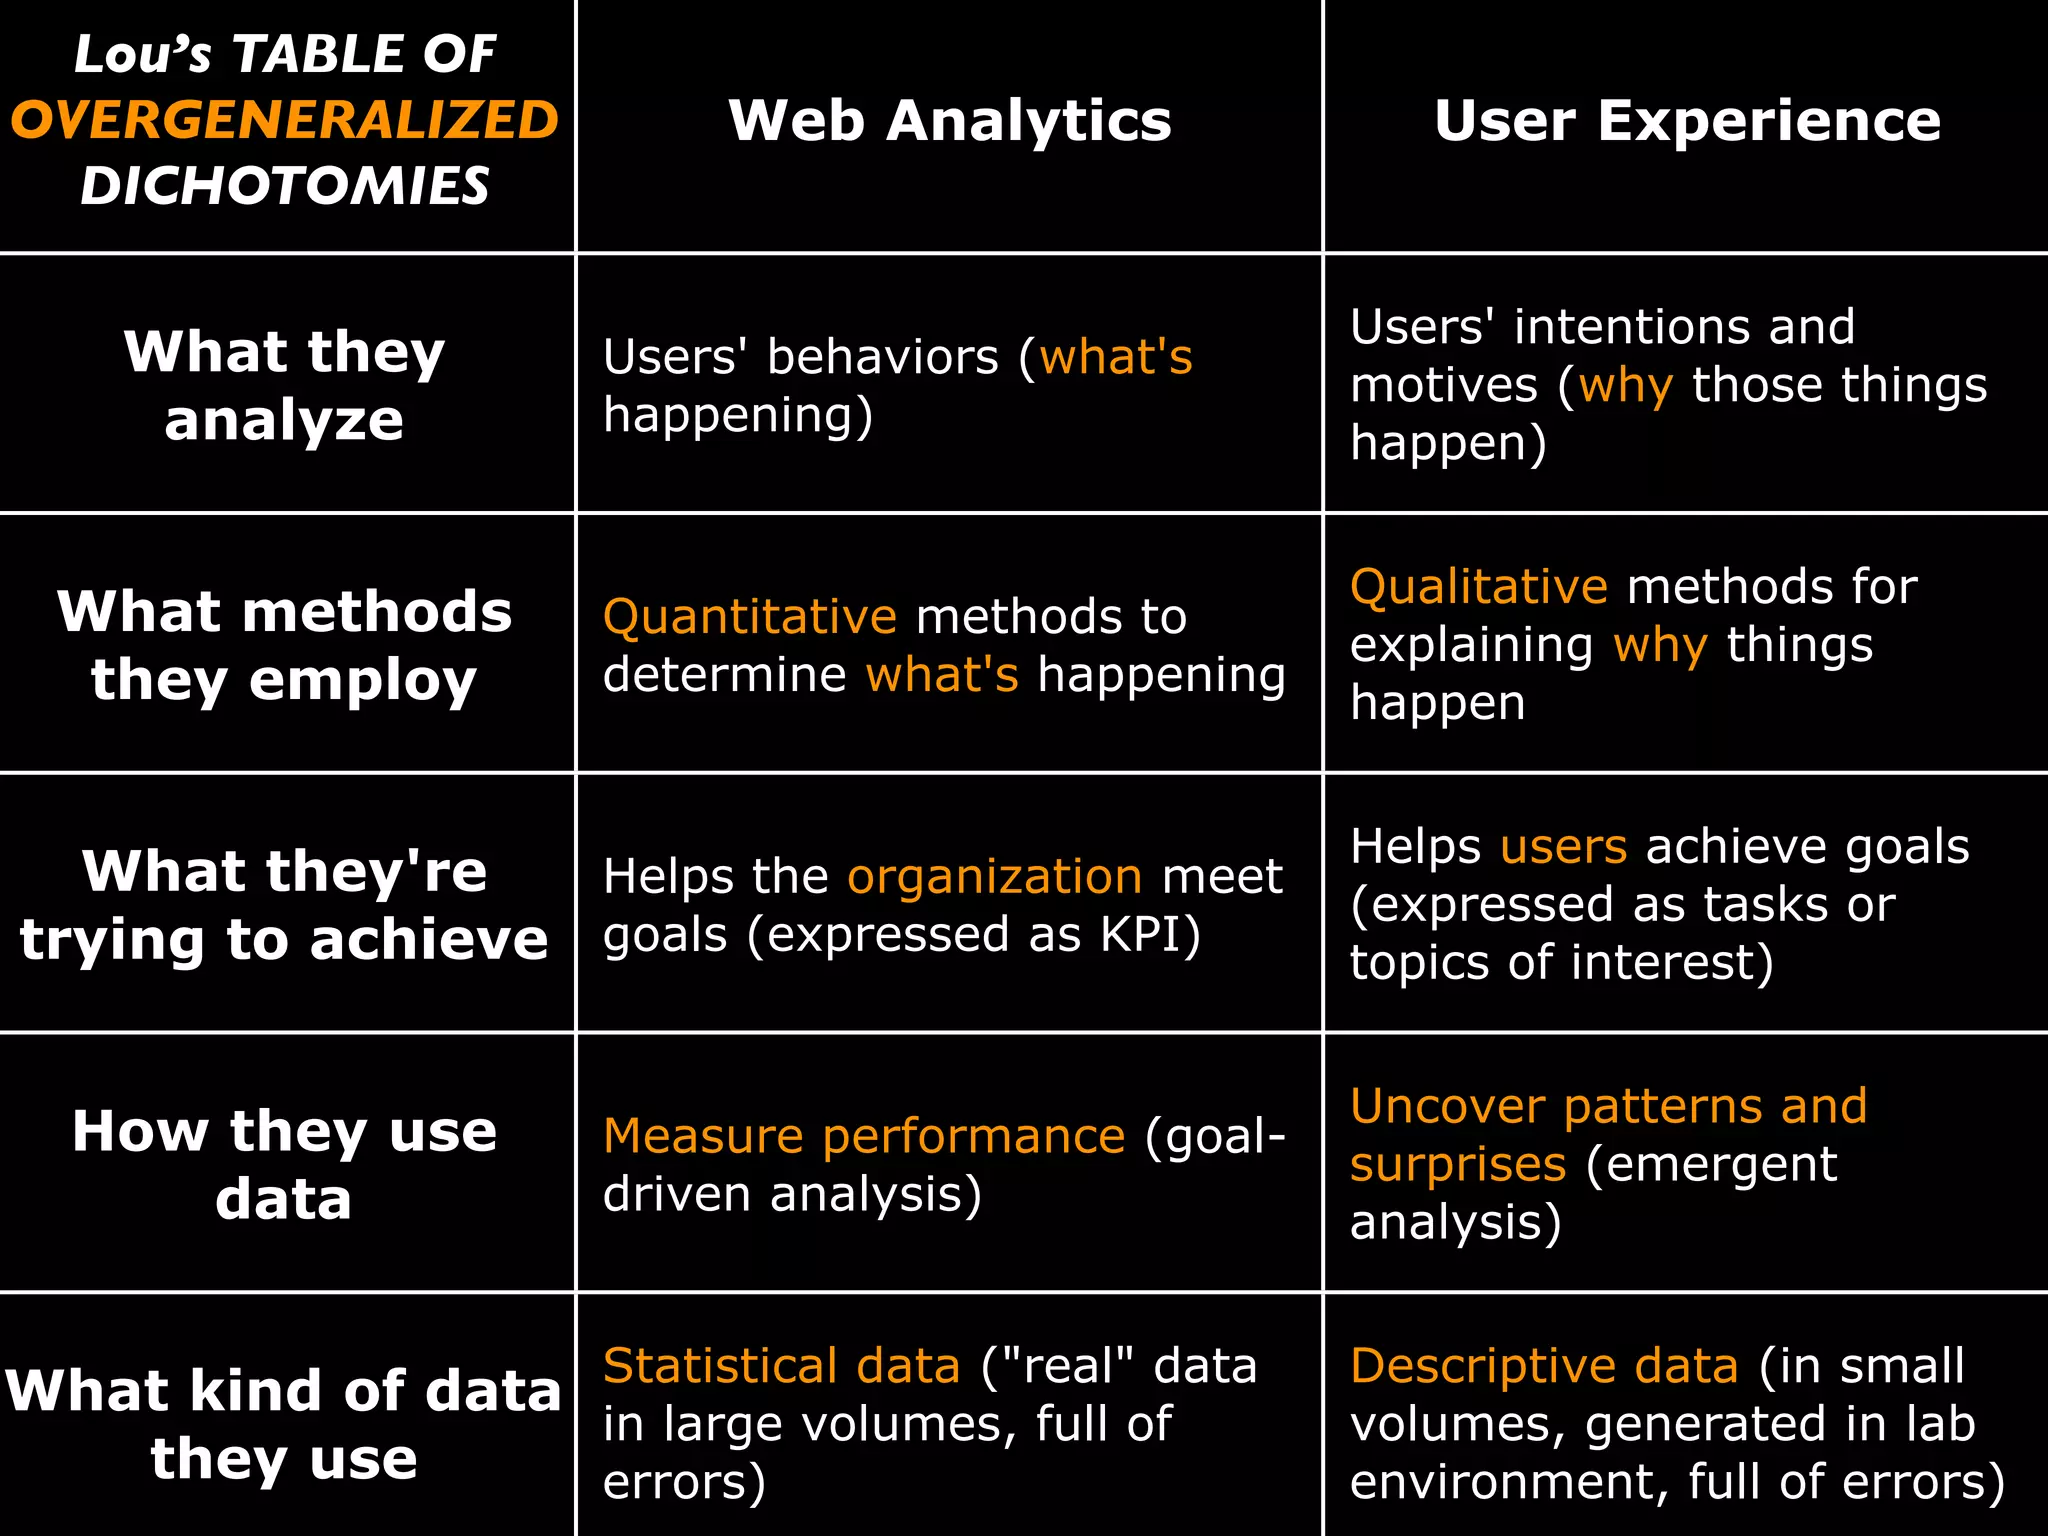
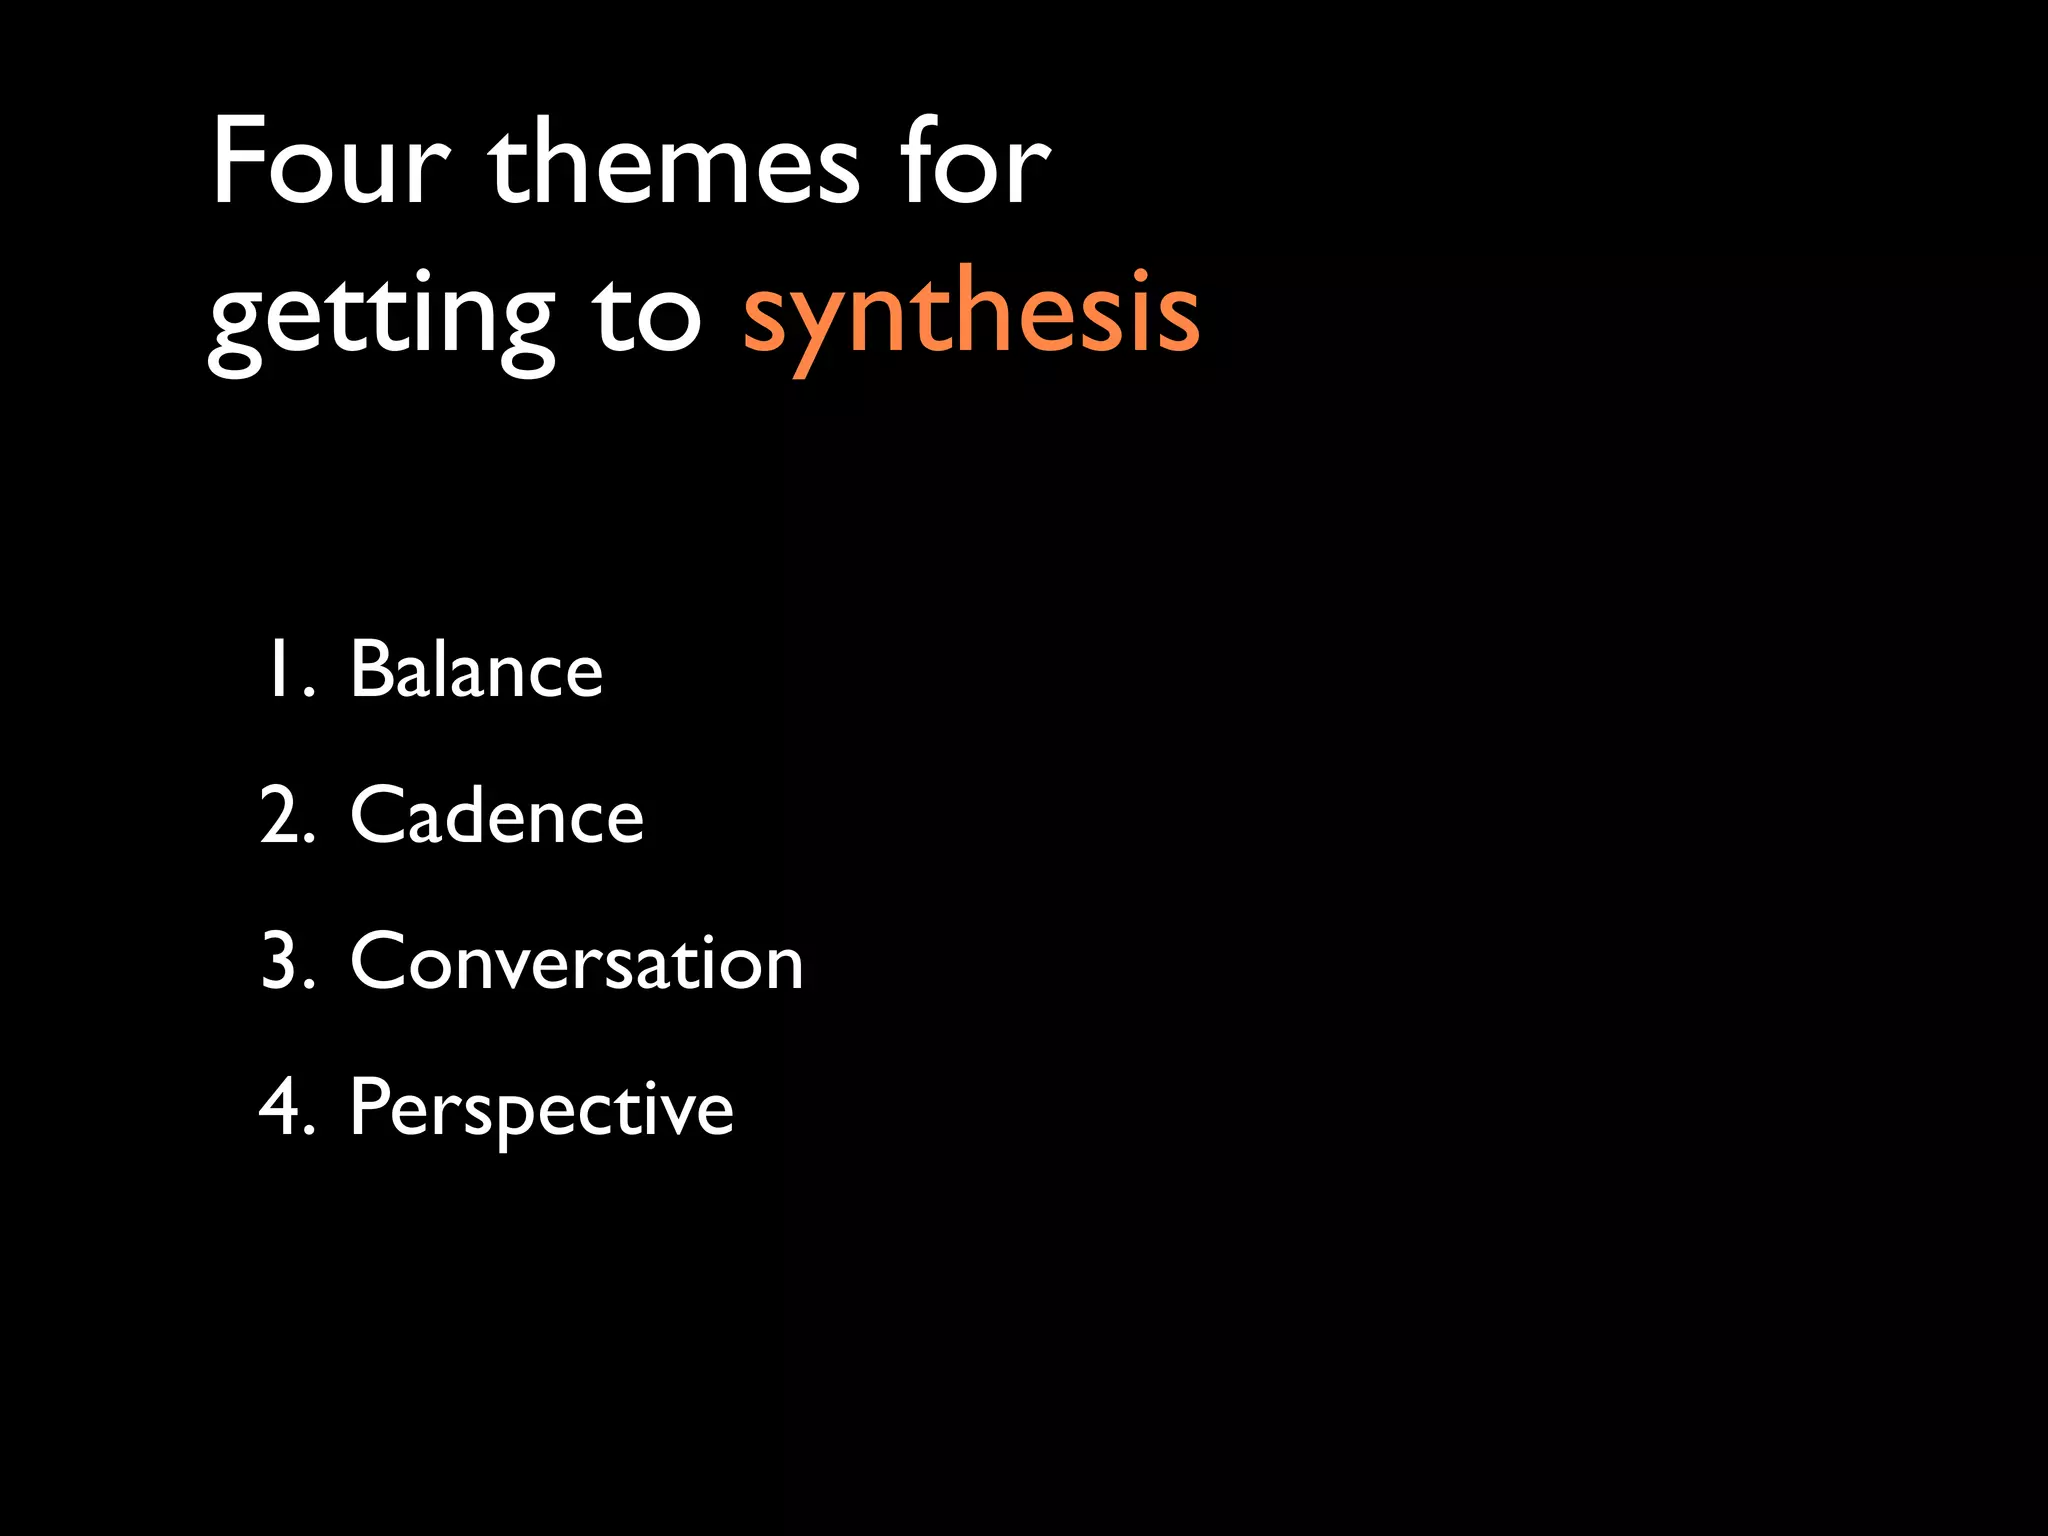
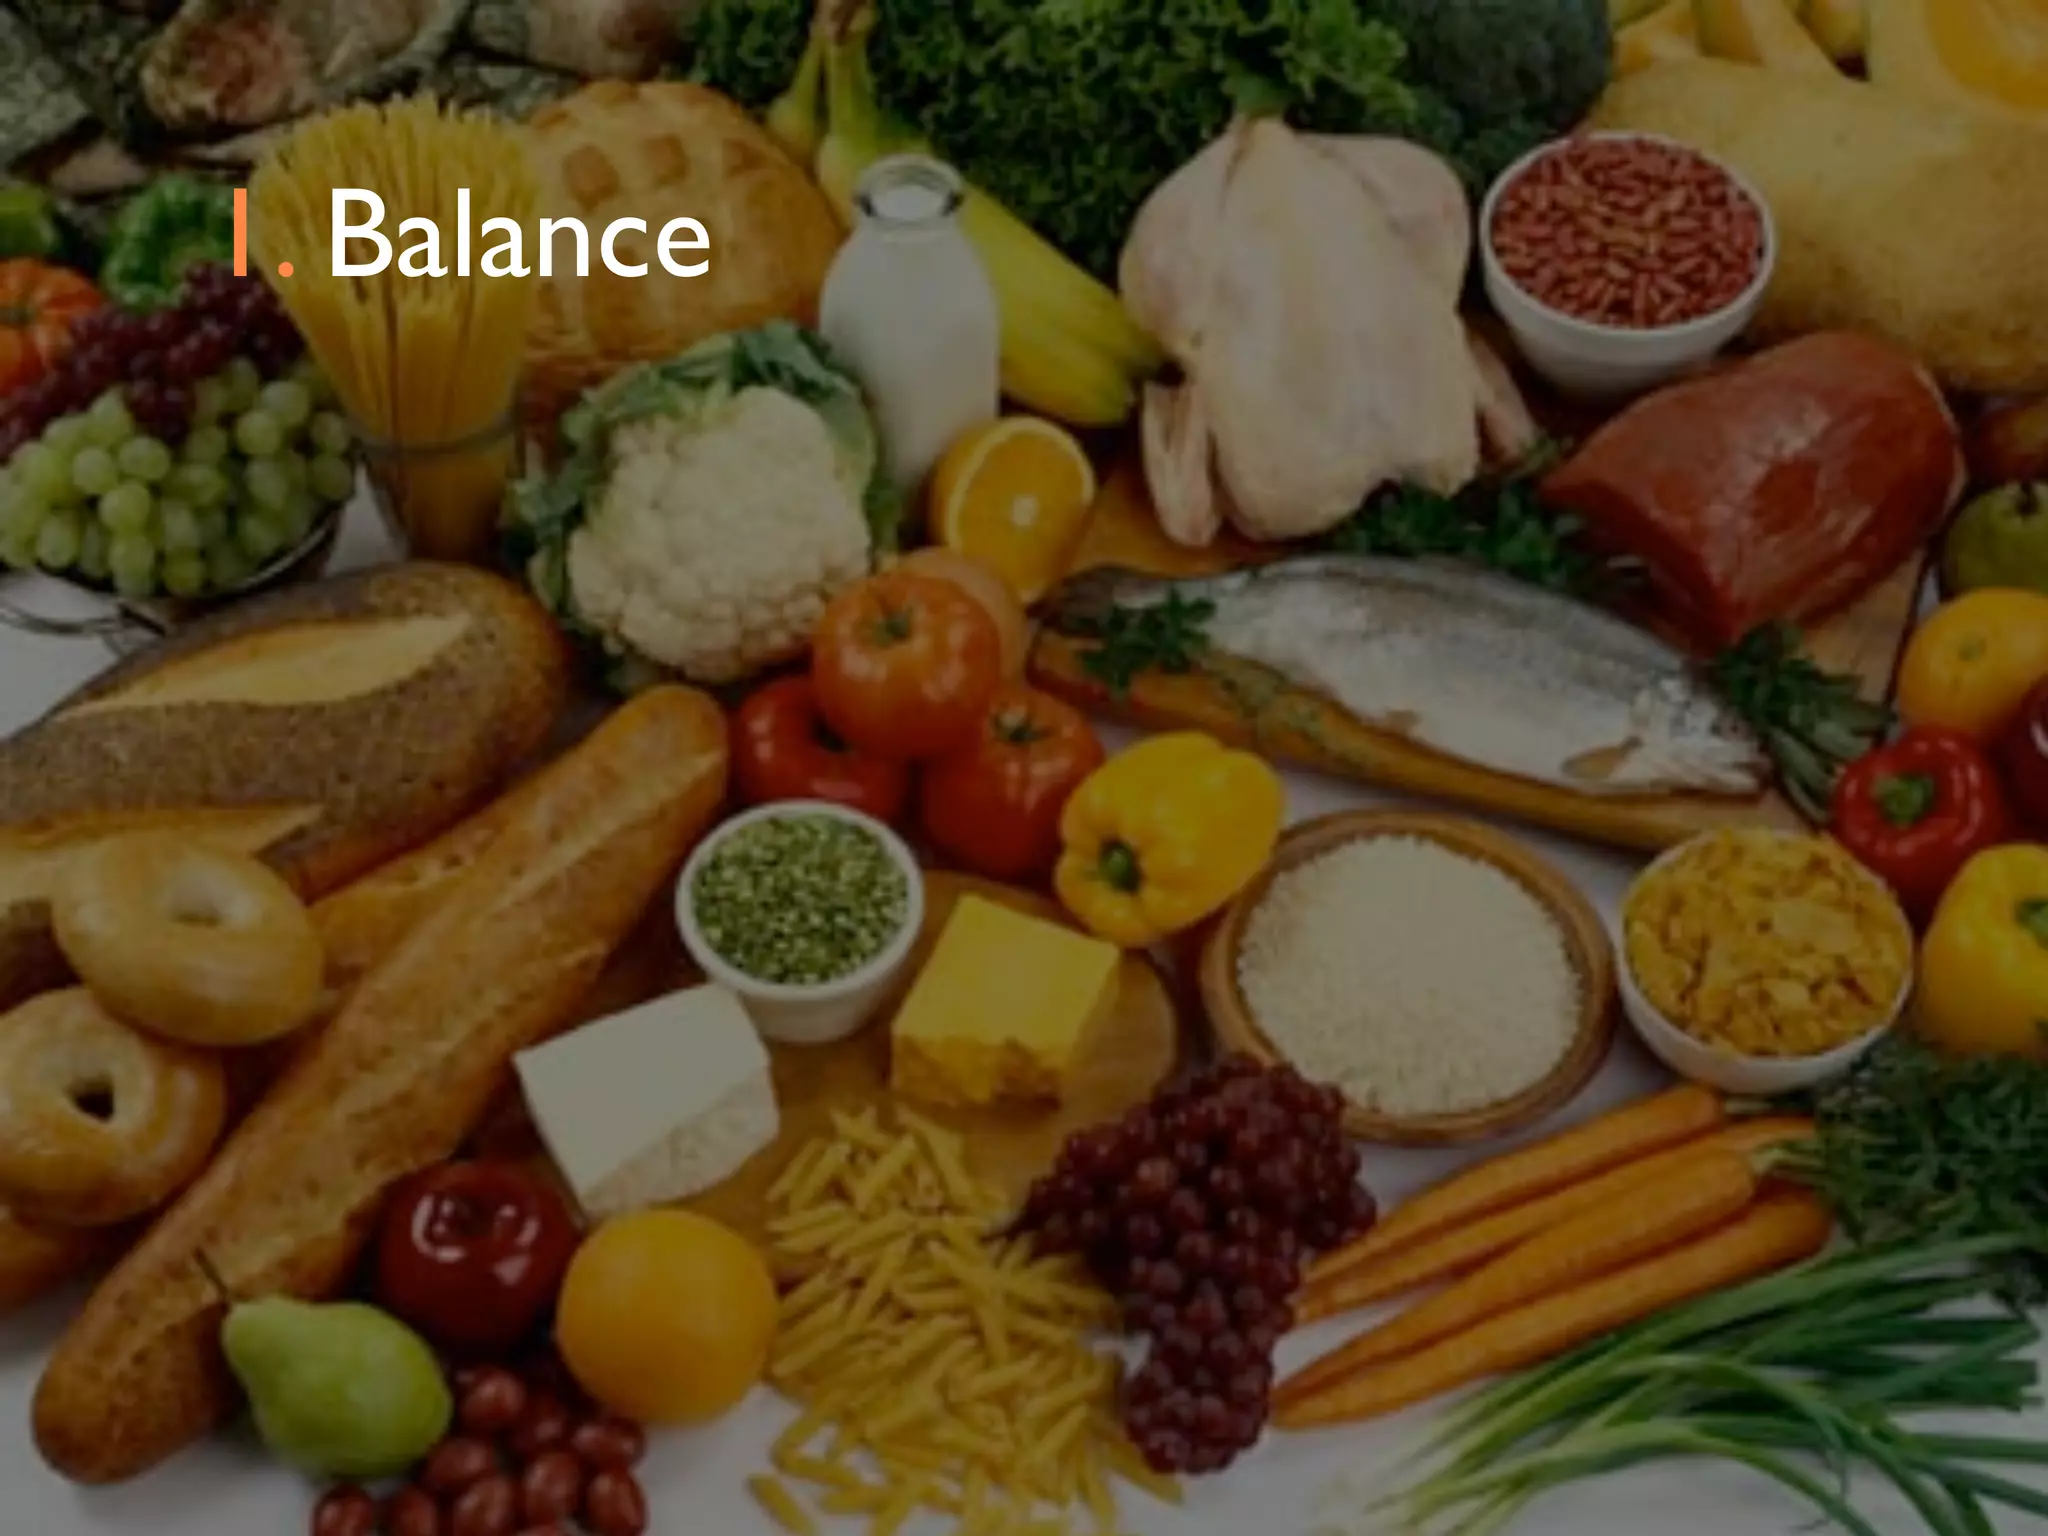
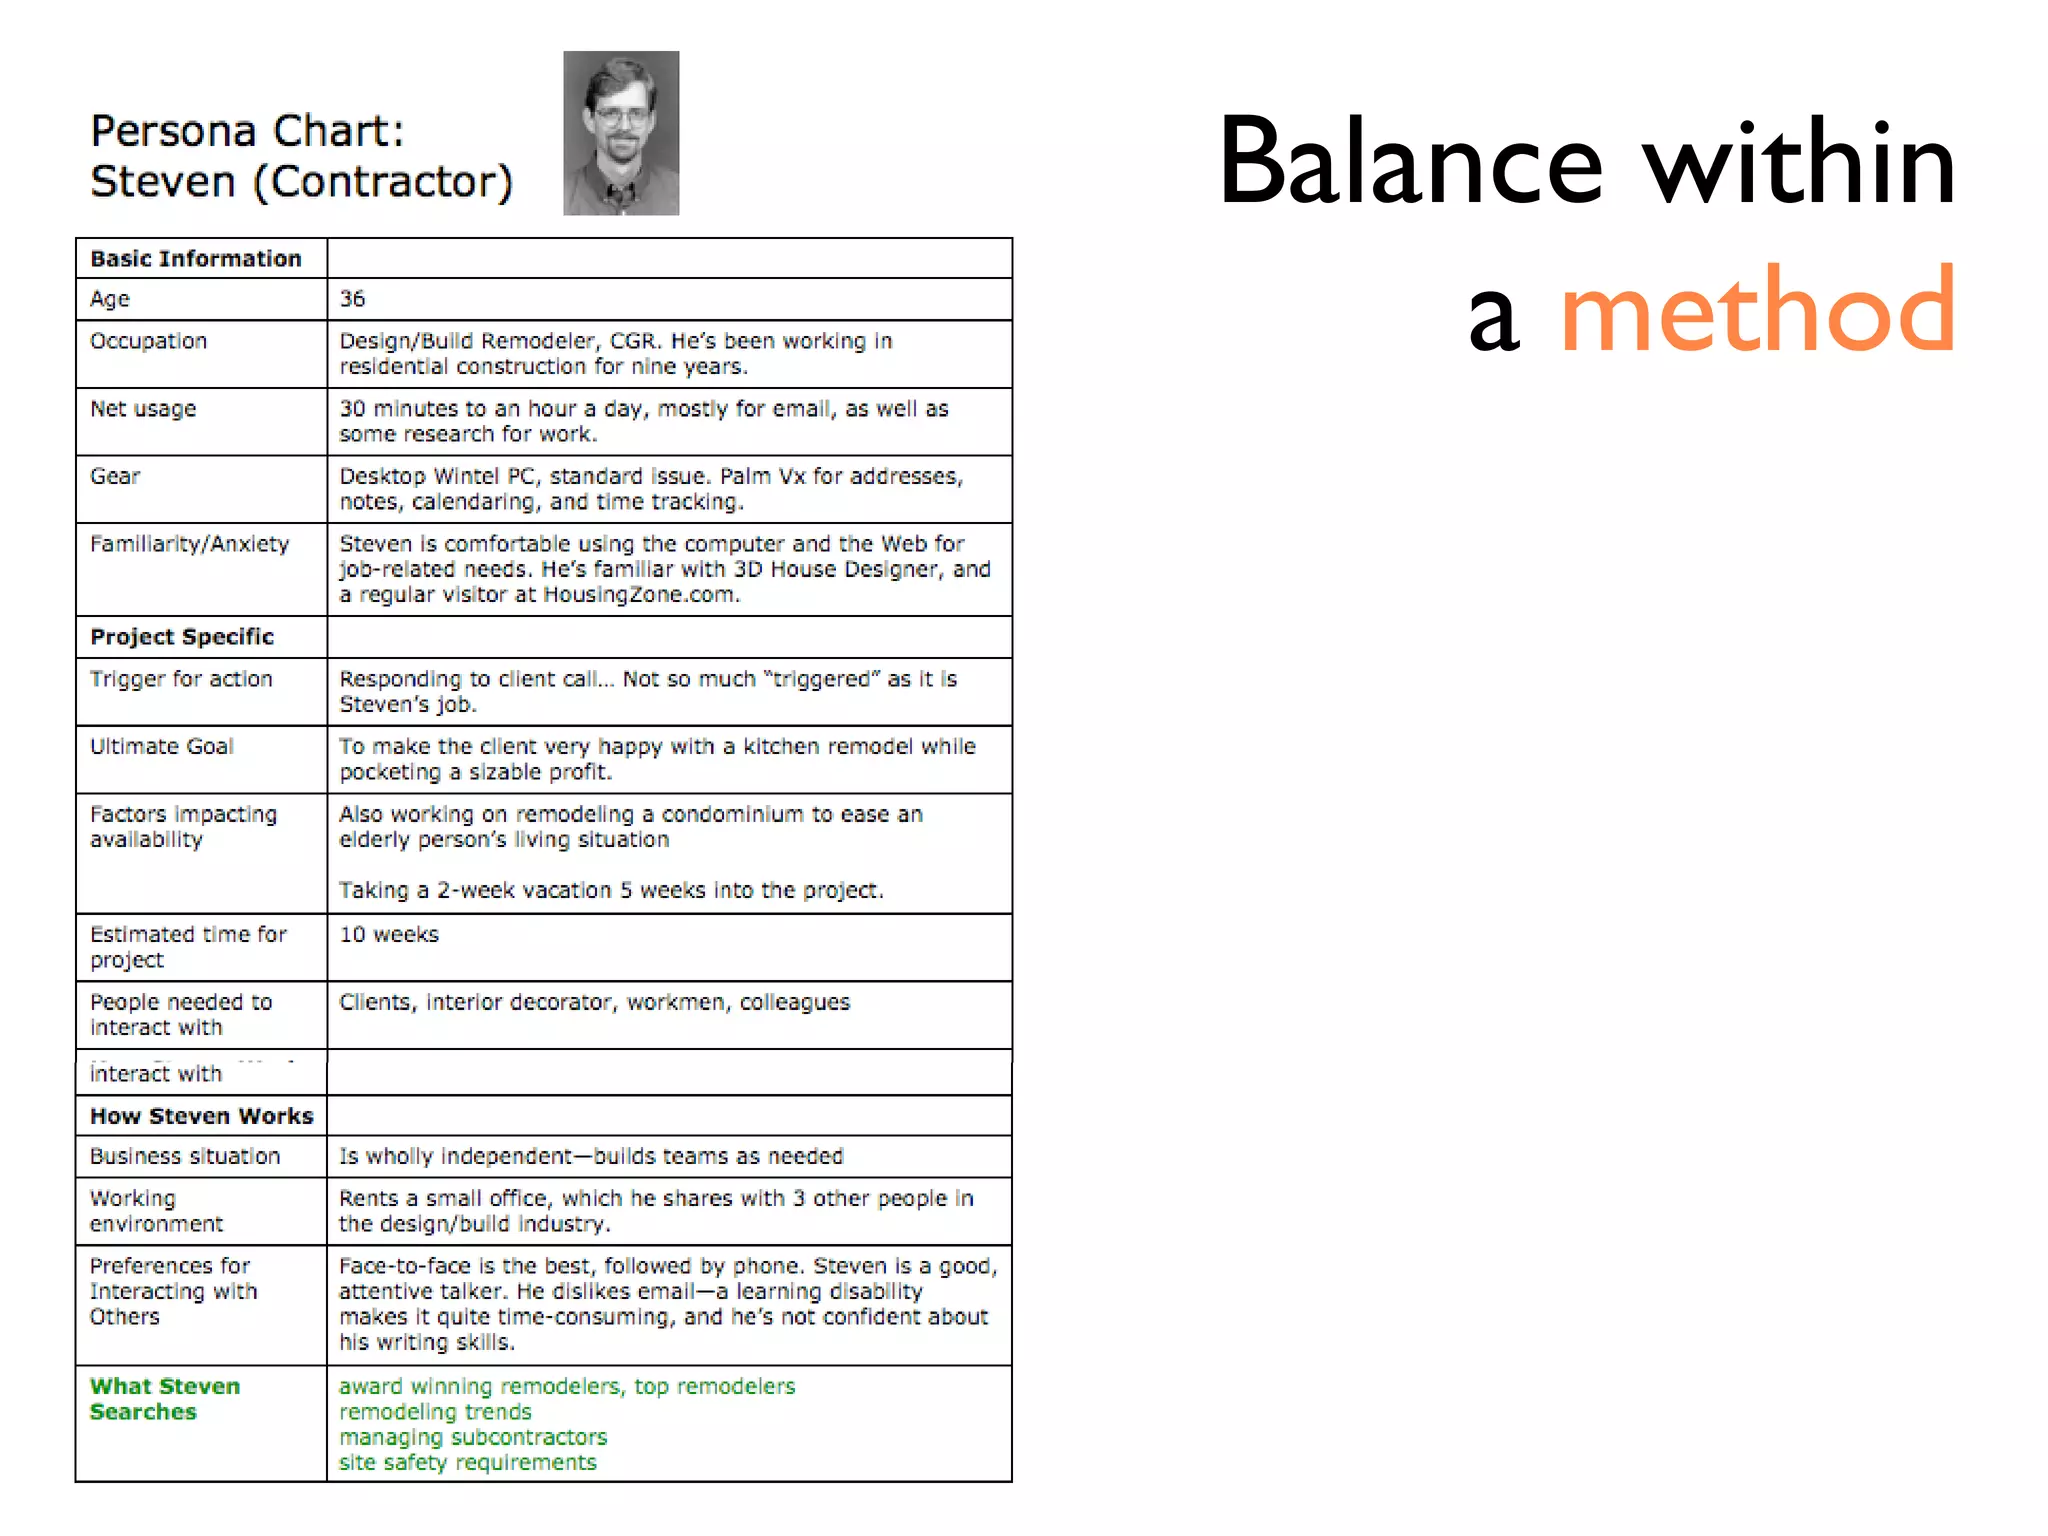
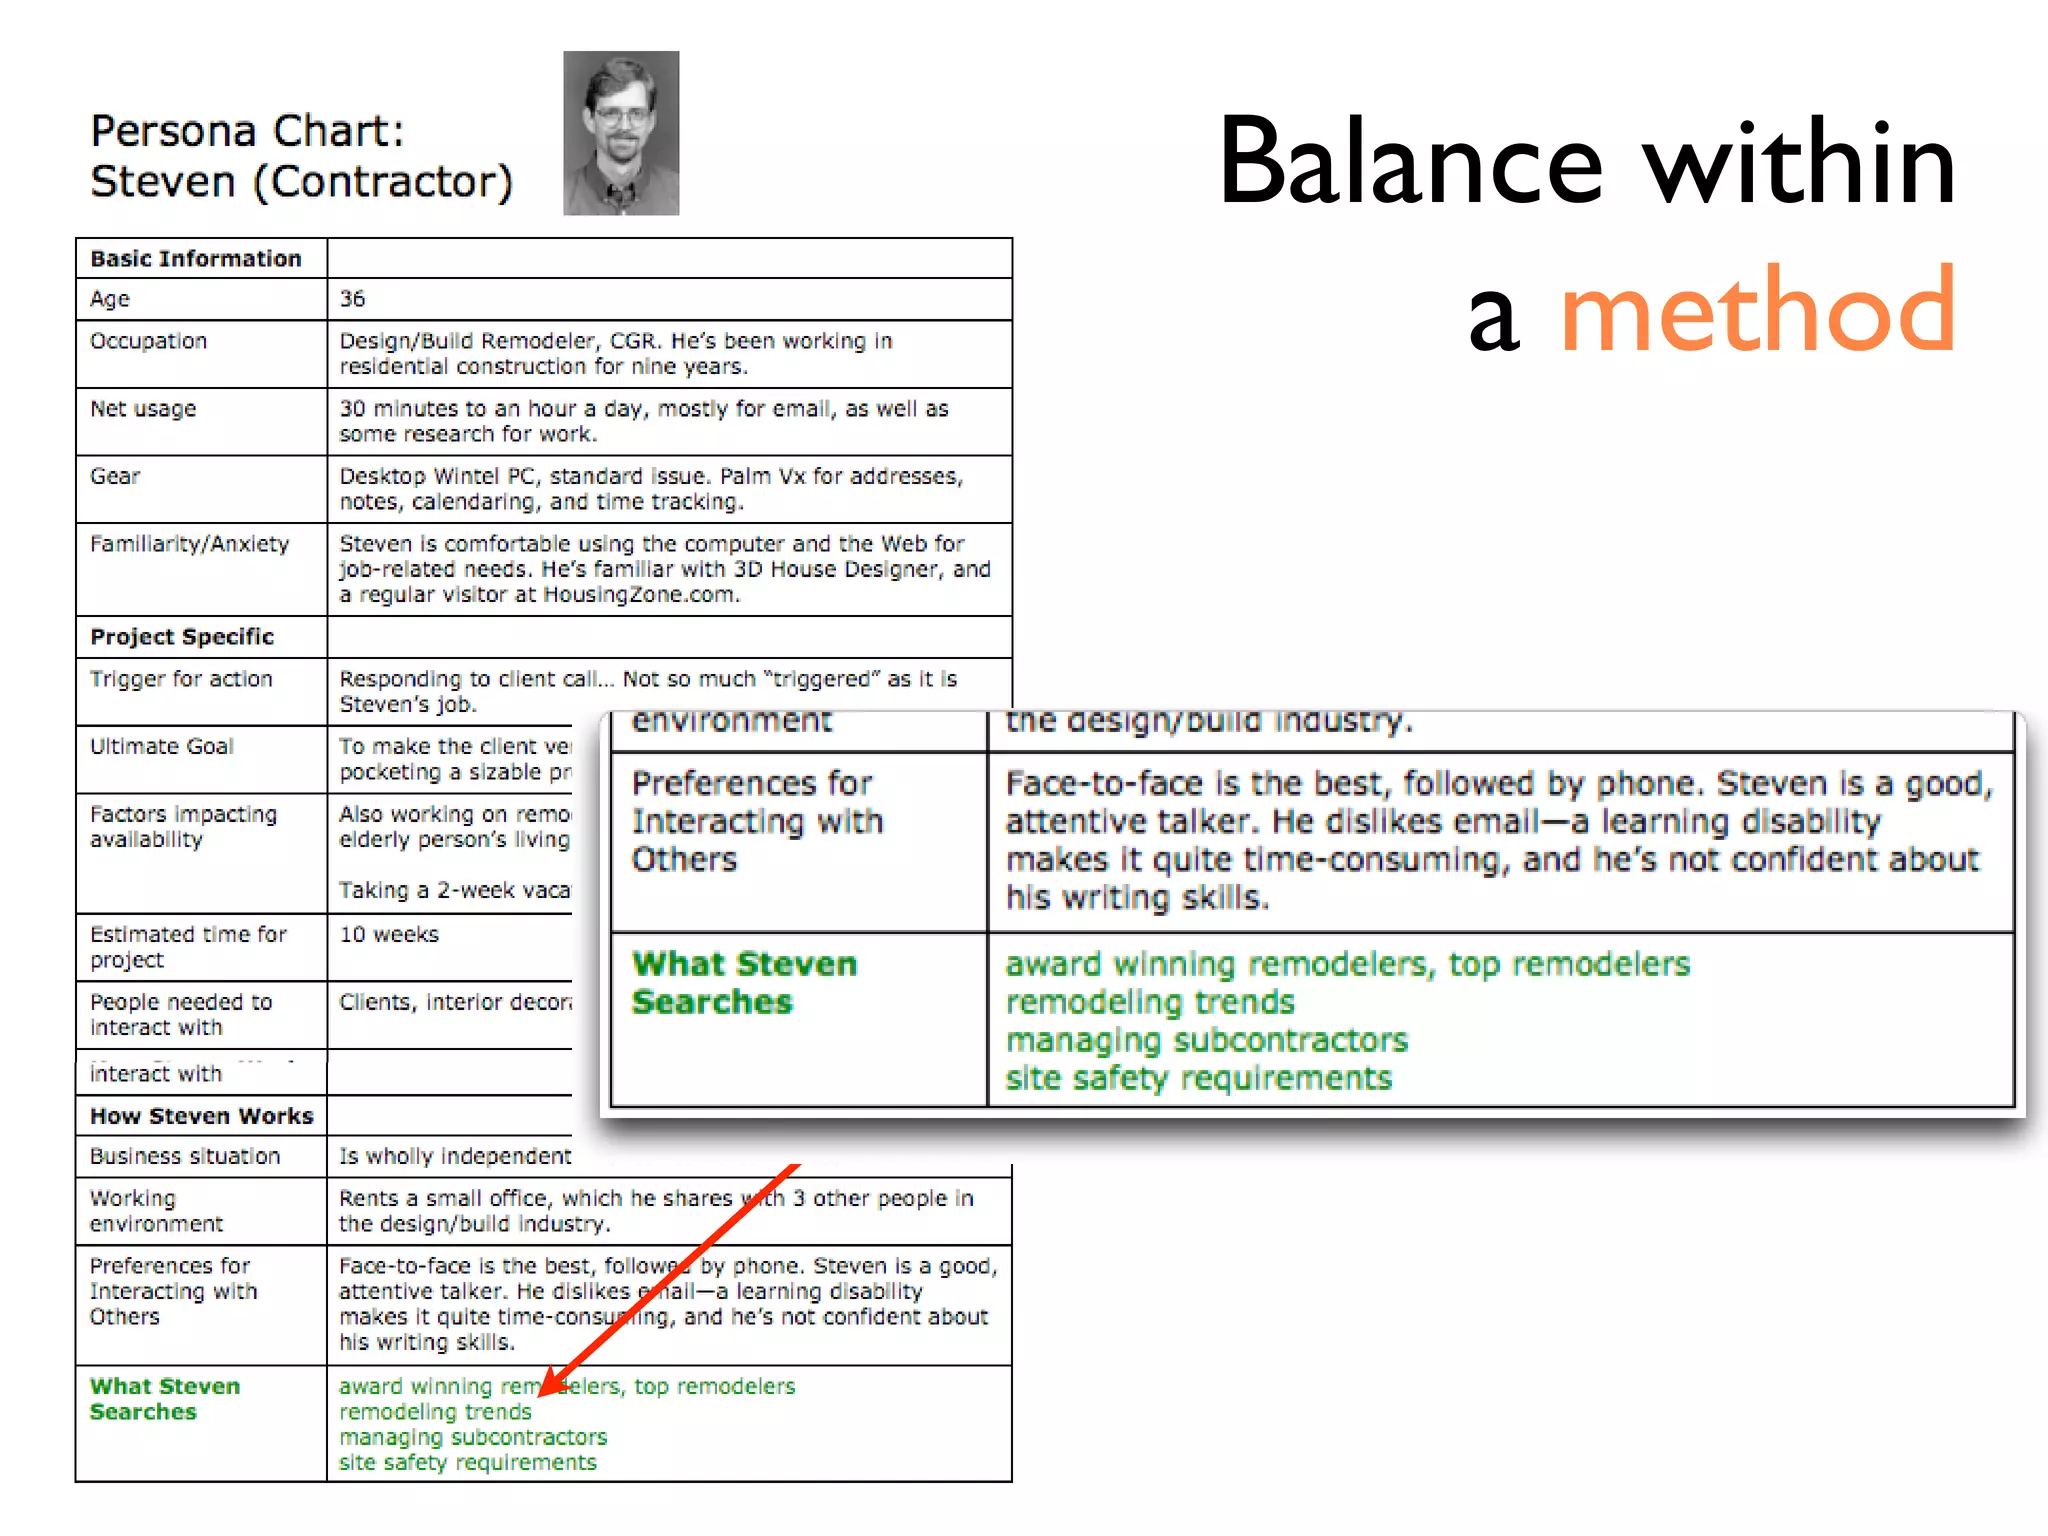
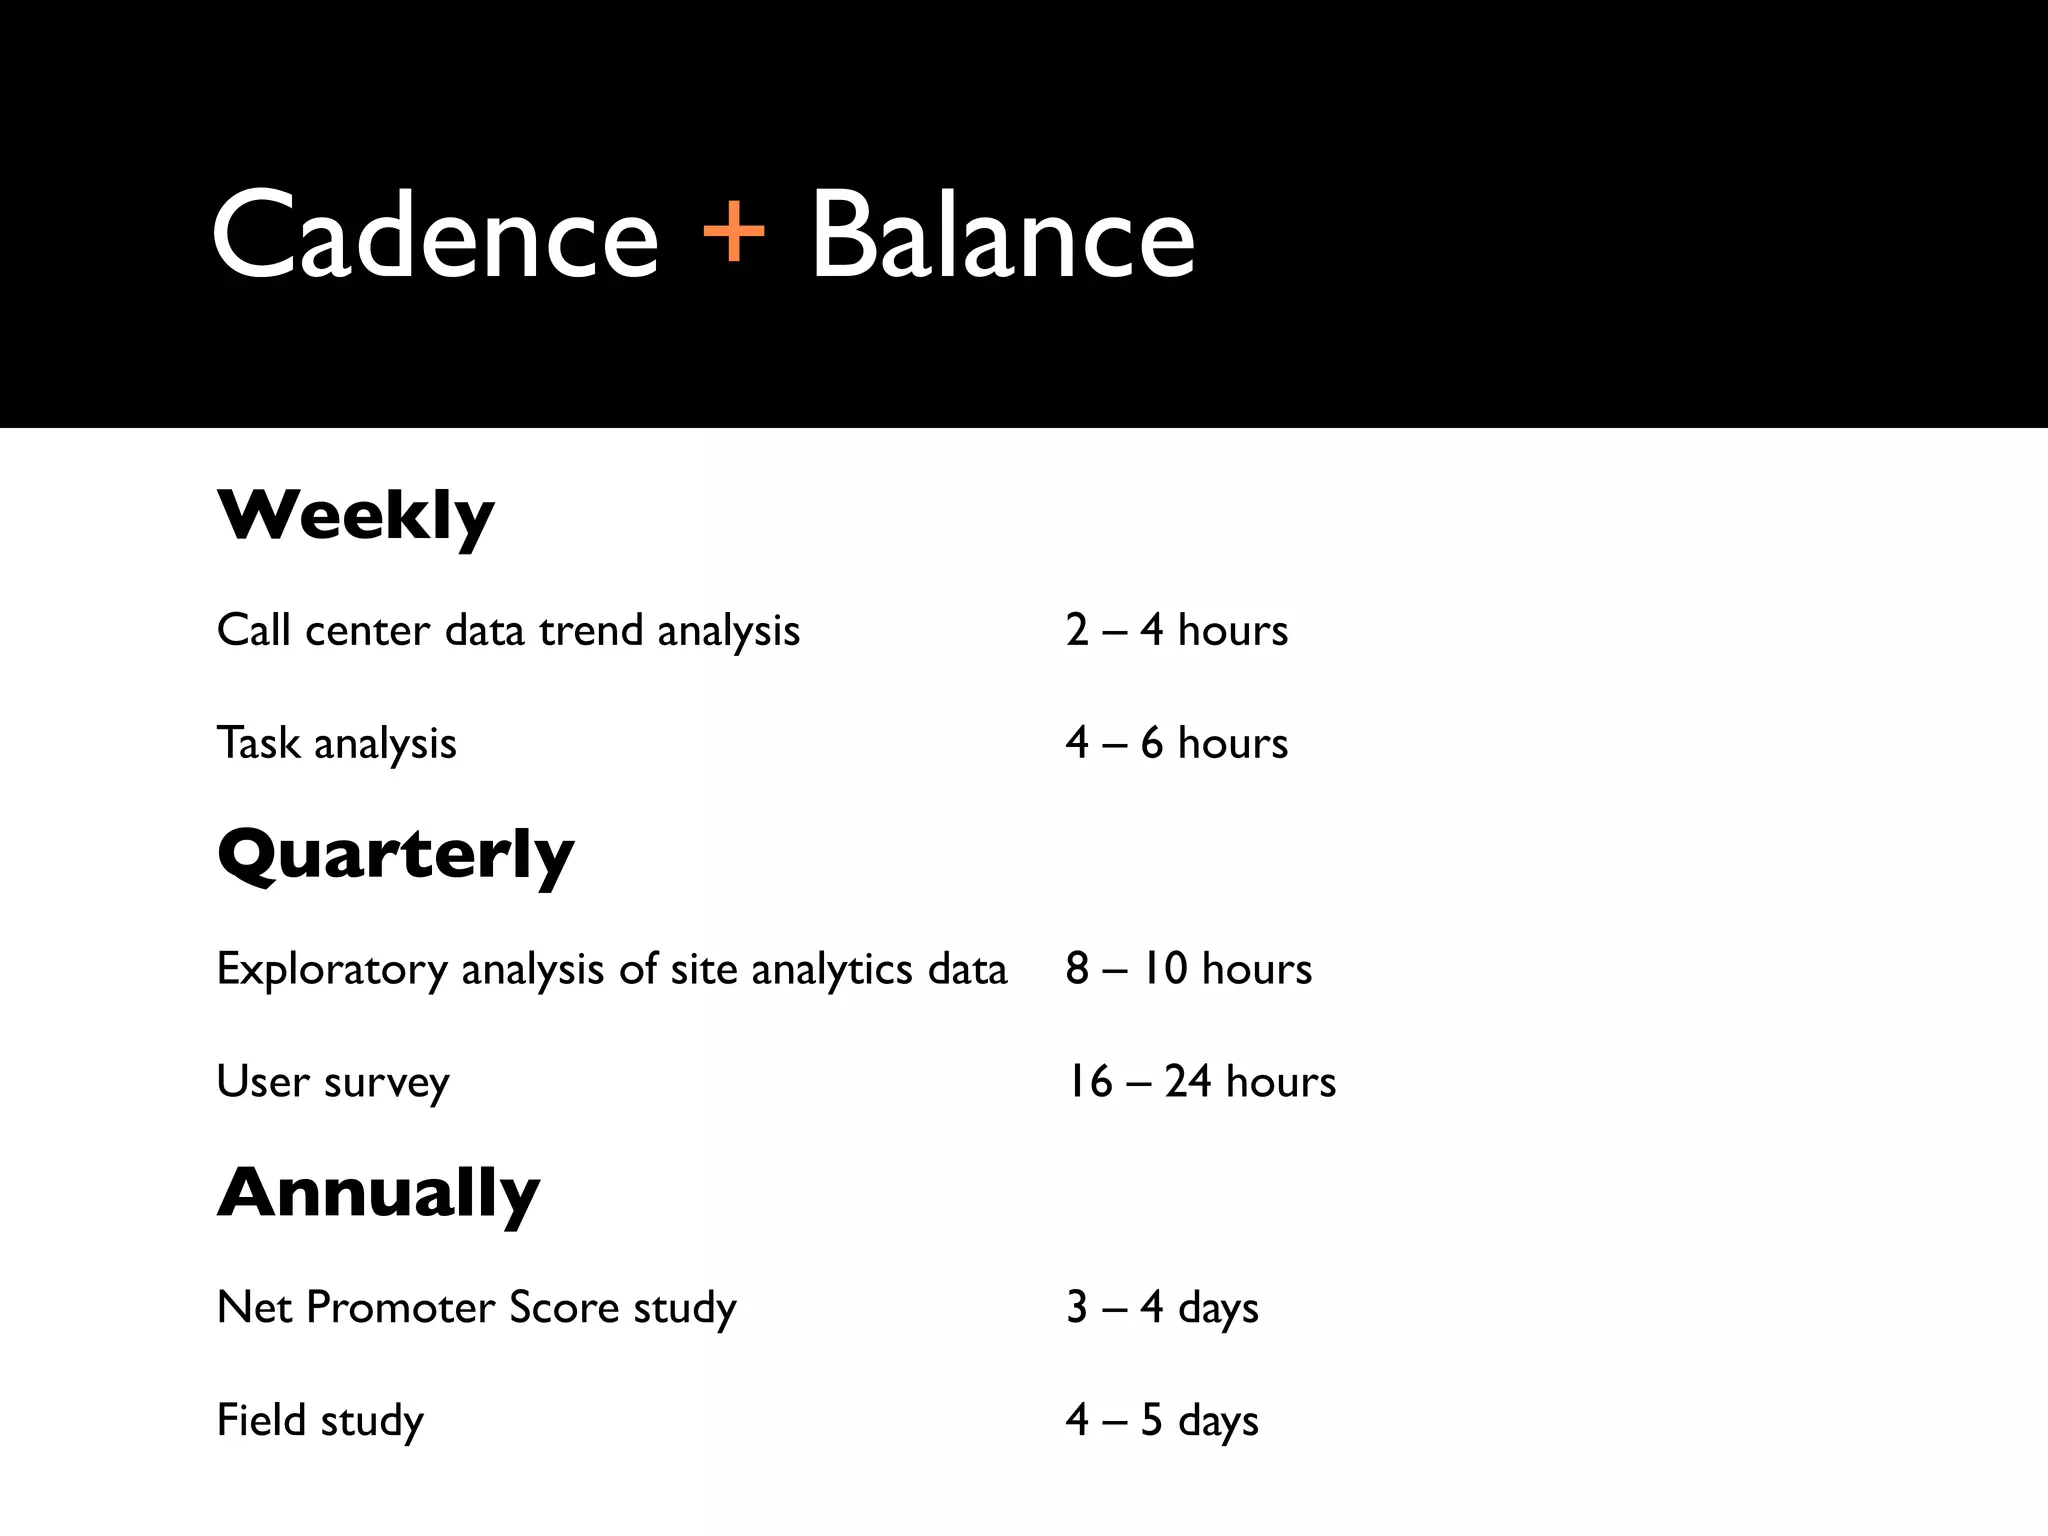
The document discusses the challenges and opportunities in user research within organizations, emphasizing the importance of both quantitative and qualitative methods to create effective user experiences. It presents five themes for achieving synthesis and insight: balance, cadence, conversation, perspective, and operations. The talk ultimately questions whether information architecture is more focused on operations to enhance insights.


![iStat Menus 7.20 Crack for MacOS 2026 Full Version [Latest] pptx](https://cdn.slidesharecdn.com/ss_thumbnails/softwareoverview-251207191544-22b737dc-thumbnail.jpg?width=640&height=640&fit=bounds)


![WinRAR Crack 7.13 Final Mac Keygen 2026 Download [Latest] Software.pptx](https://cdn.slidesharecdn.com/ss_thumbnails/software-251207185858-eb450678-thumbnail.jpg?width=640&height=640&fit=bounds)


![Soundtoys Mac v5.5.5.0 Crack for MacOS Full Version [Latest] pptx](https://cdn.slidesharecdn.com/ss_thumbnails/softwareoverview-251207193711-91d8ae6b-thumbnail.jpg?width=640&height=640&fit=bounds)

![CleanMyMac X v5.2.8 Crack for MacOS Full Version [Latest] pptx](https://cdn.slidesharecdn.com/ss_thumbnails/softwareoverview-251207194121-a81f0142-thumbnail.jpg?width=640&height=640&fit=bounds)
