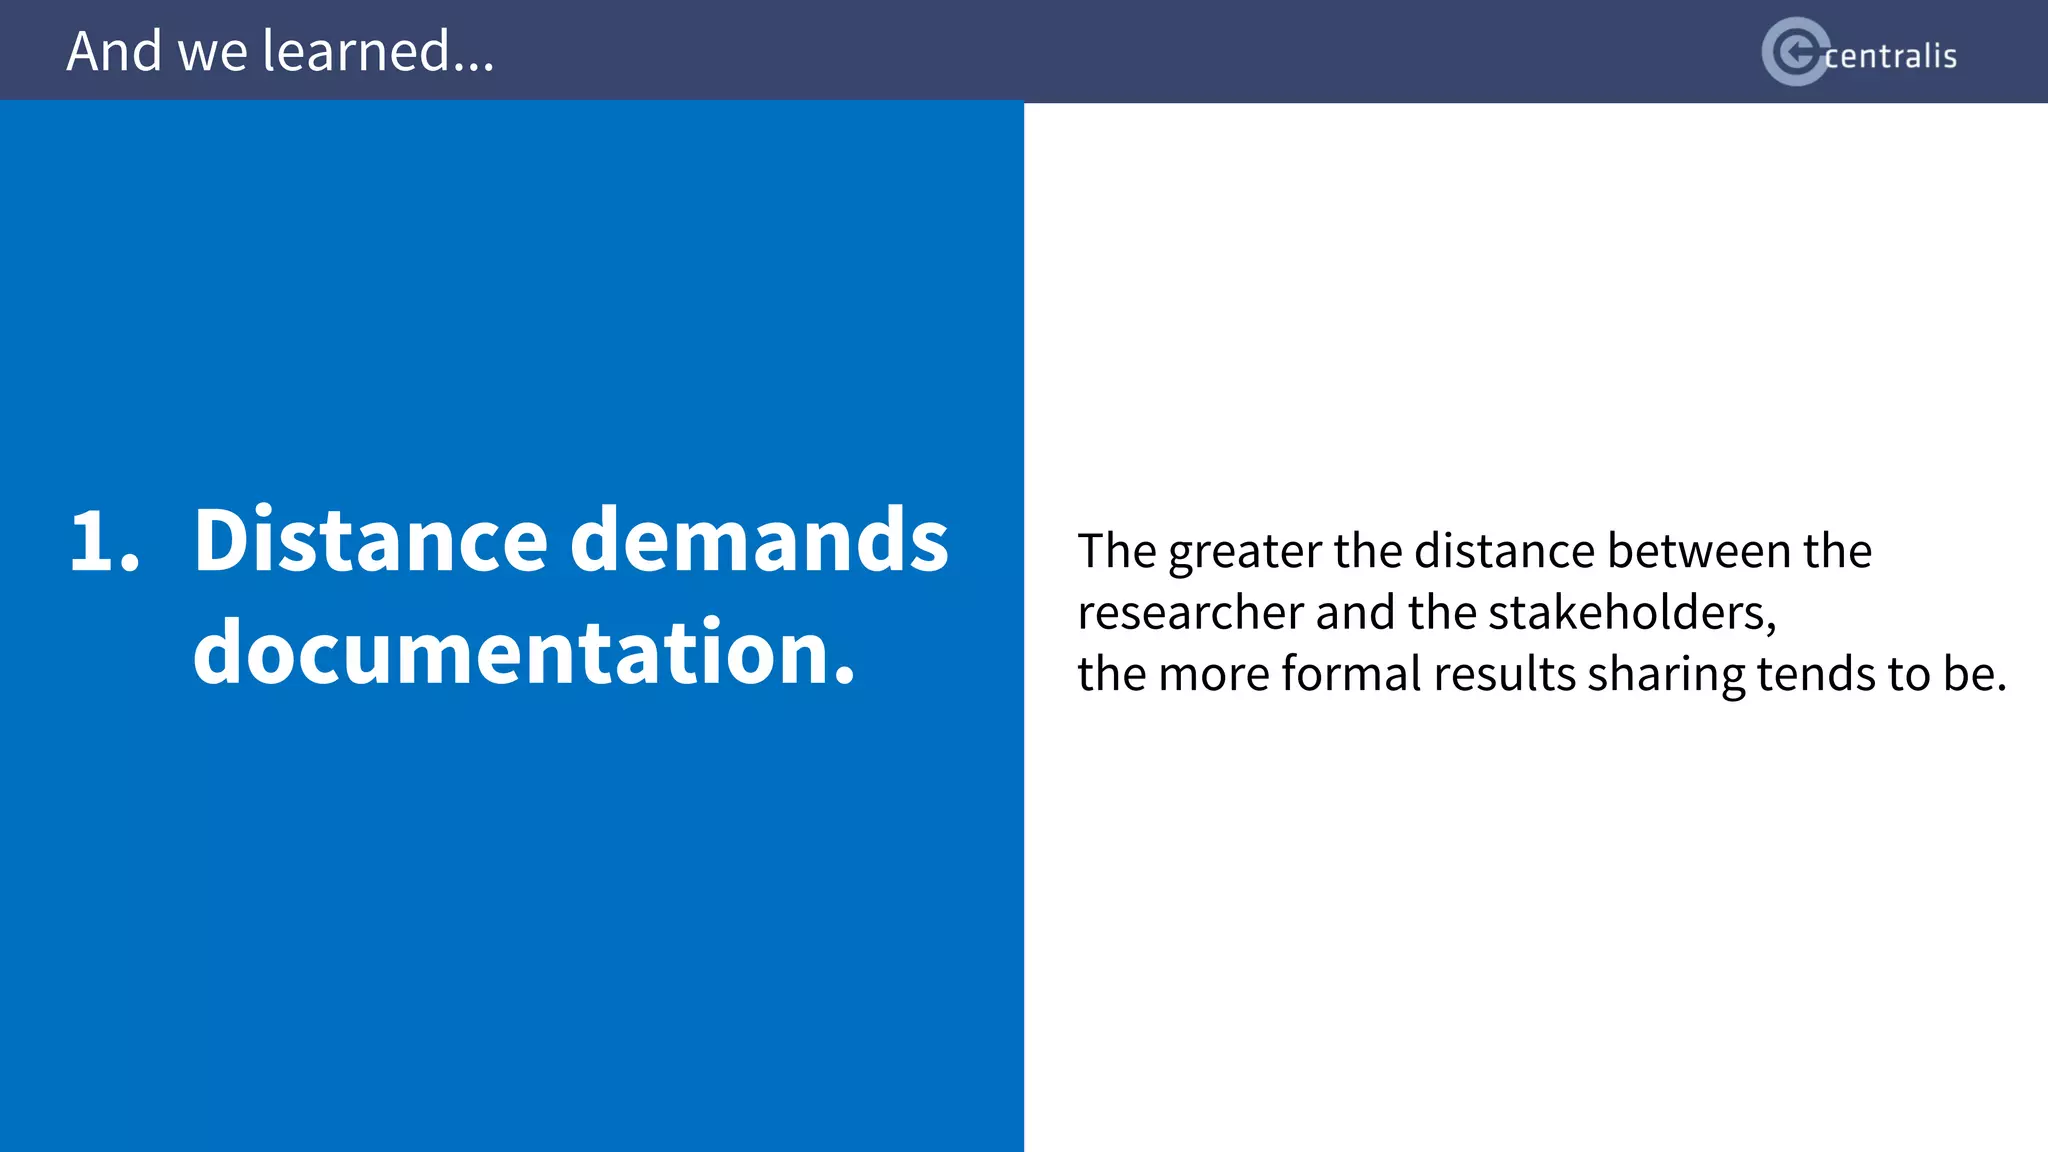
![Distance Demands Documentation
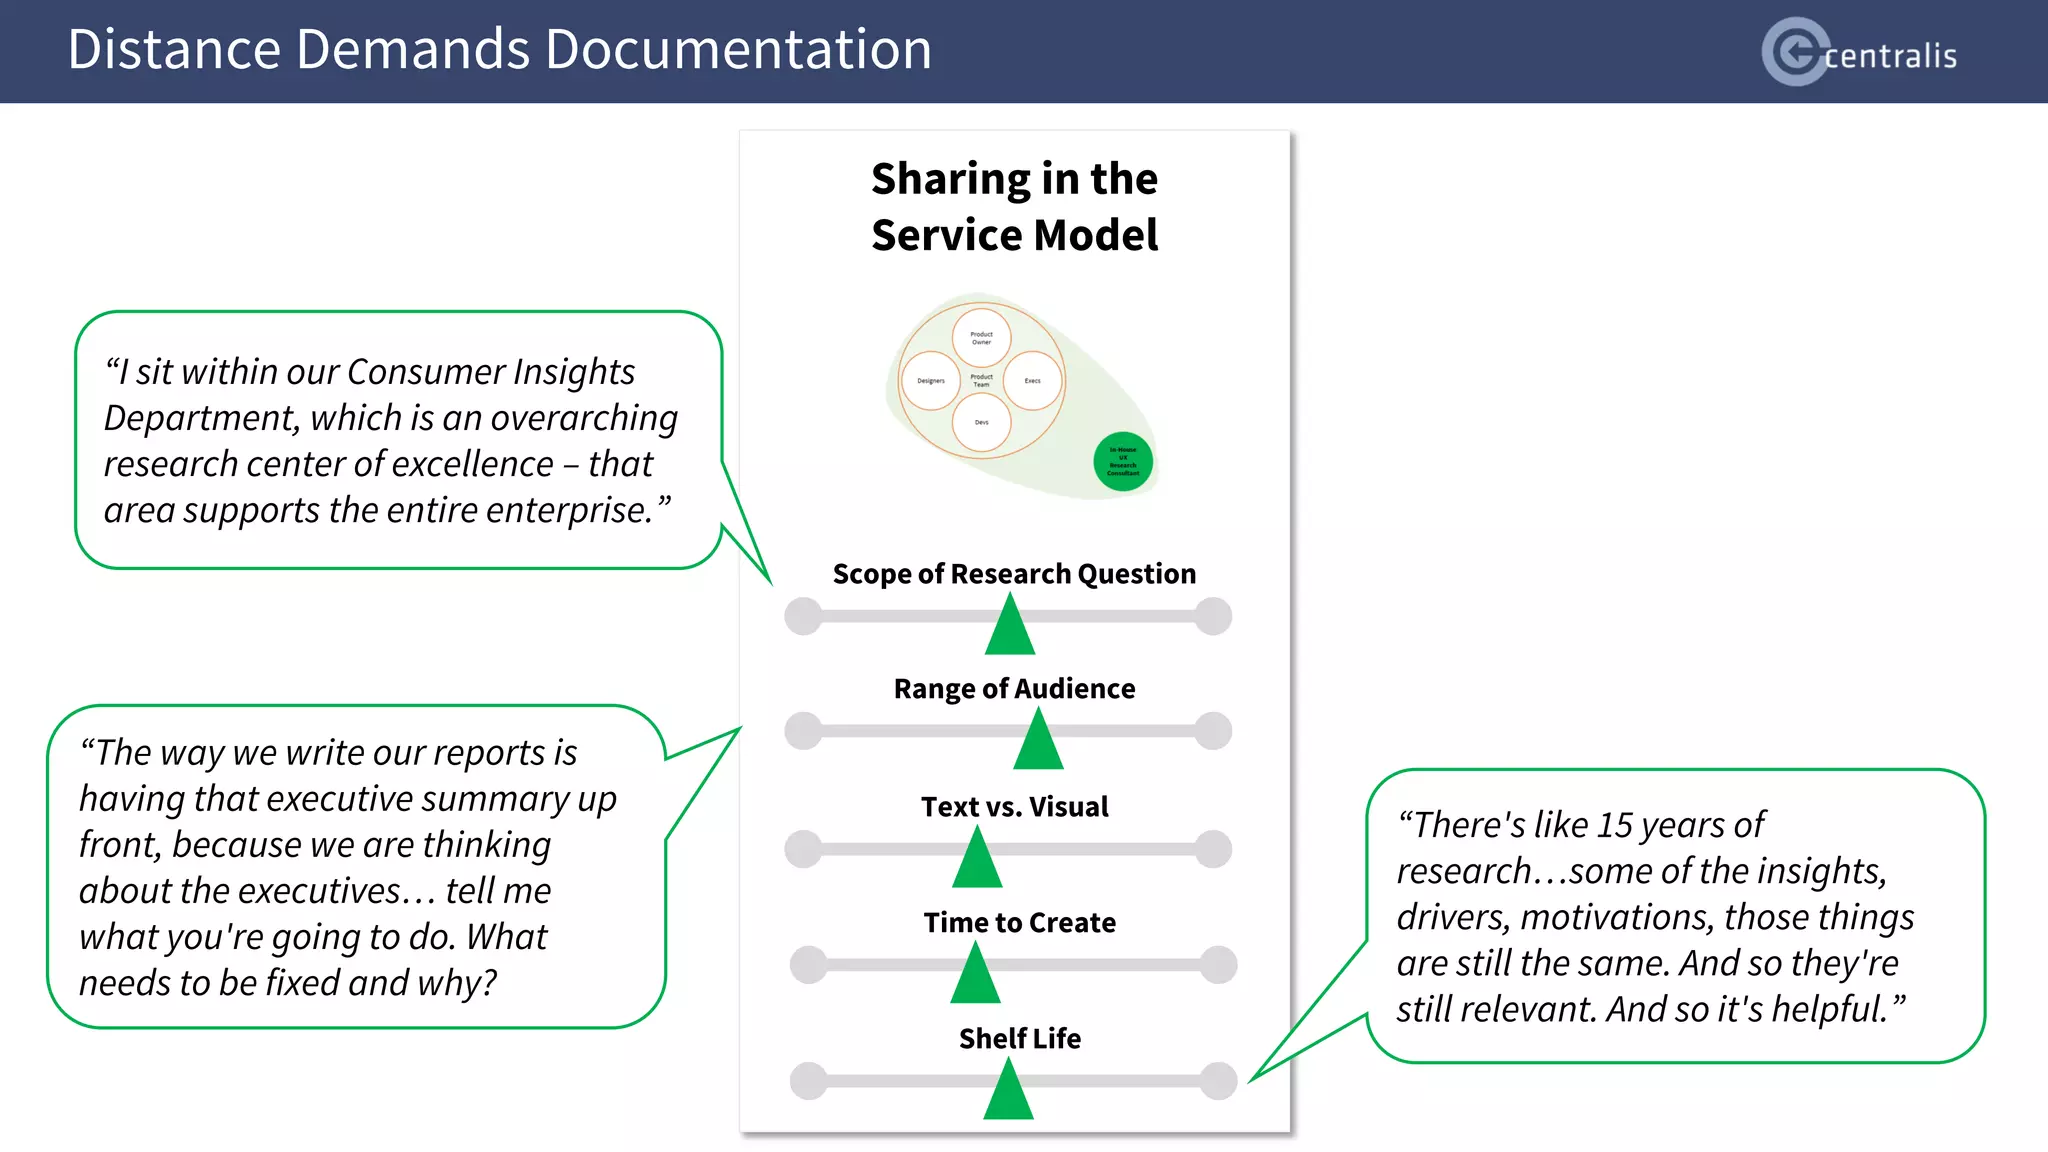
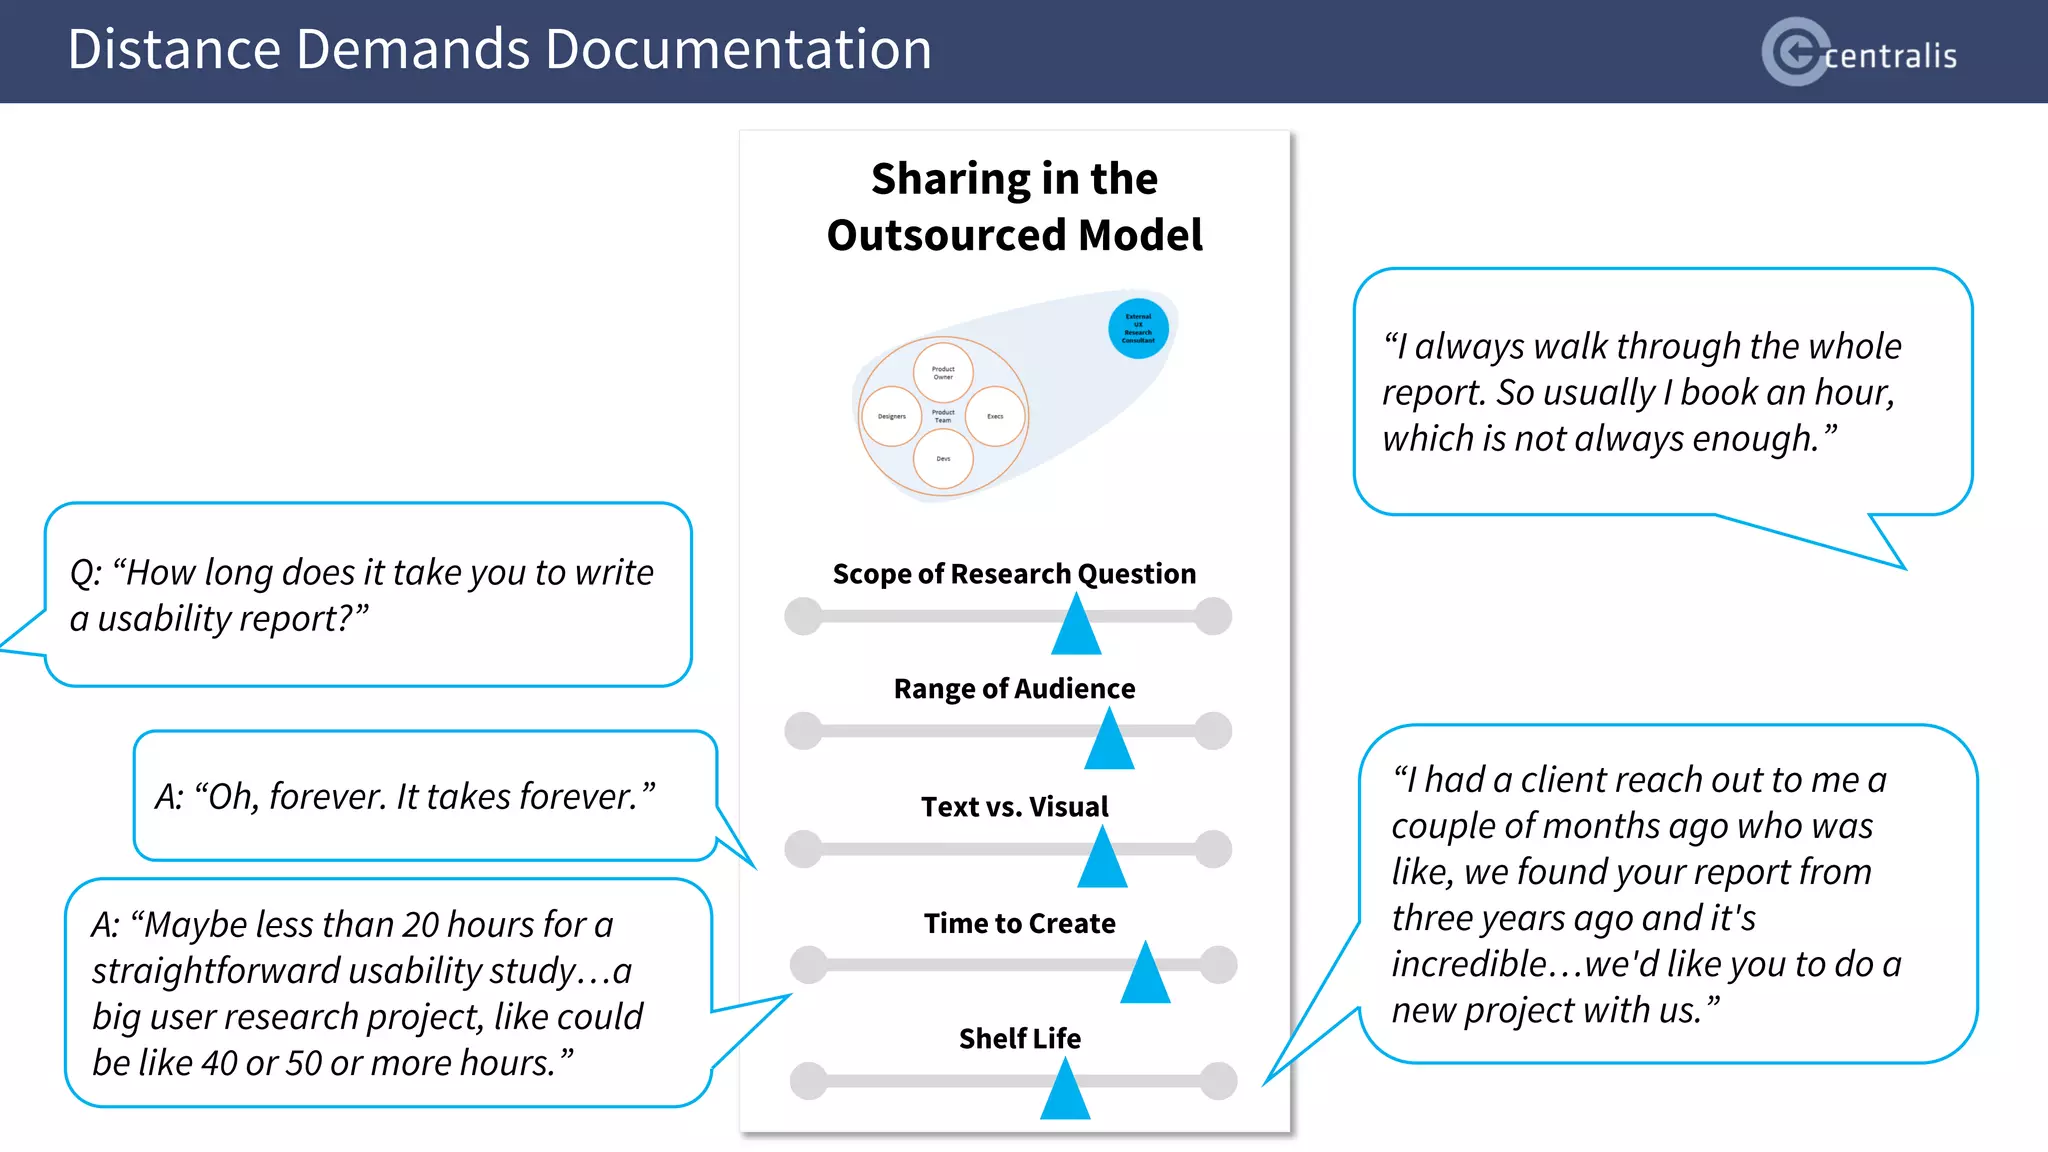
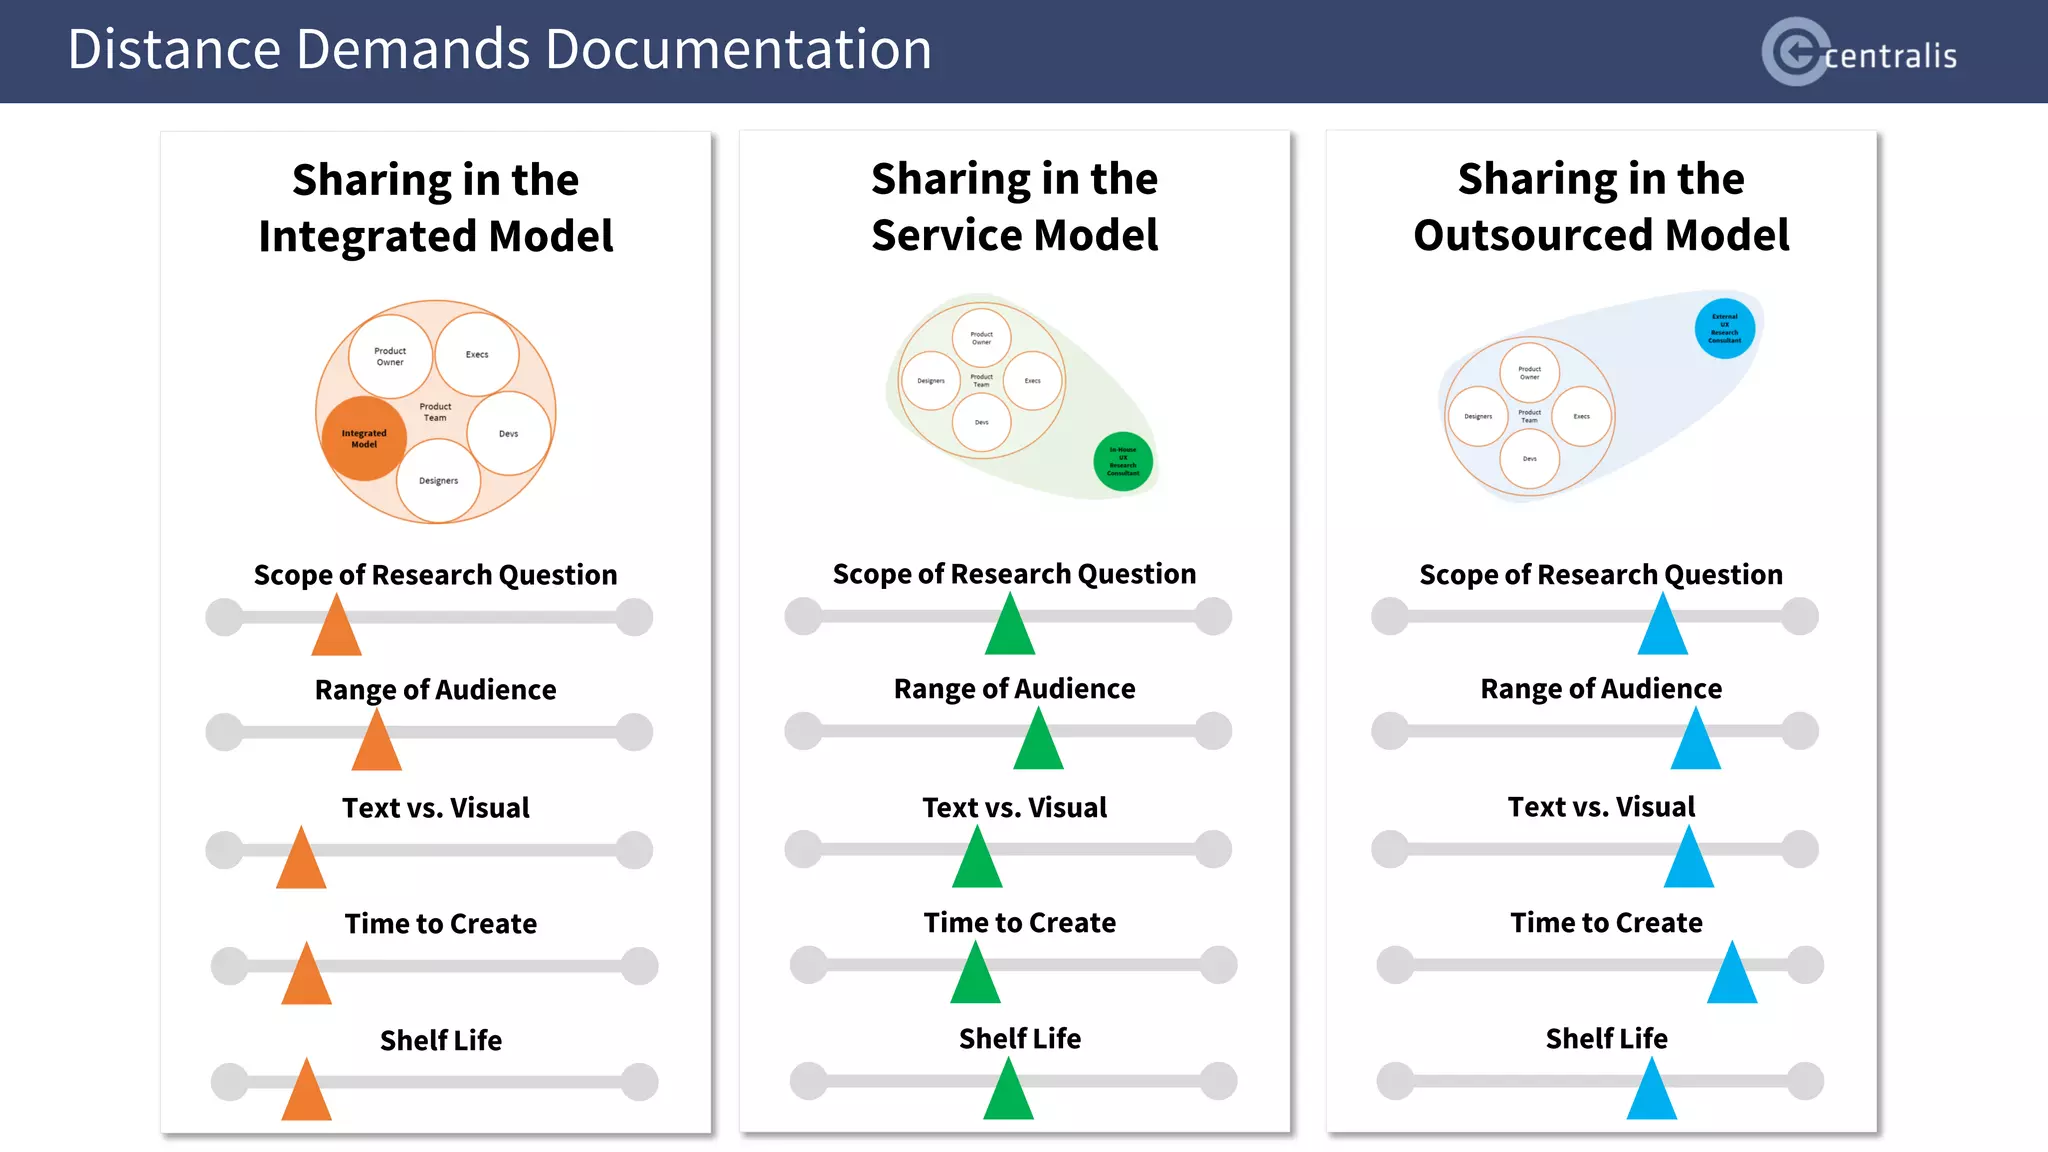
Scope of Research Question
Range of Audience
Text vs. Visual
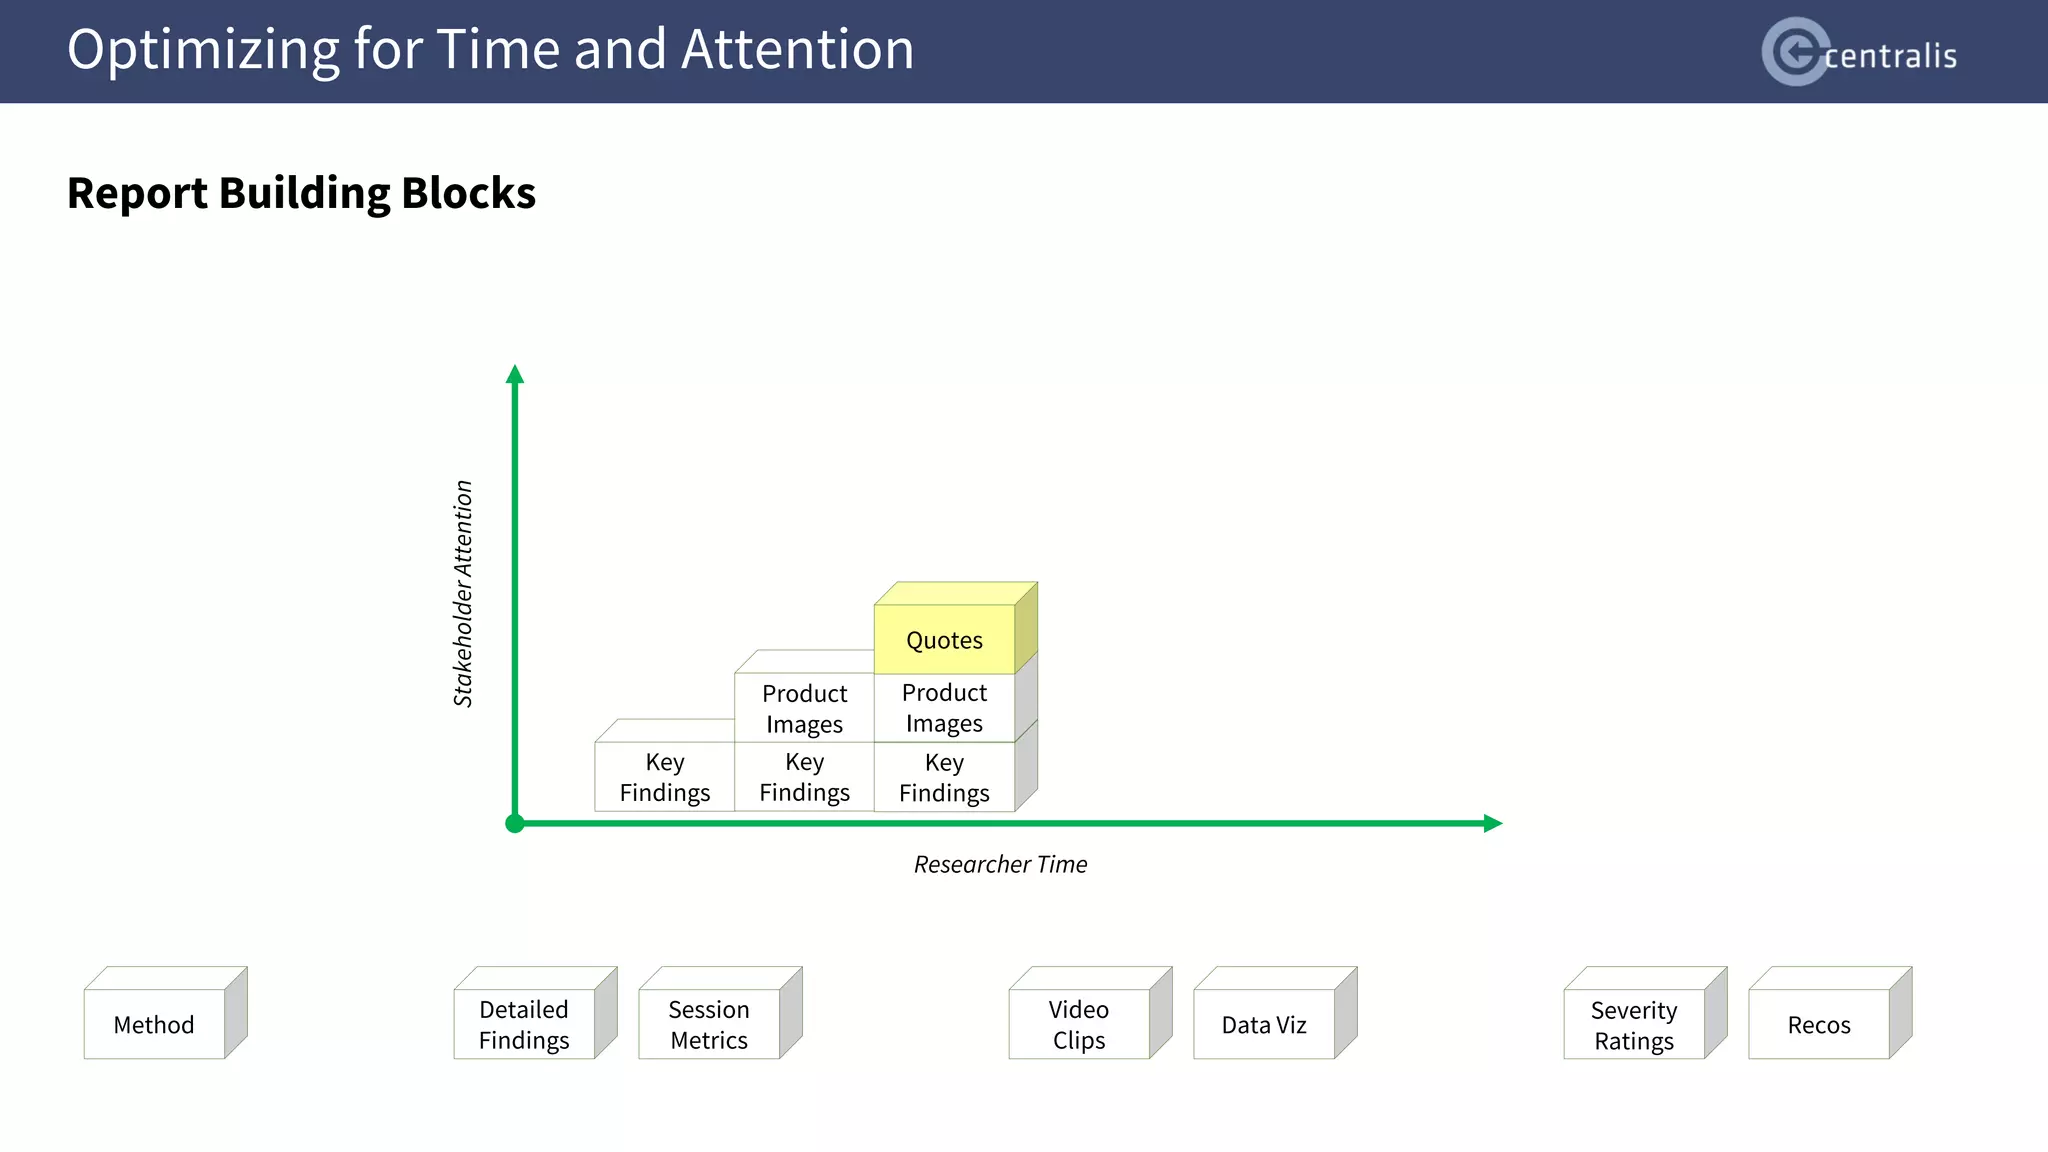
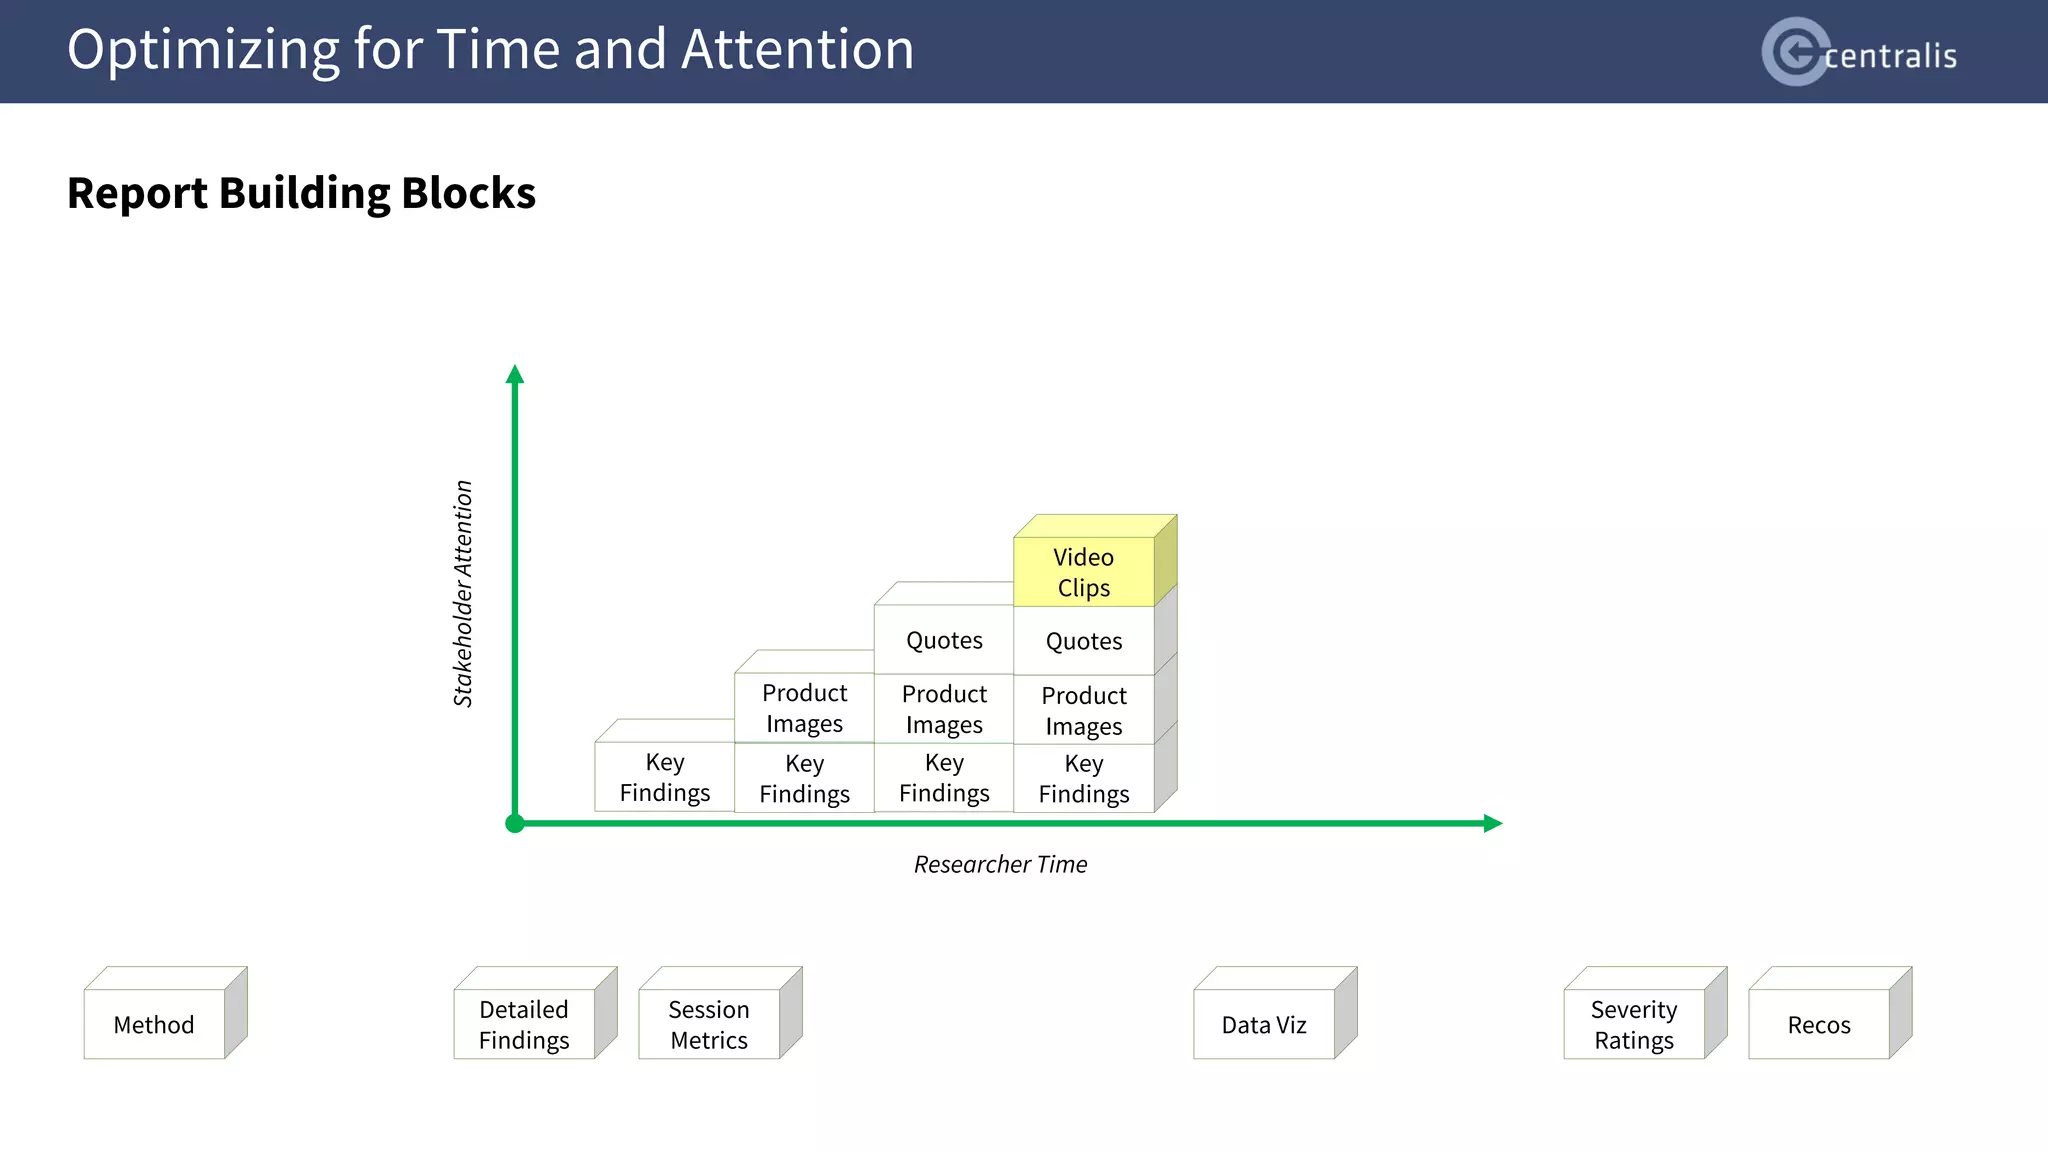
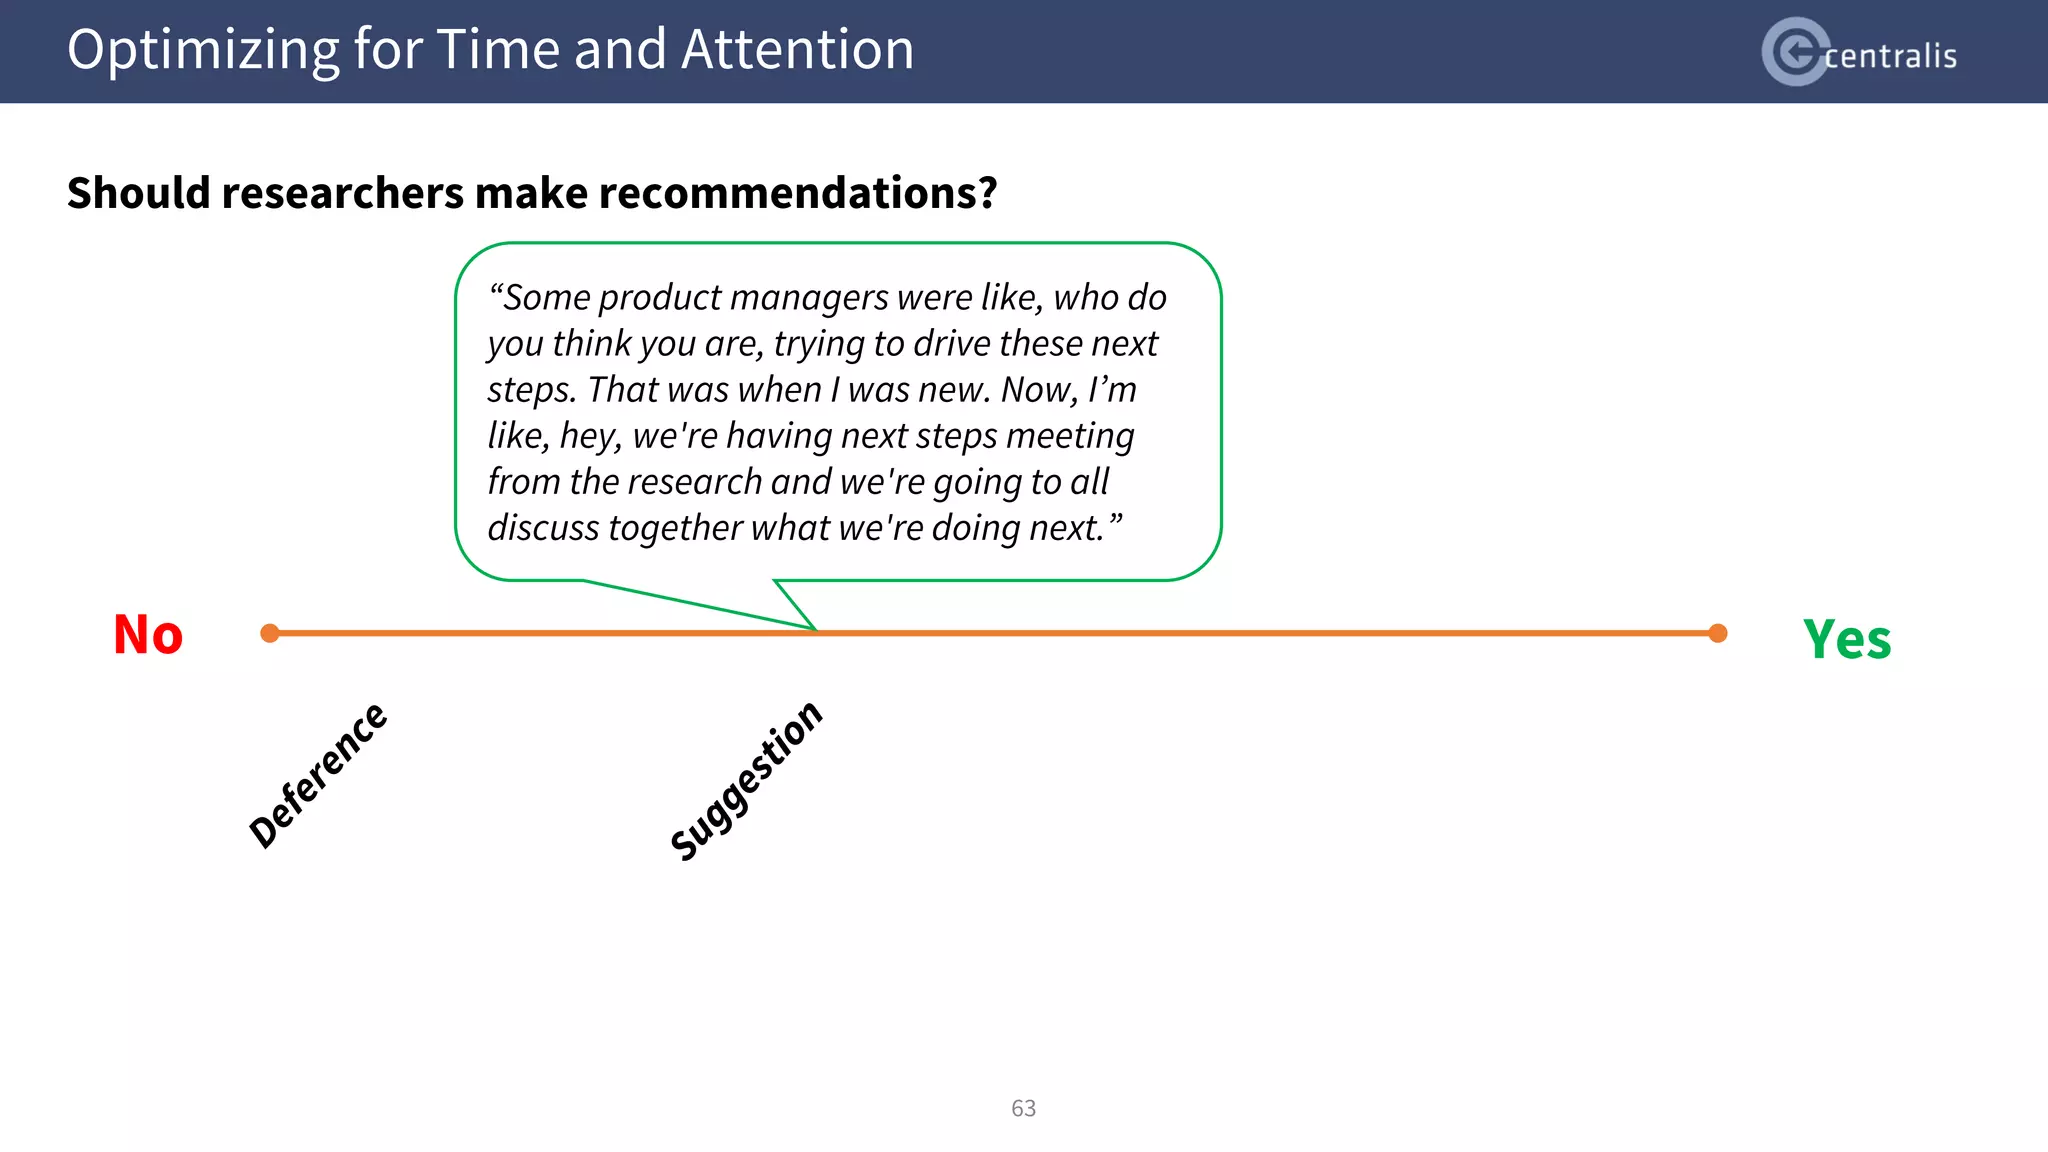
“I'll write up, here's what I think the
main findings were in basically a one-
page kind of thing.”
Time to Create
Shelf Life
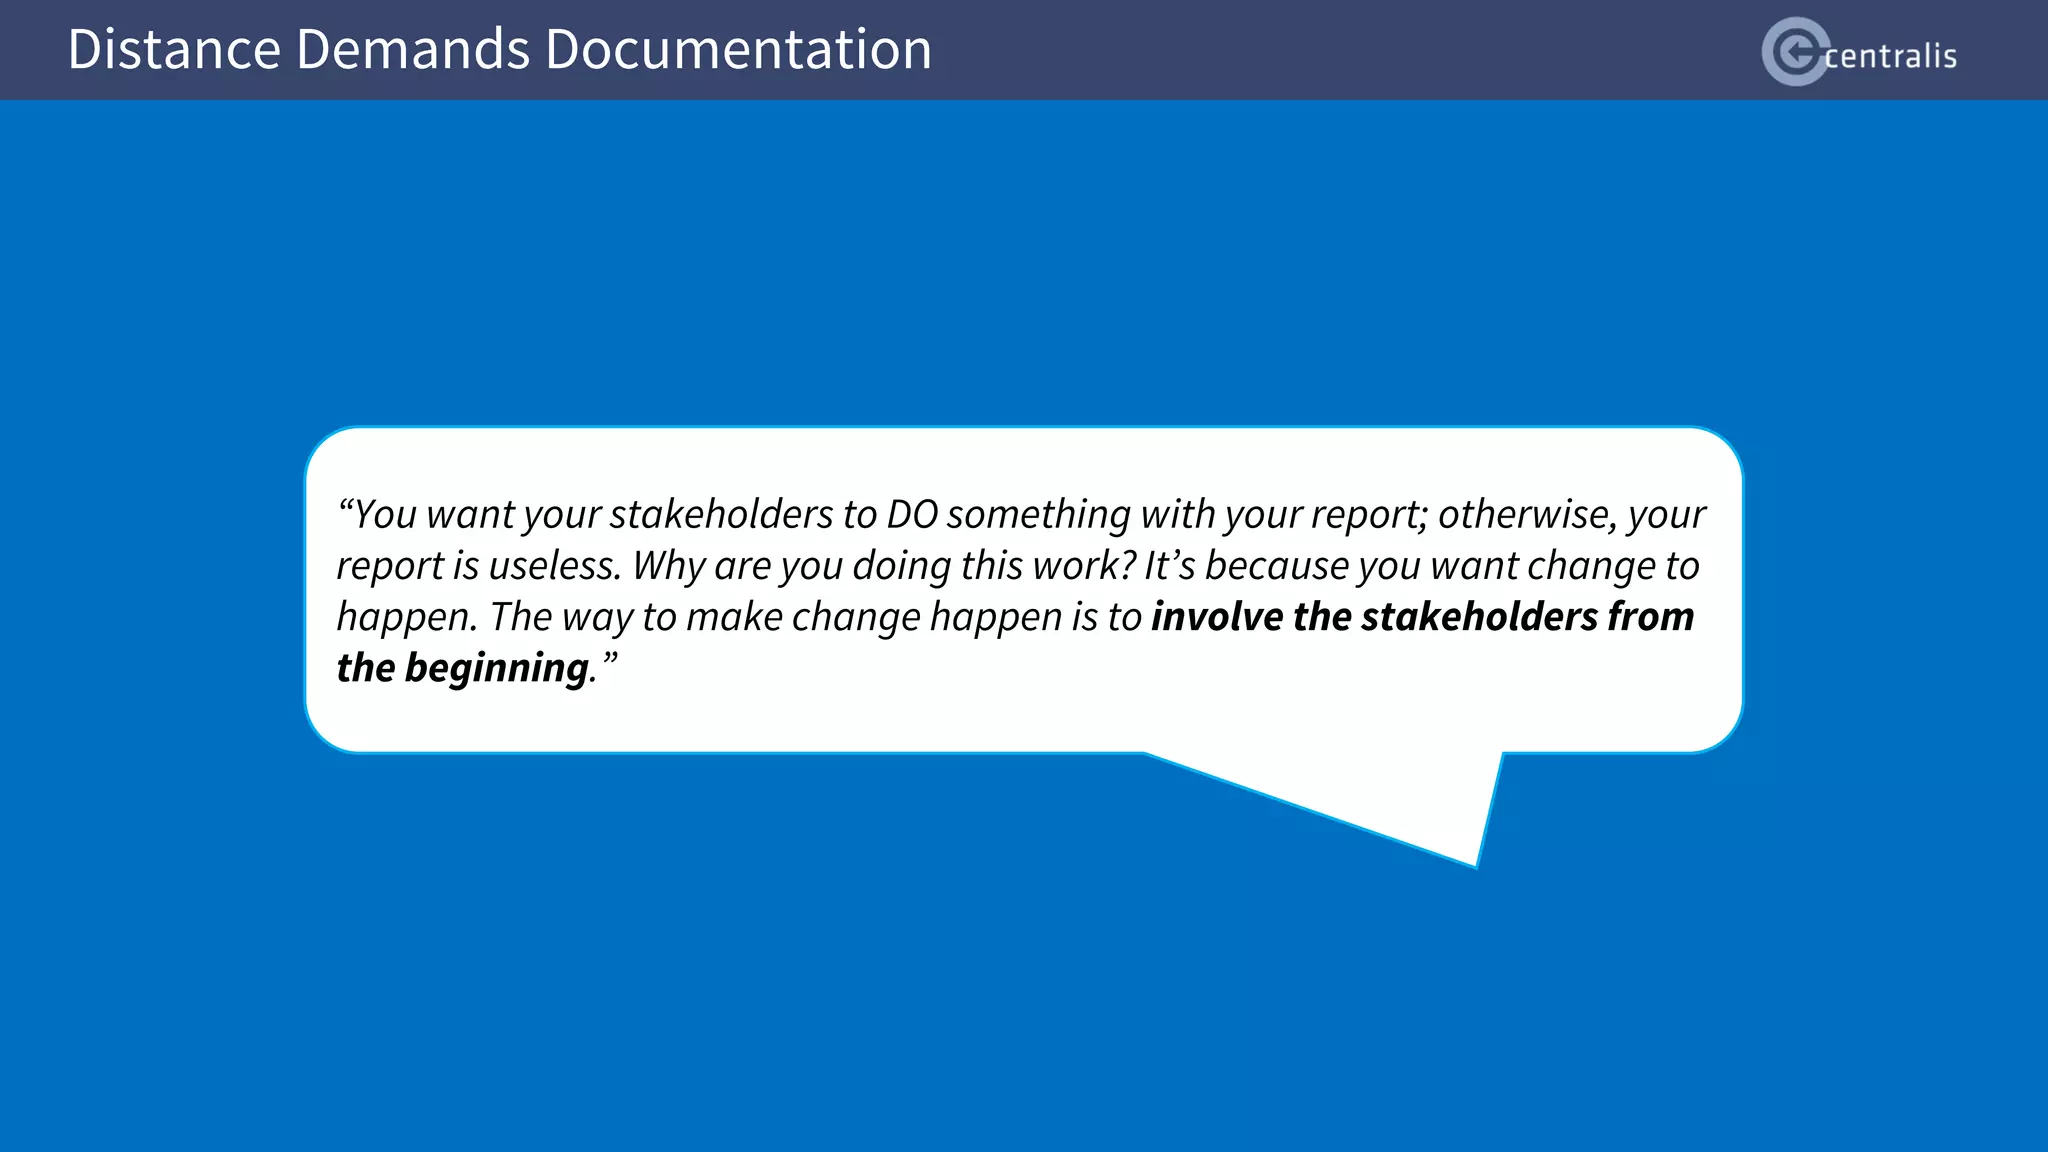
“Everybody knows that producing
written documents in most
organizational cultures is not the
way to affect change.”
“Usually, we're bumping up at the
time when the product manager
has to hand [the product] over to
engineering for development.”
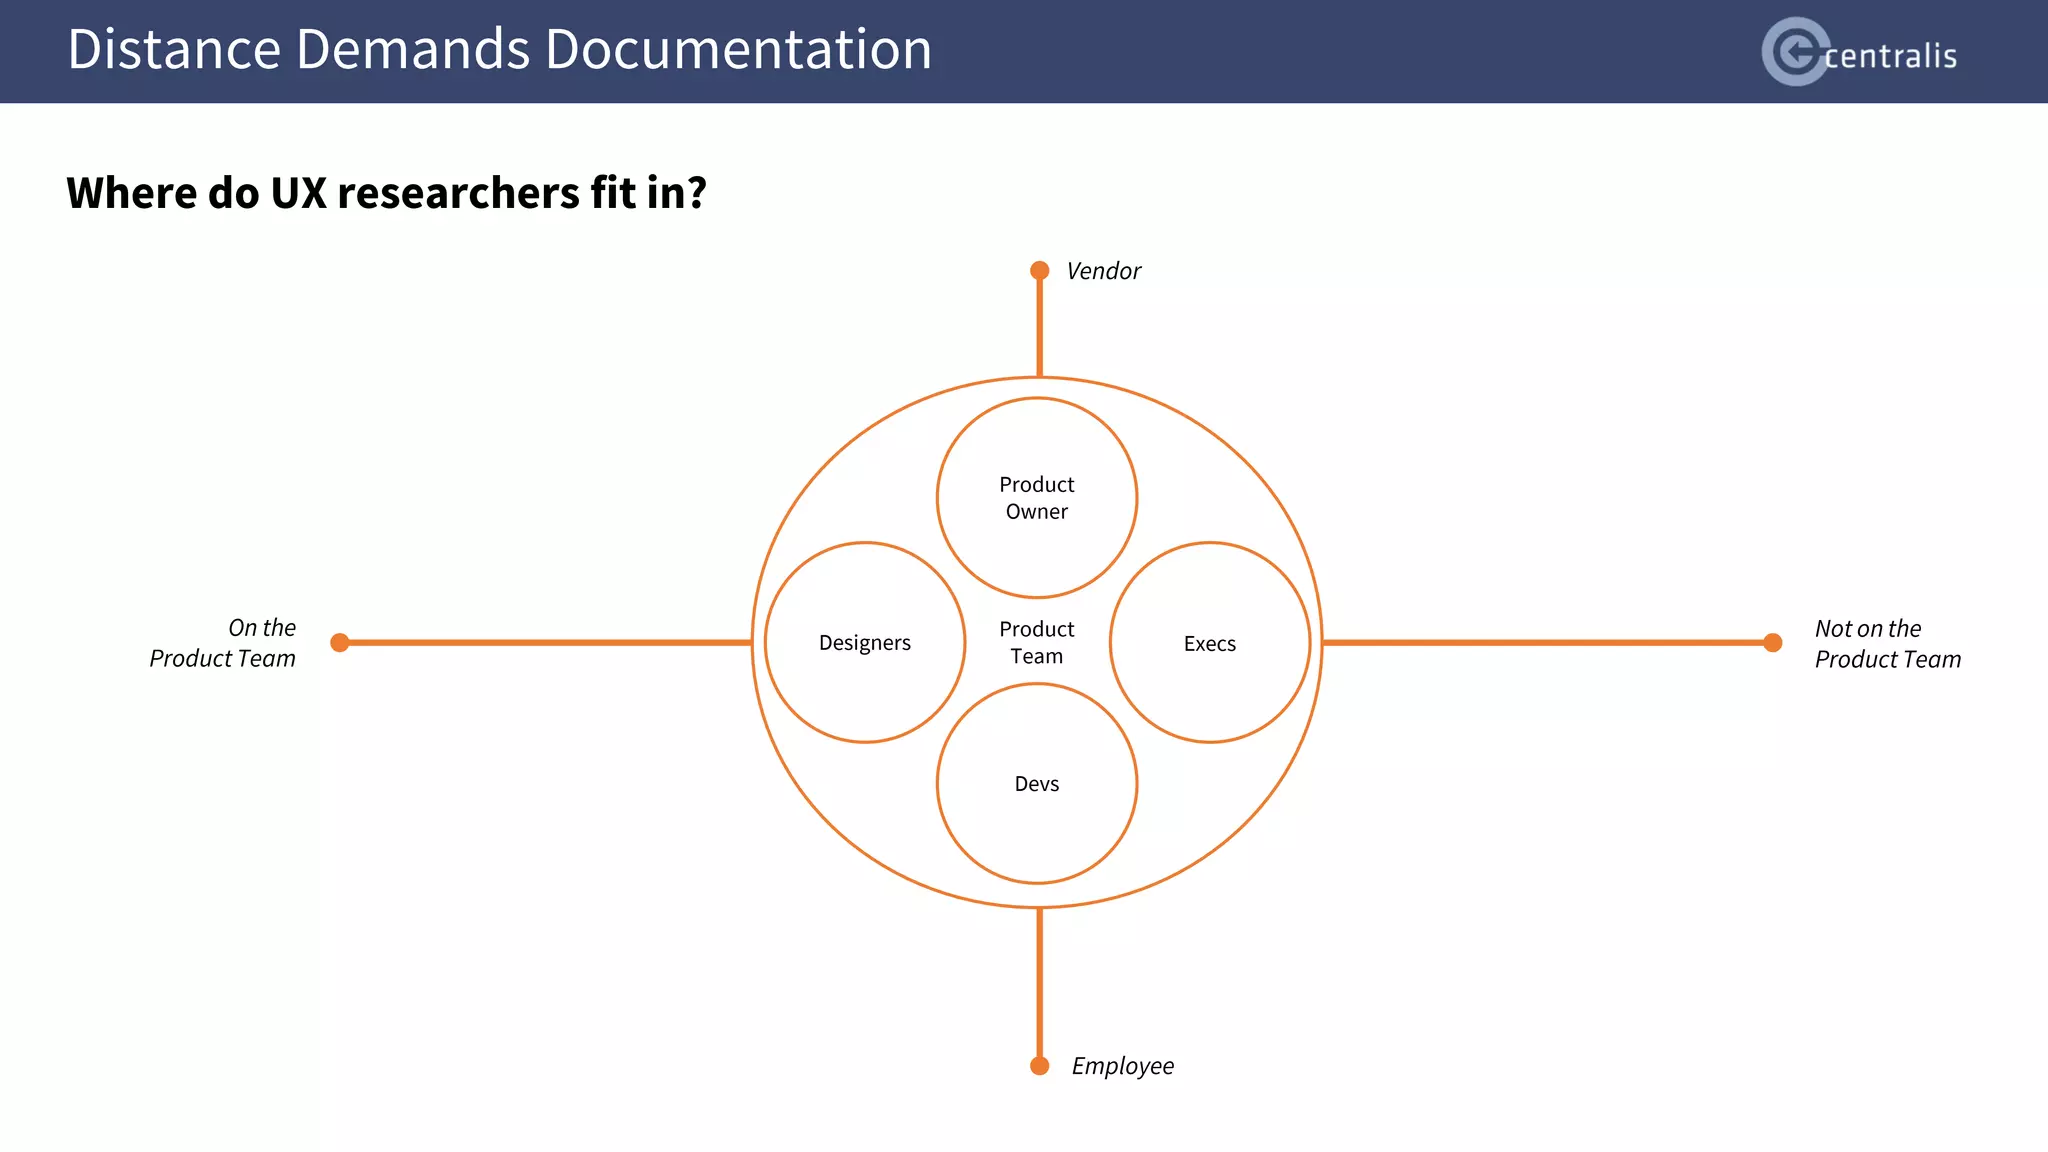
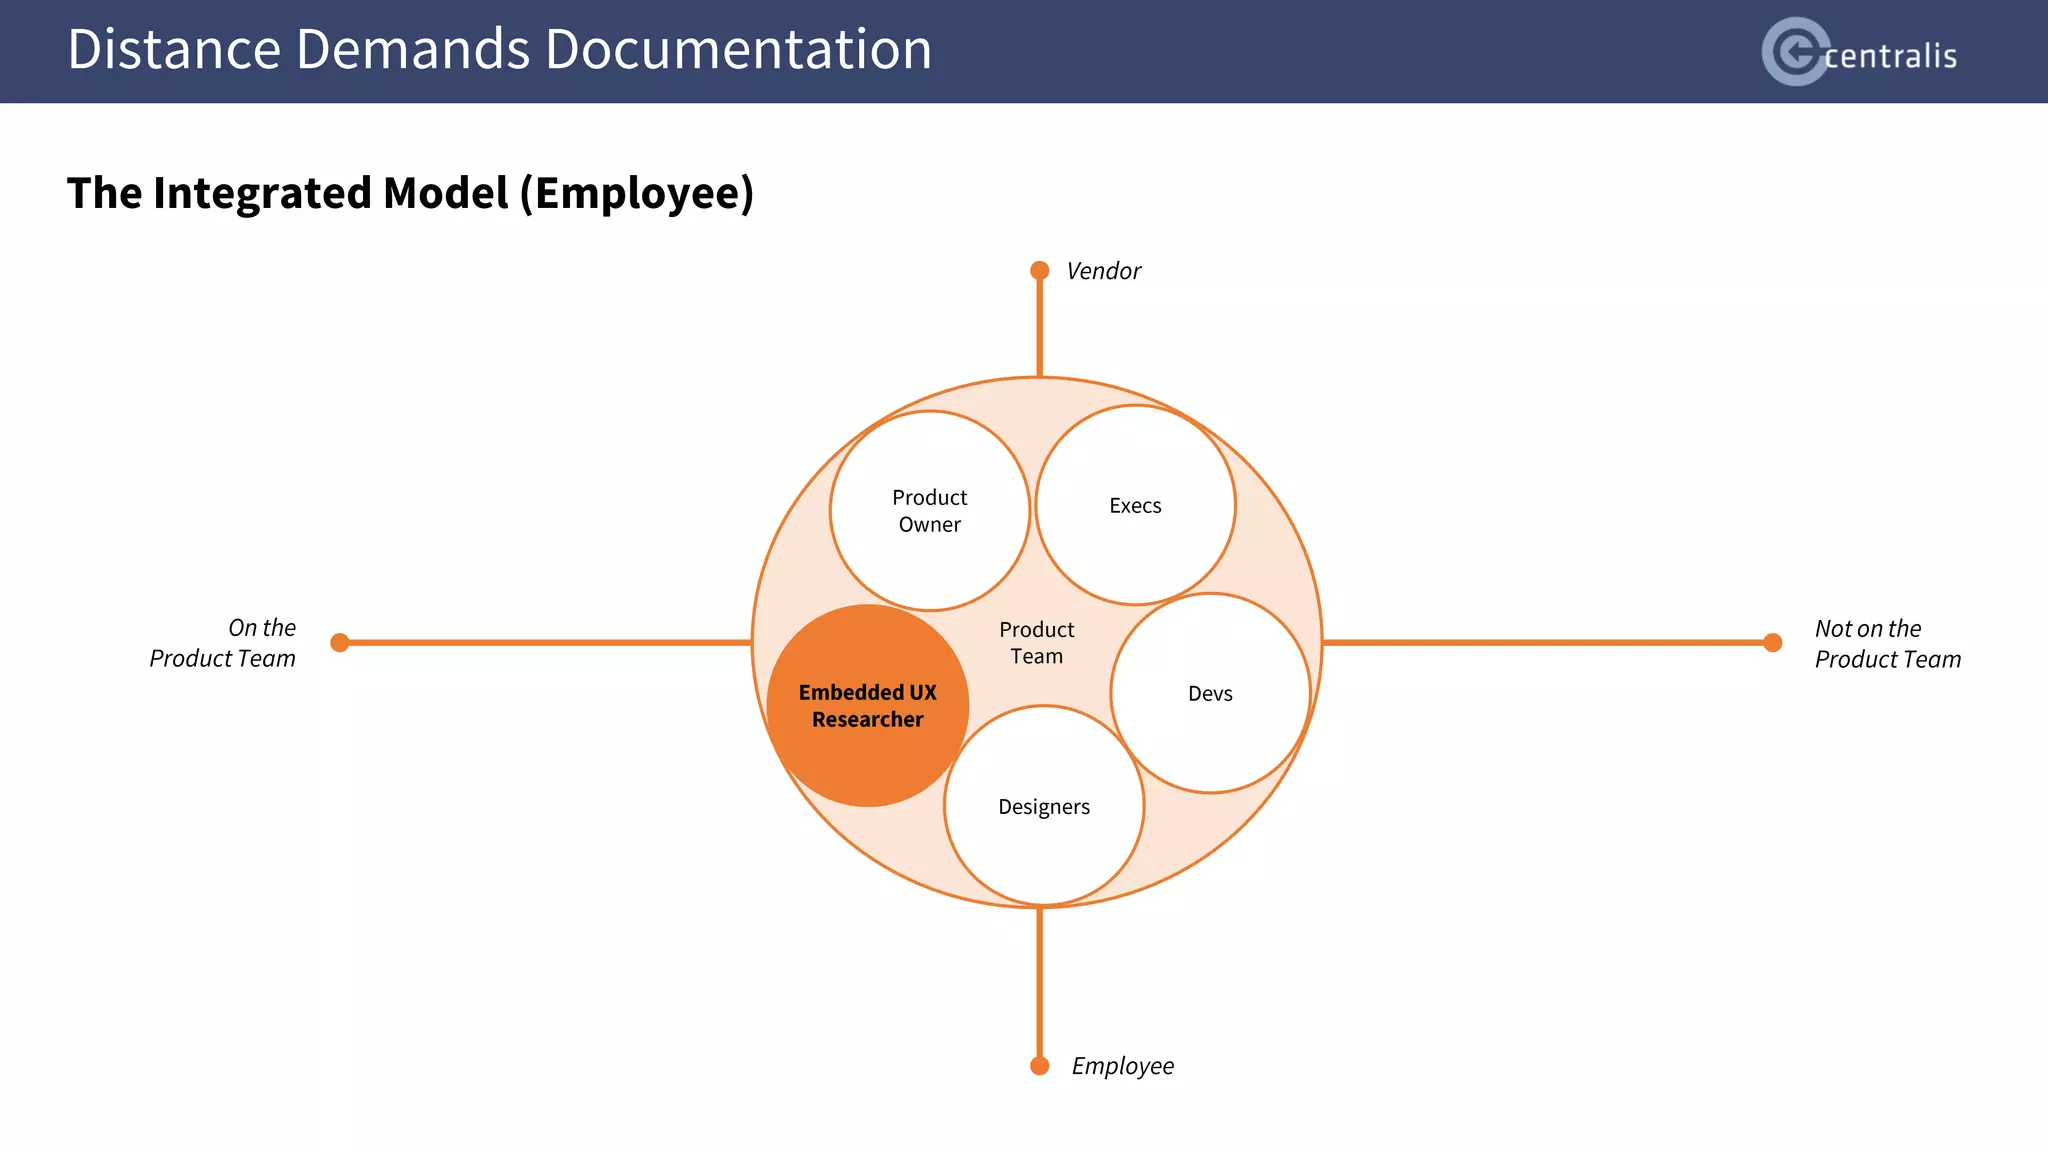
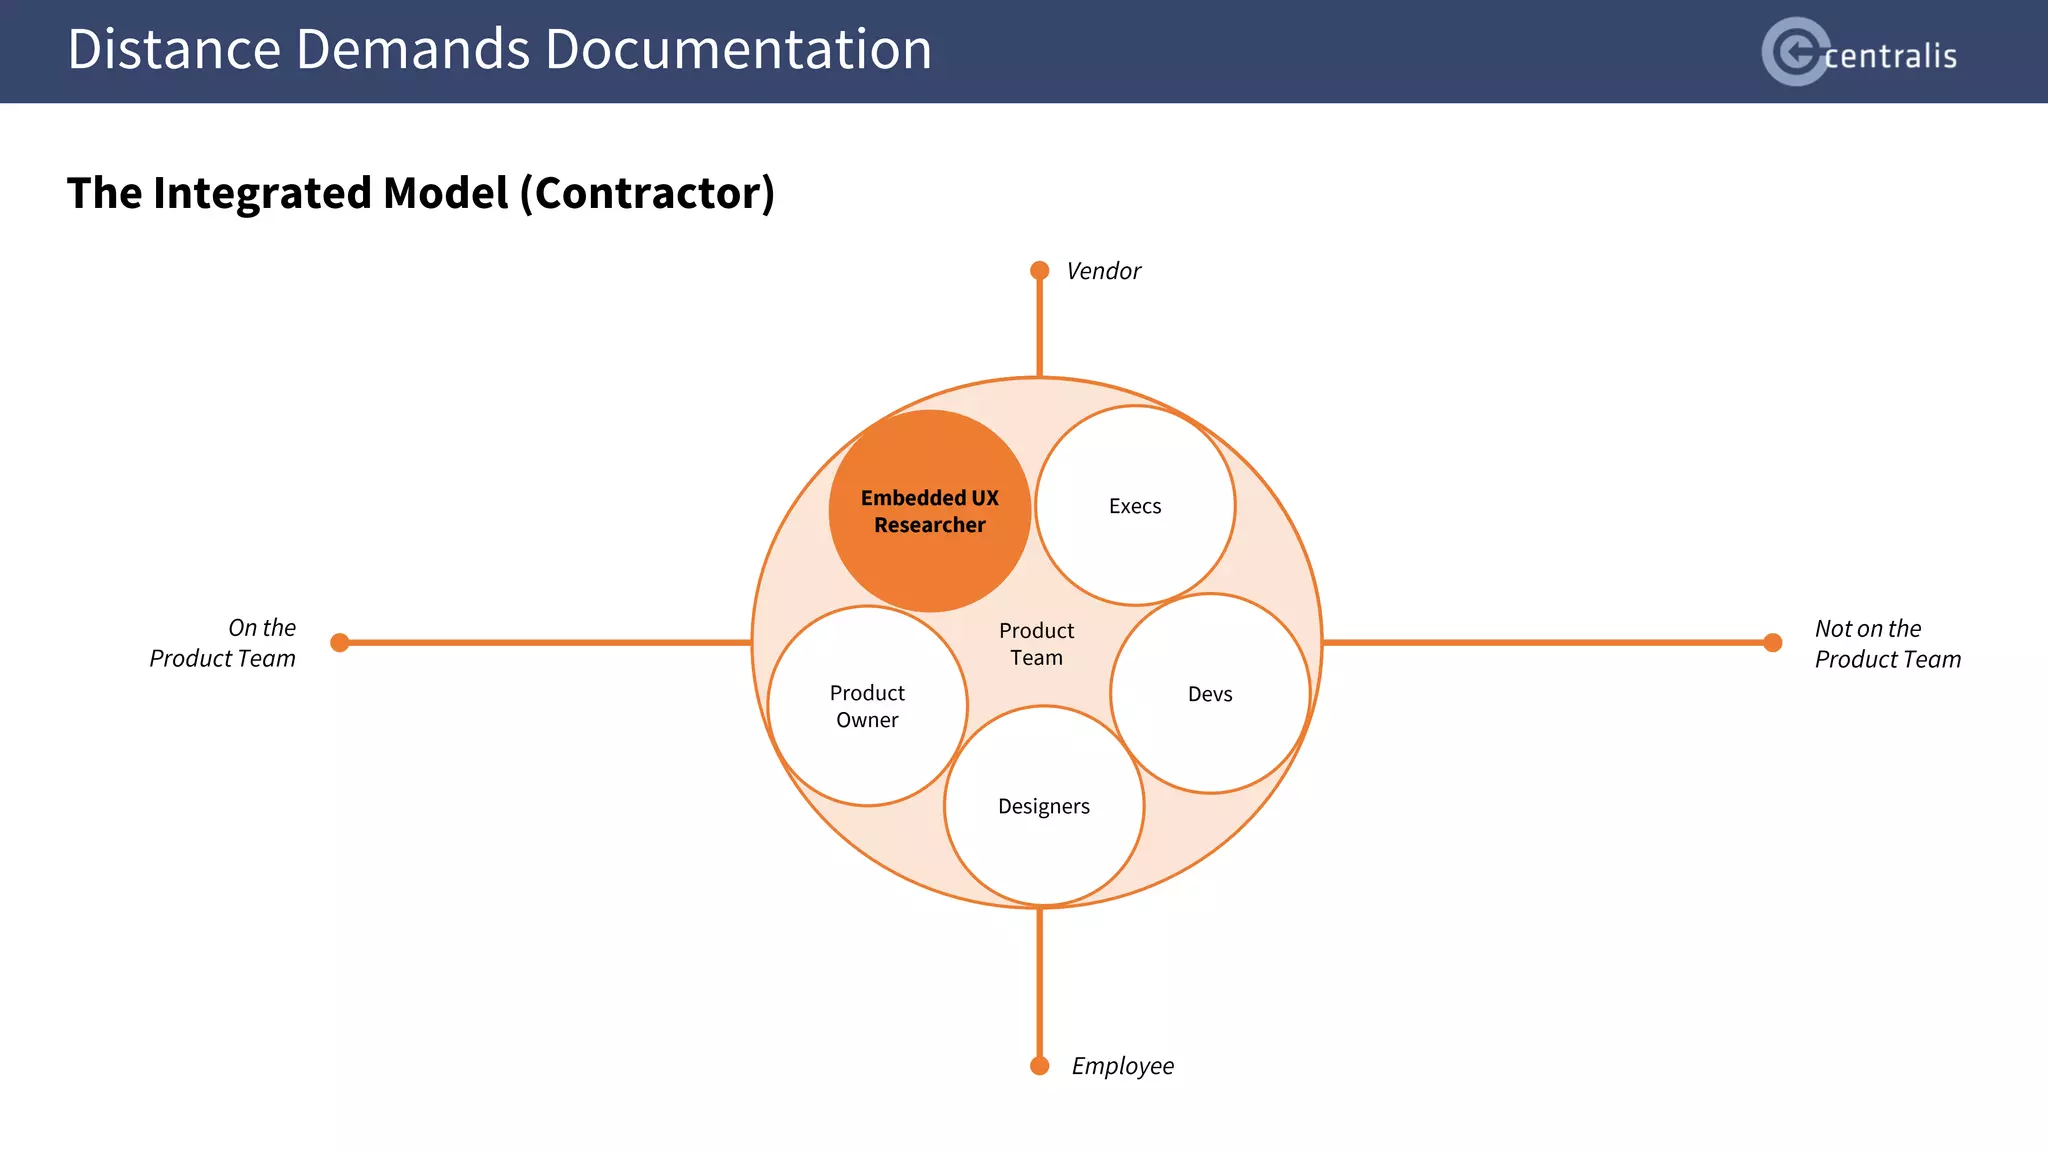
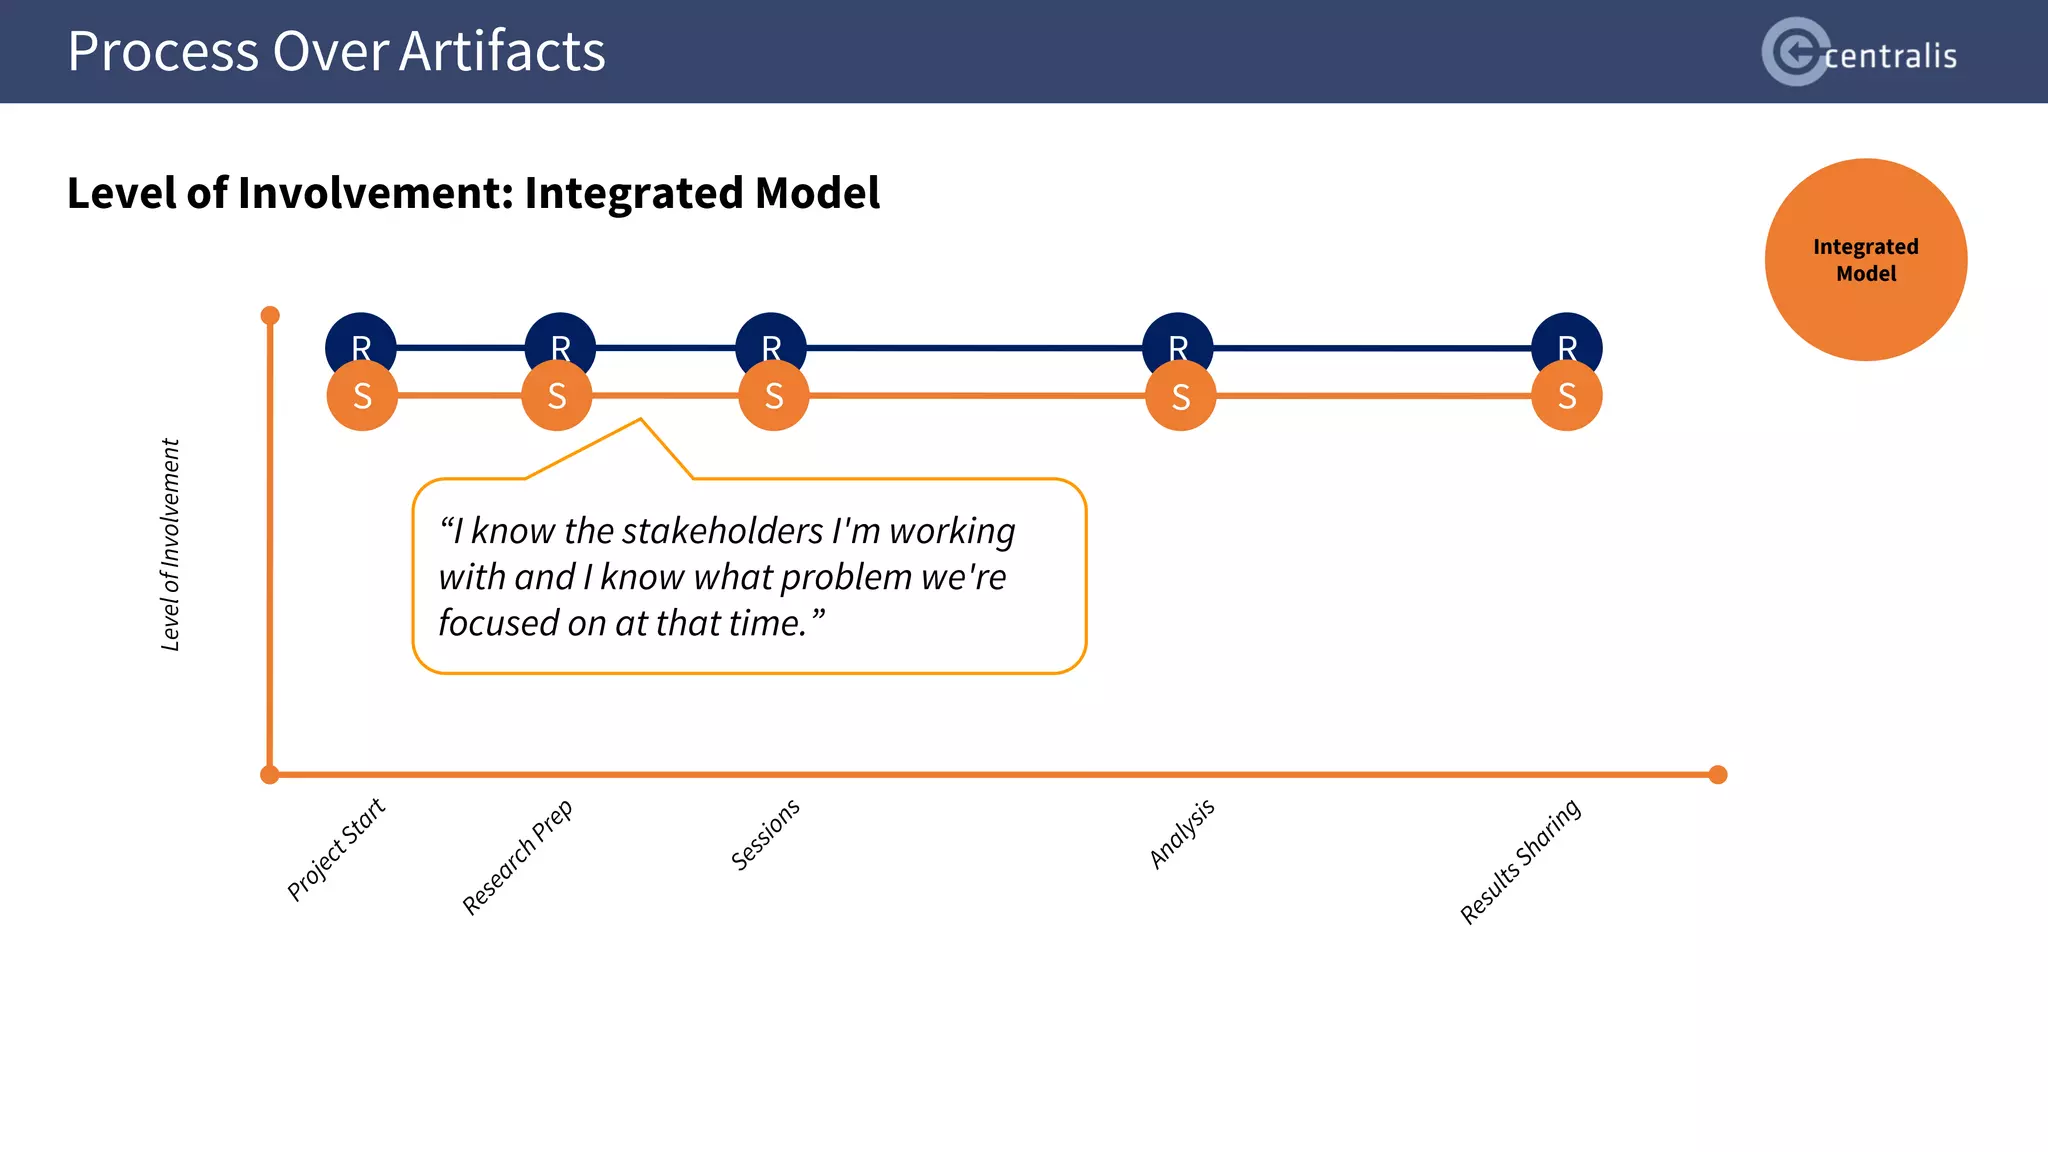
Sharing in the
Integrated Model
“It's mostly just the bare bones: what
did we observe, what did we learn
from it, what do we need to do now.”](https://image.slidesharecdn.com/kaiser-thereportisdeadlonglivethereport-uxpa2023-230628202448-4e6caf1c/75/The-Report-is-Dead-Long-Live-the-Report-How-to-Communicate-UX-Research-Findings-for-Maximum-Impact-20-2048.jpg)
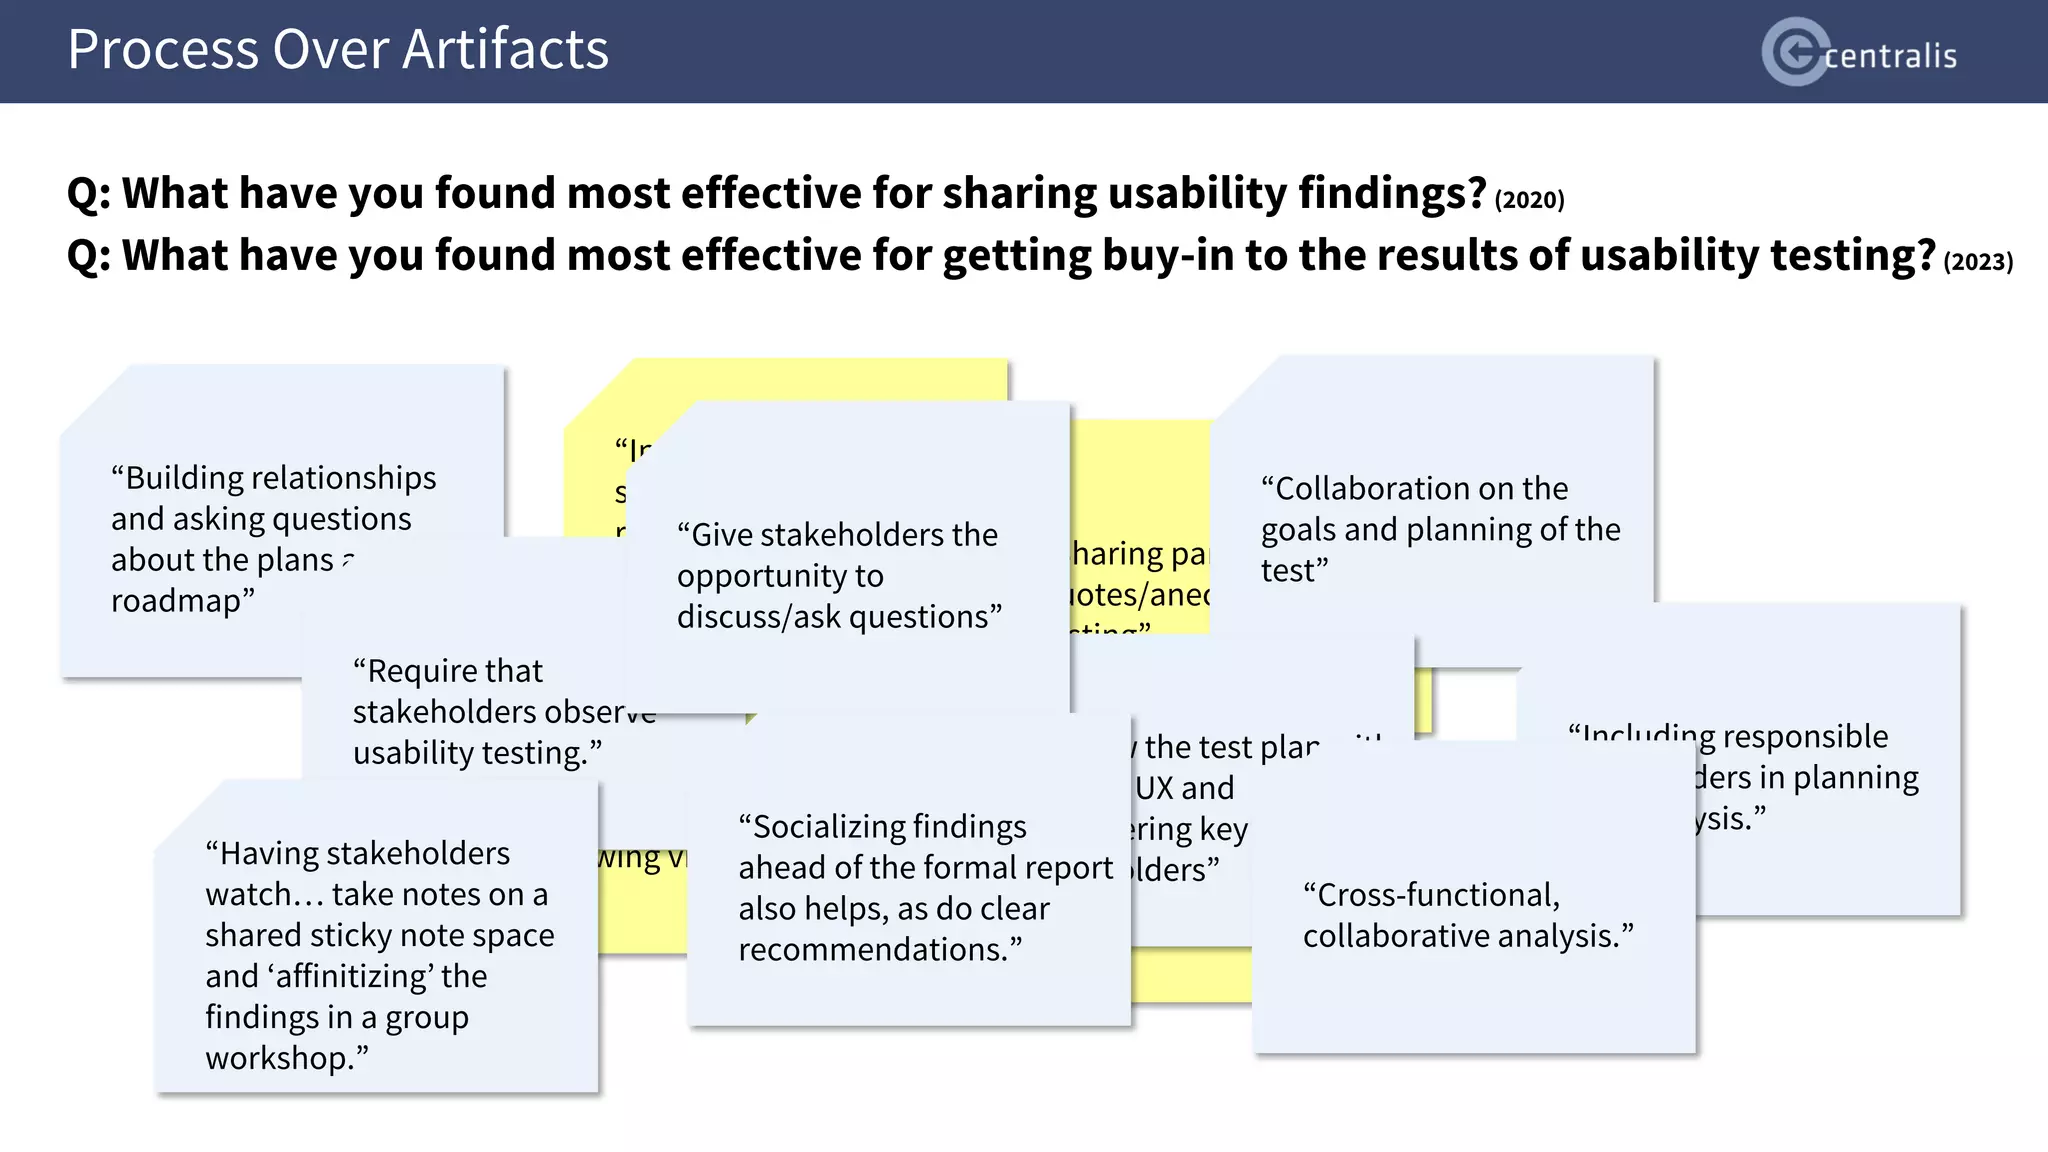
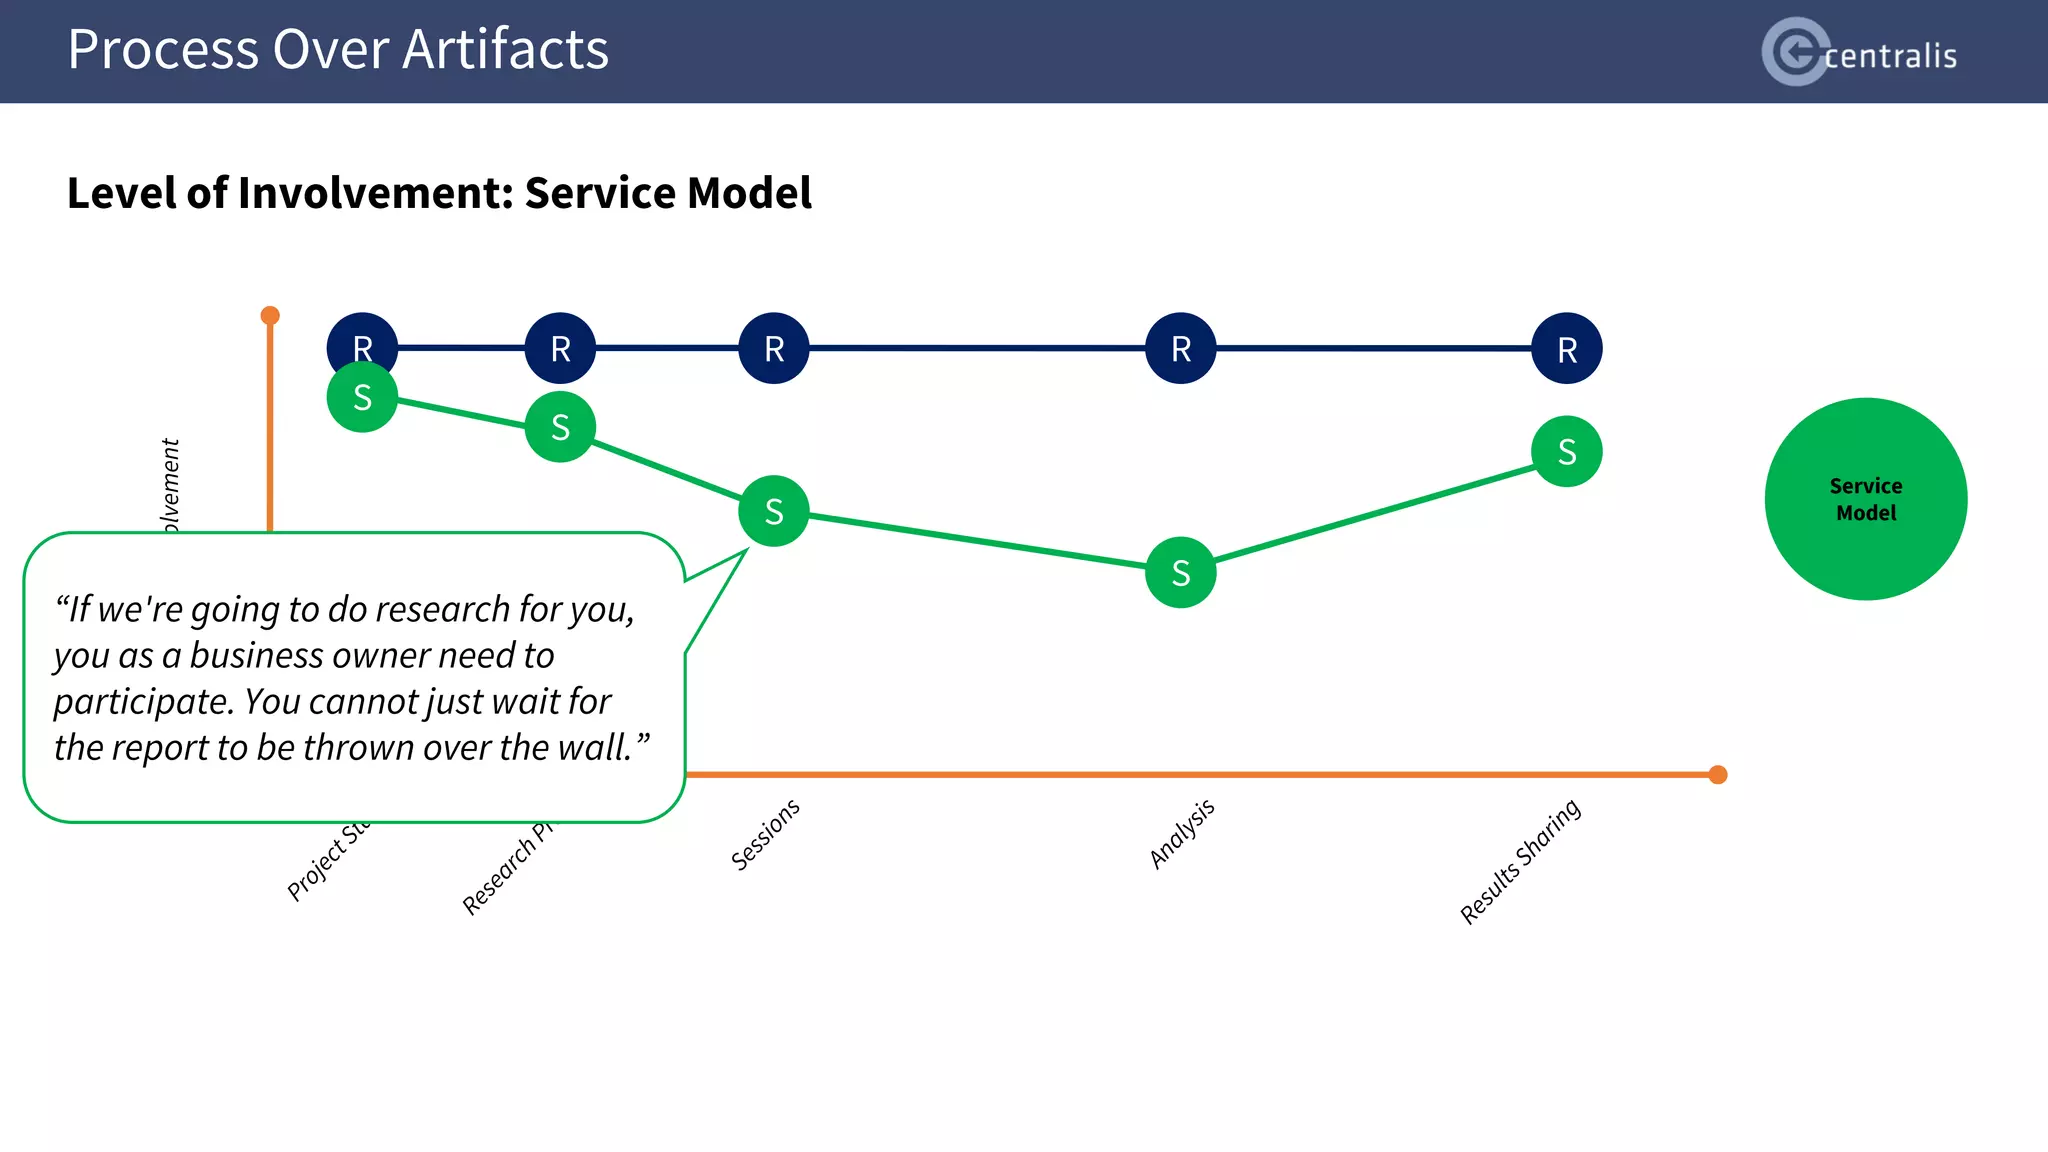
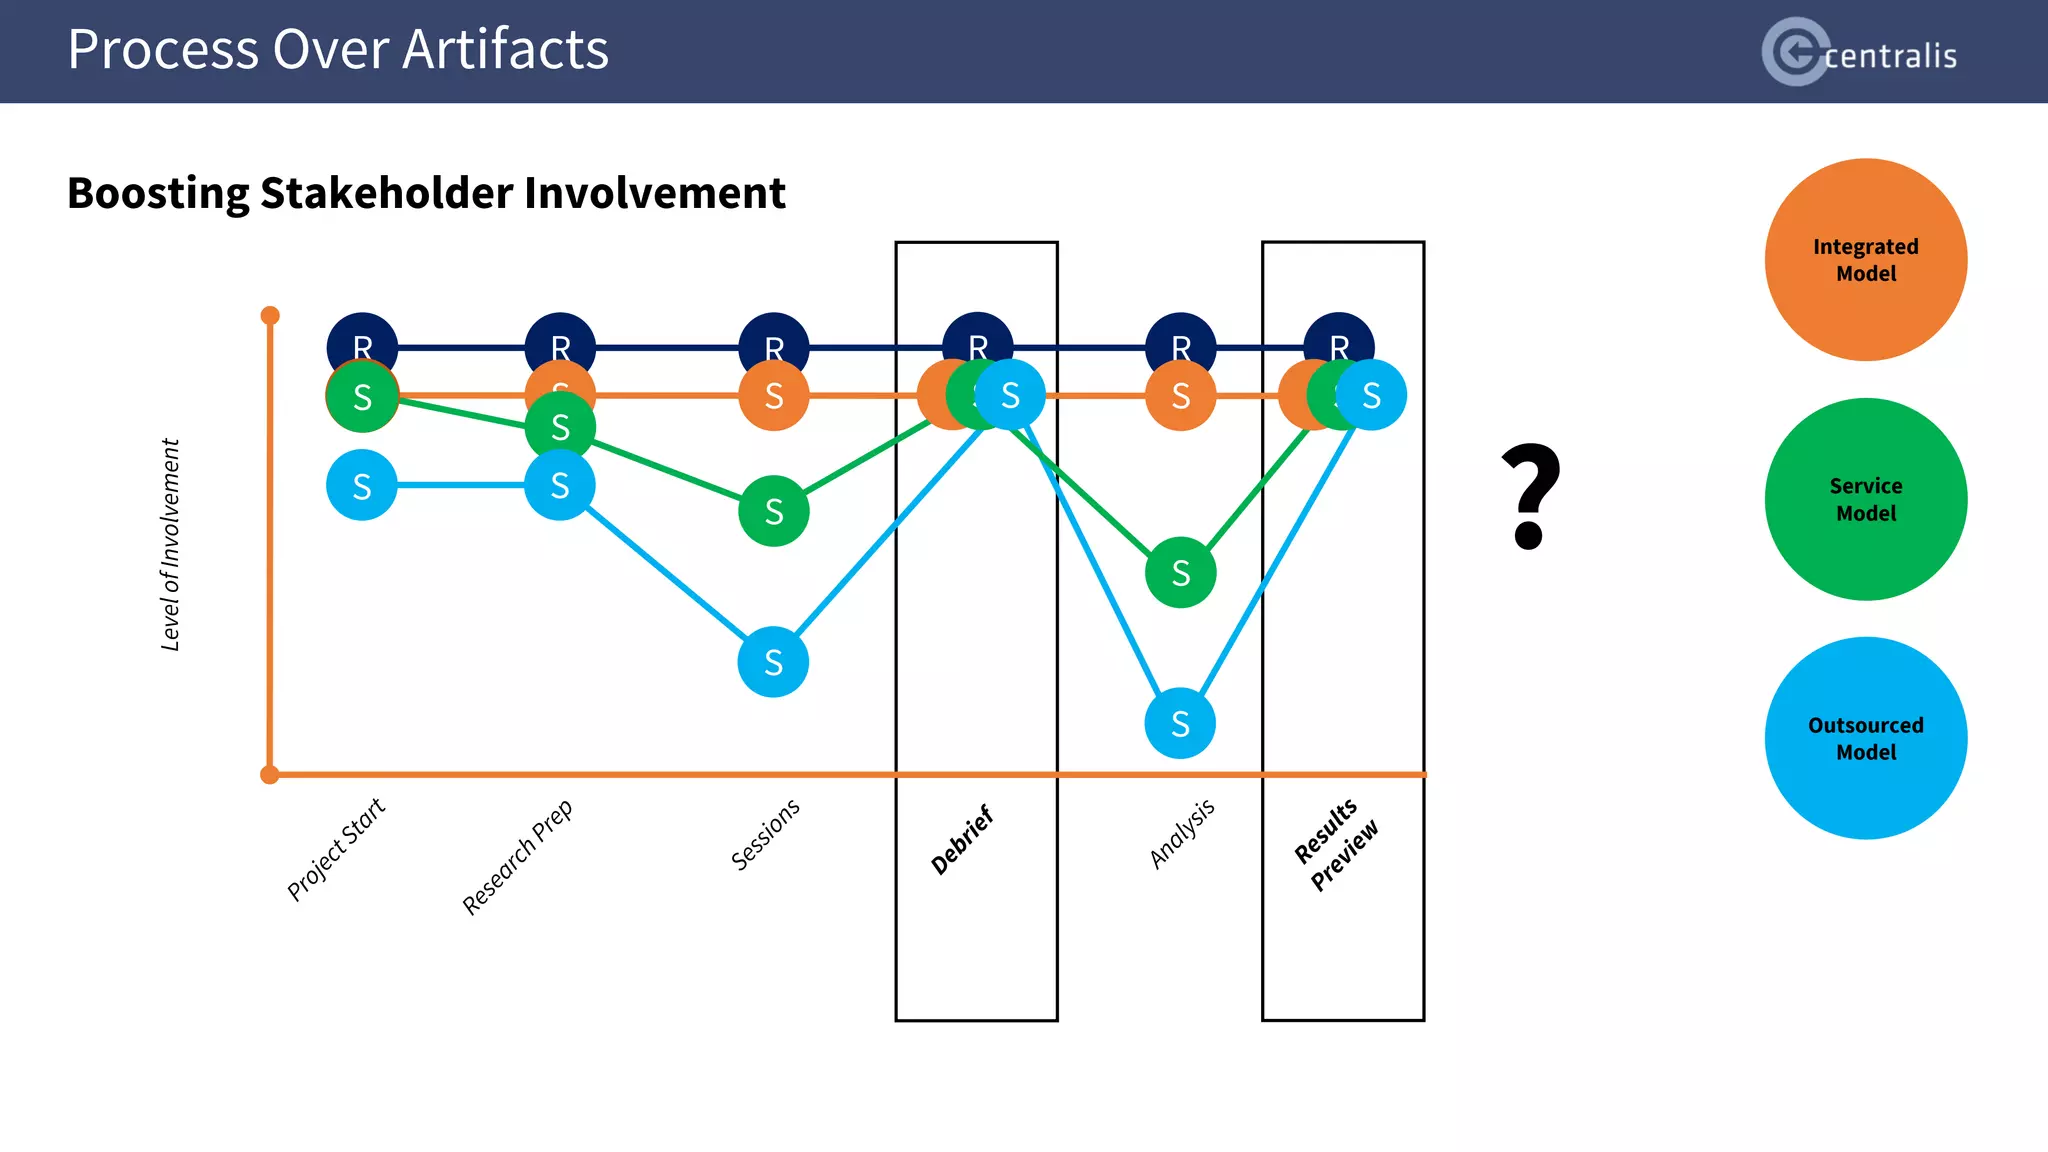
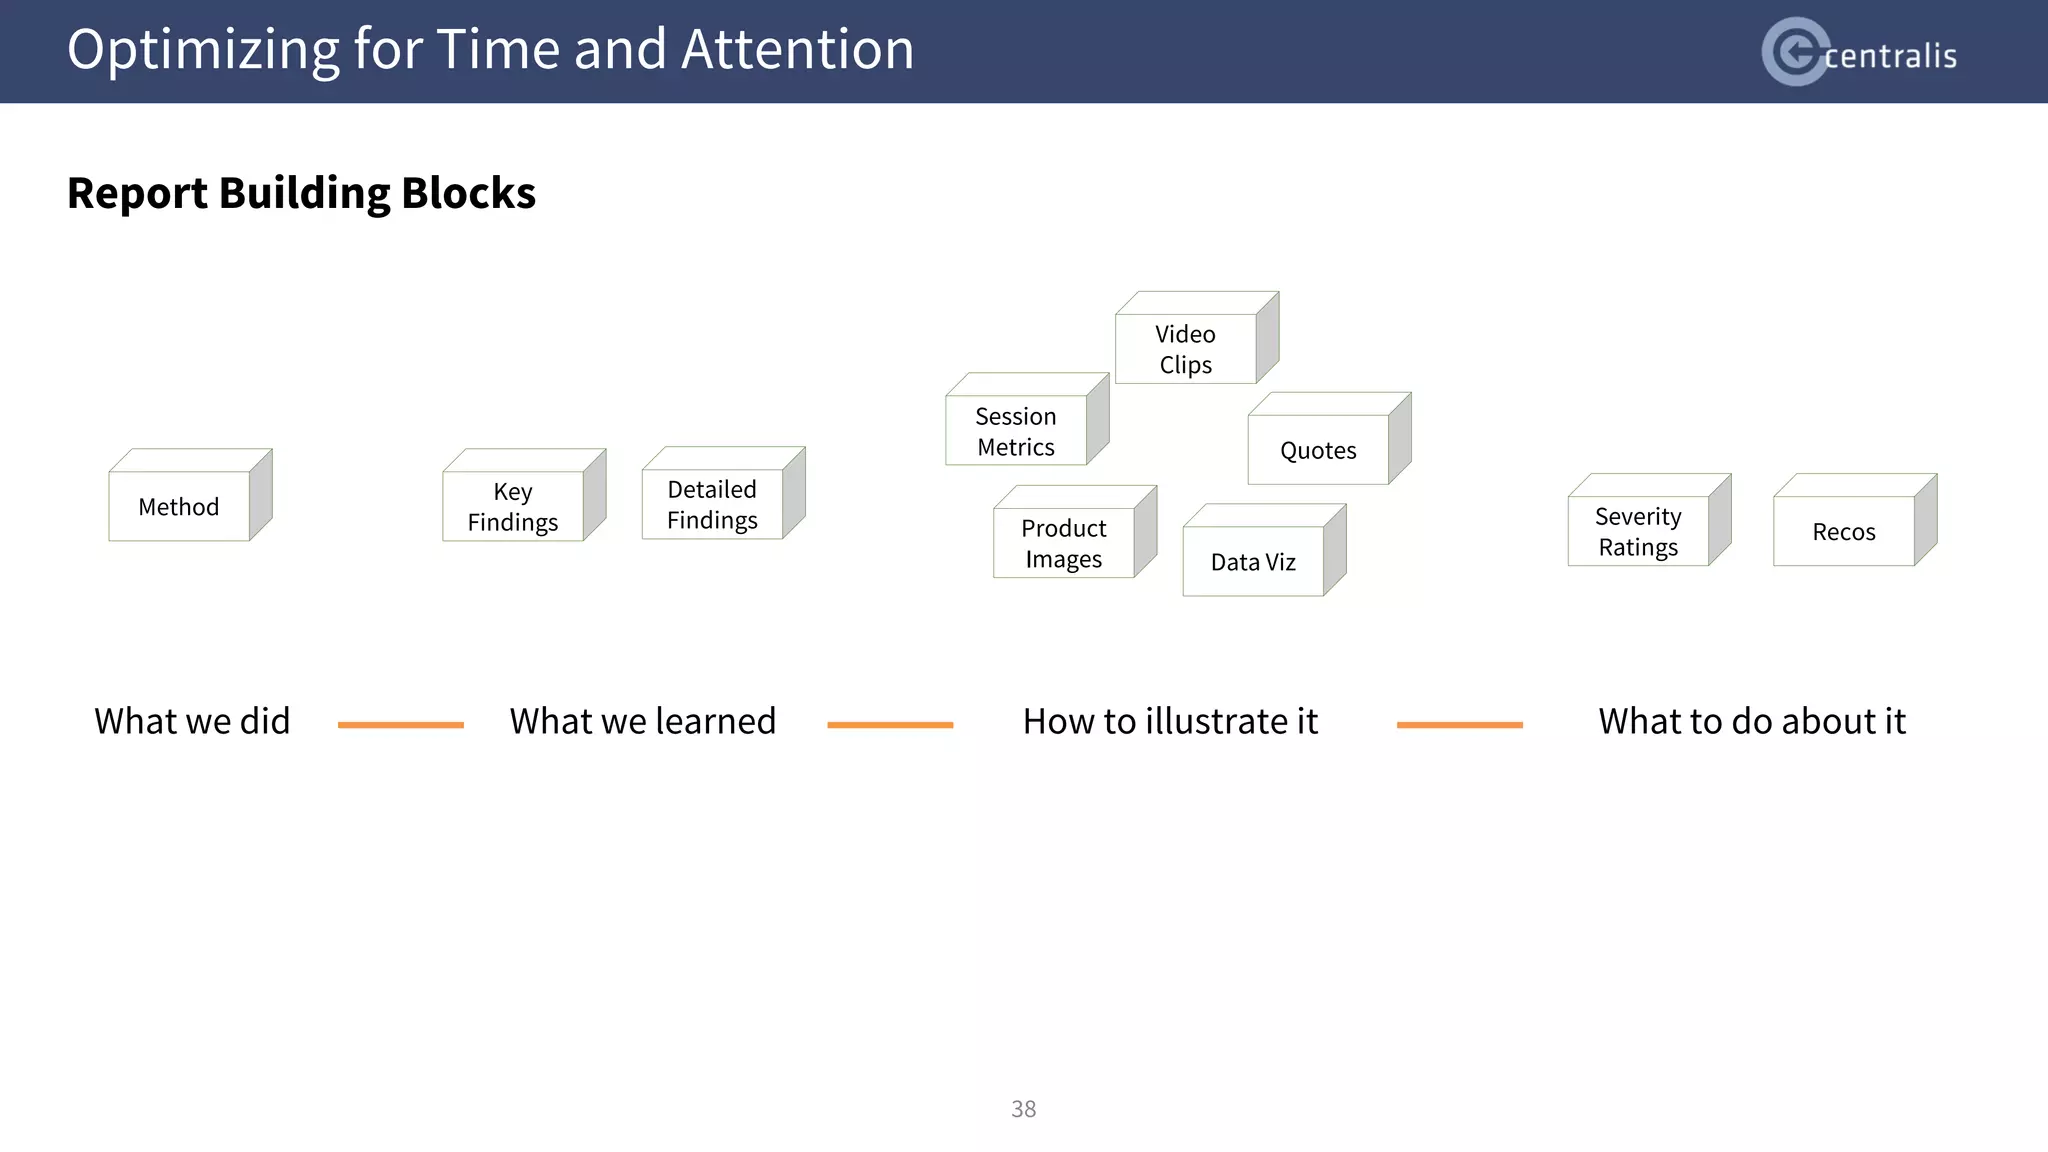

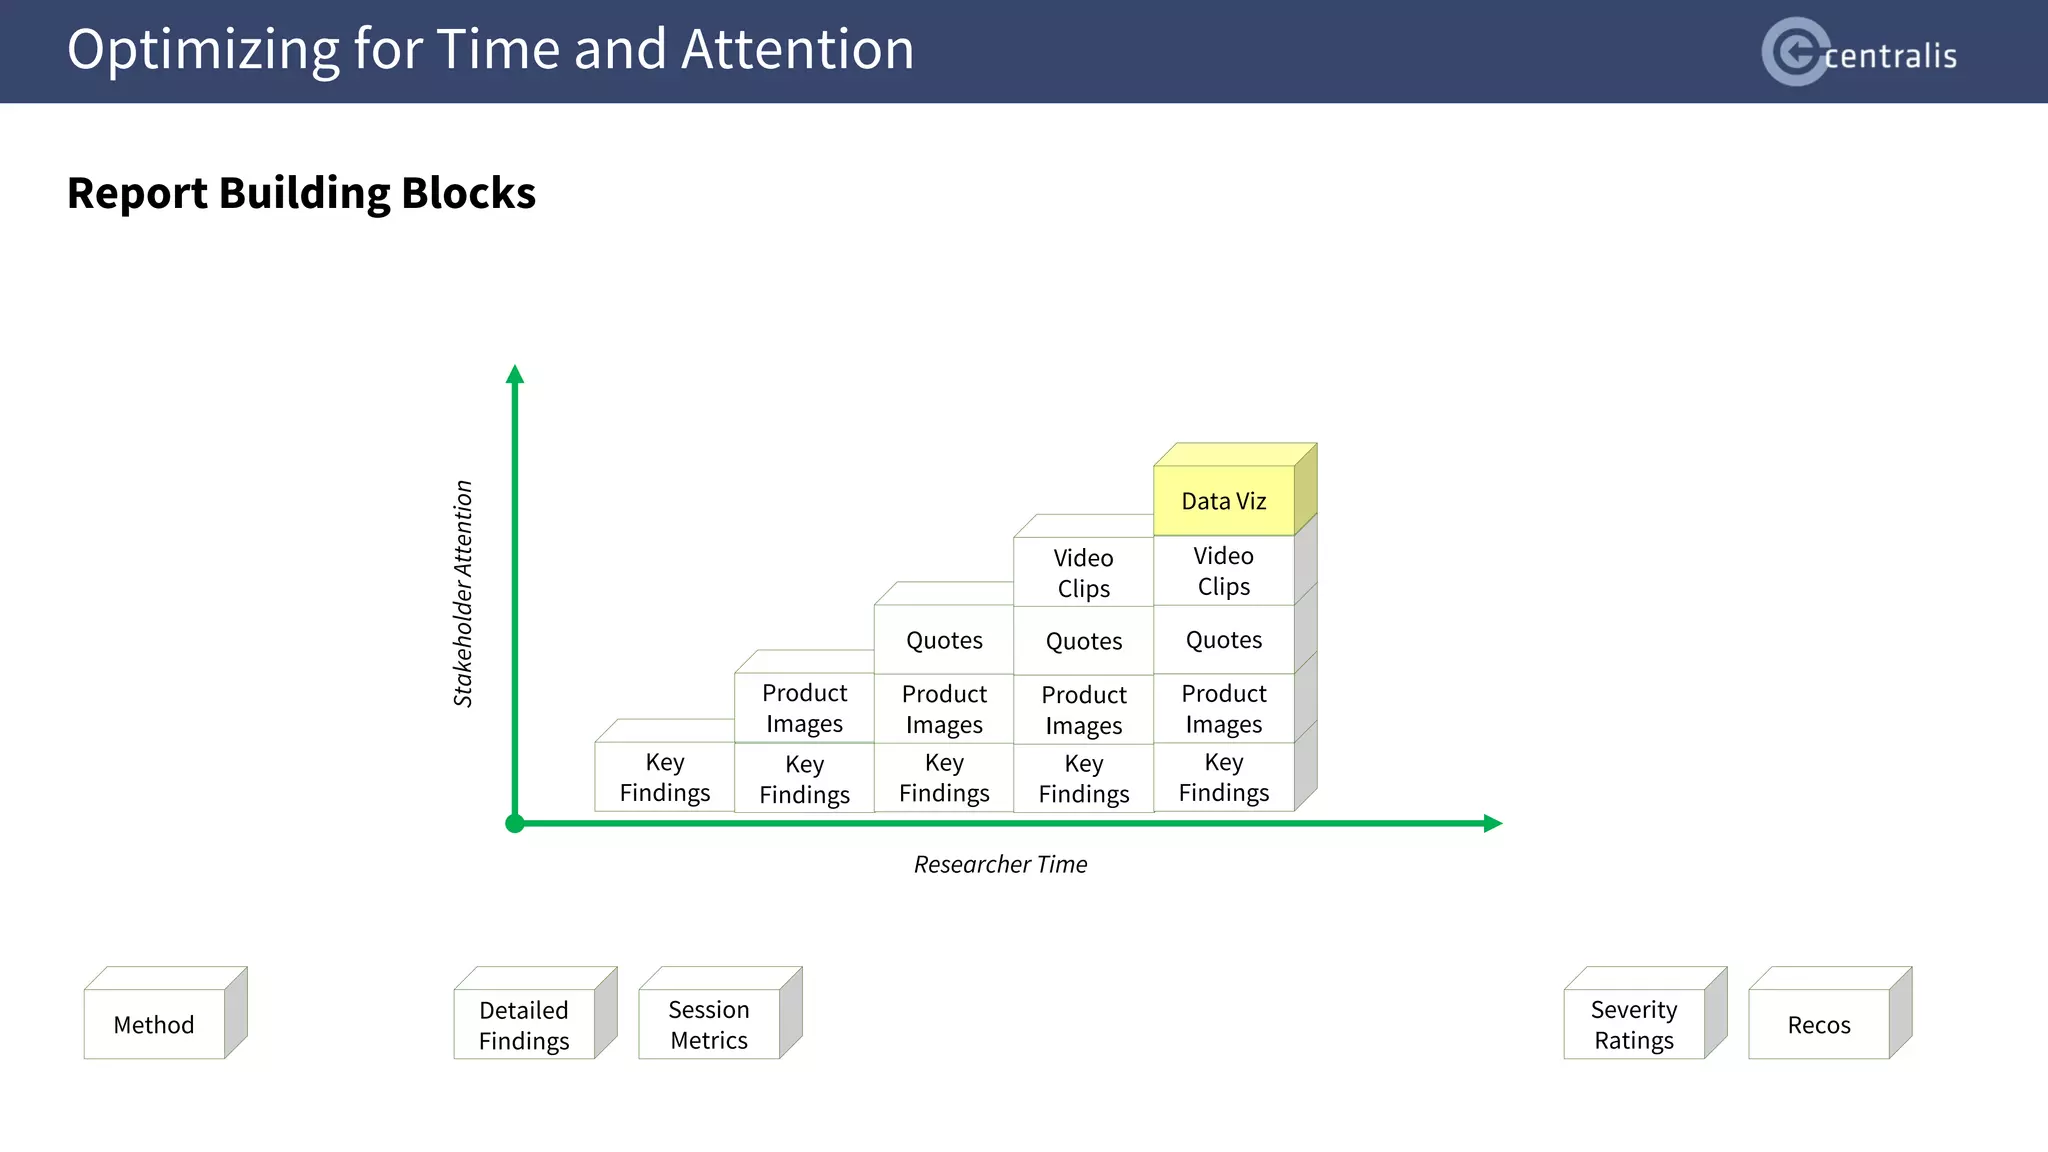
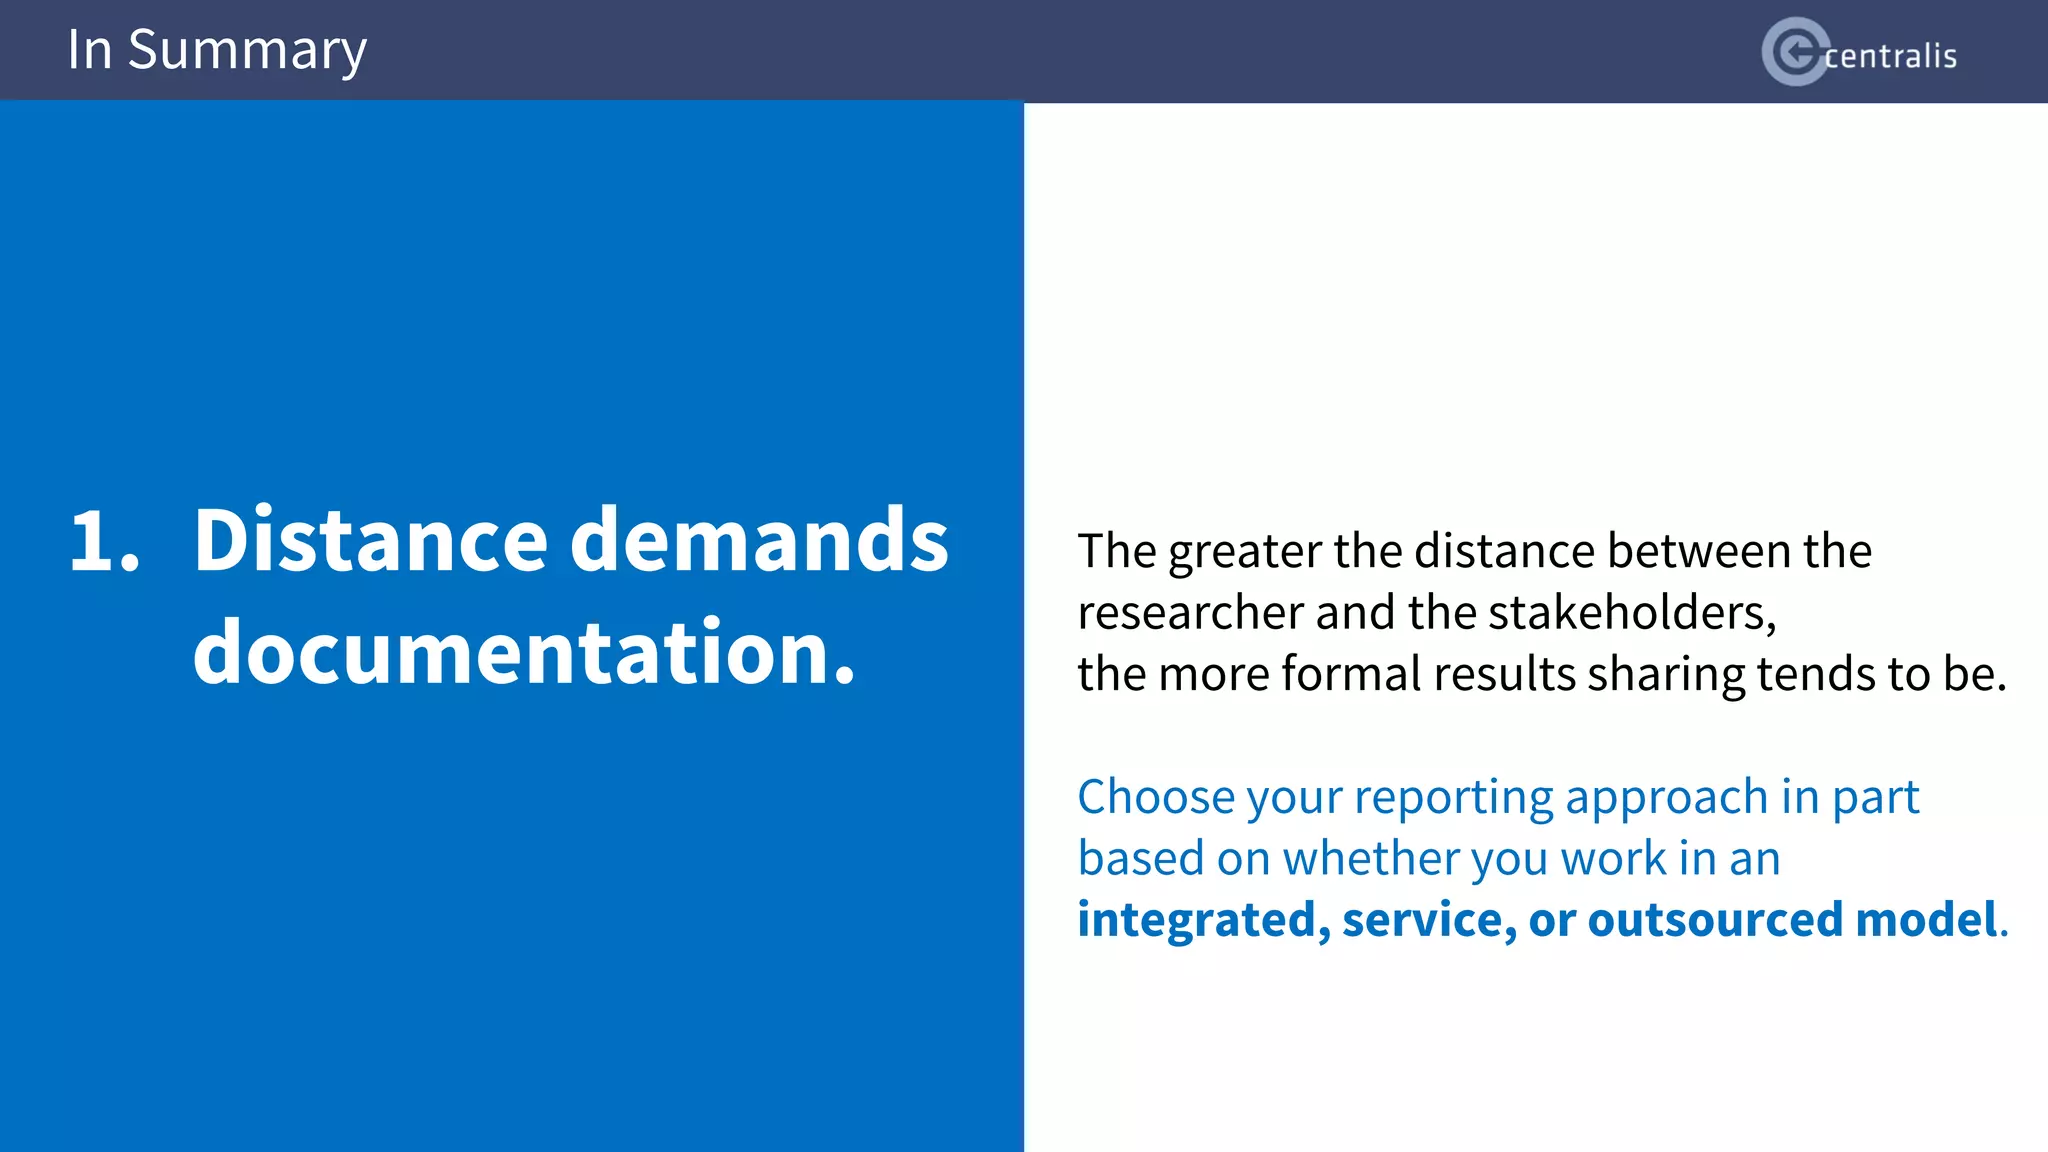
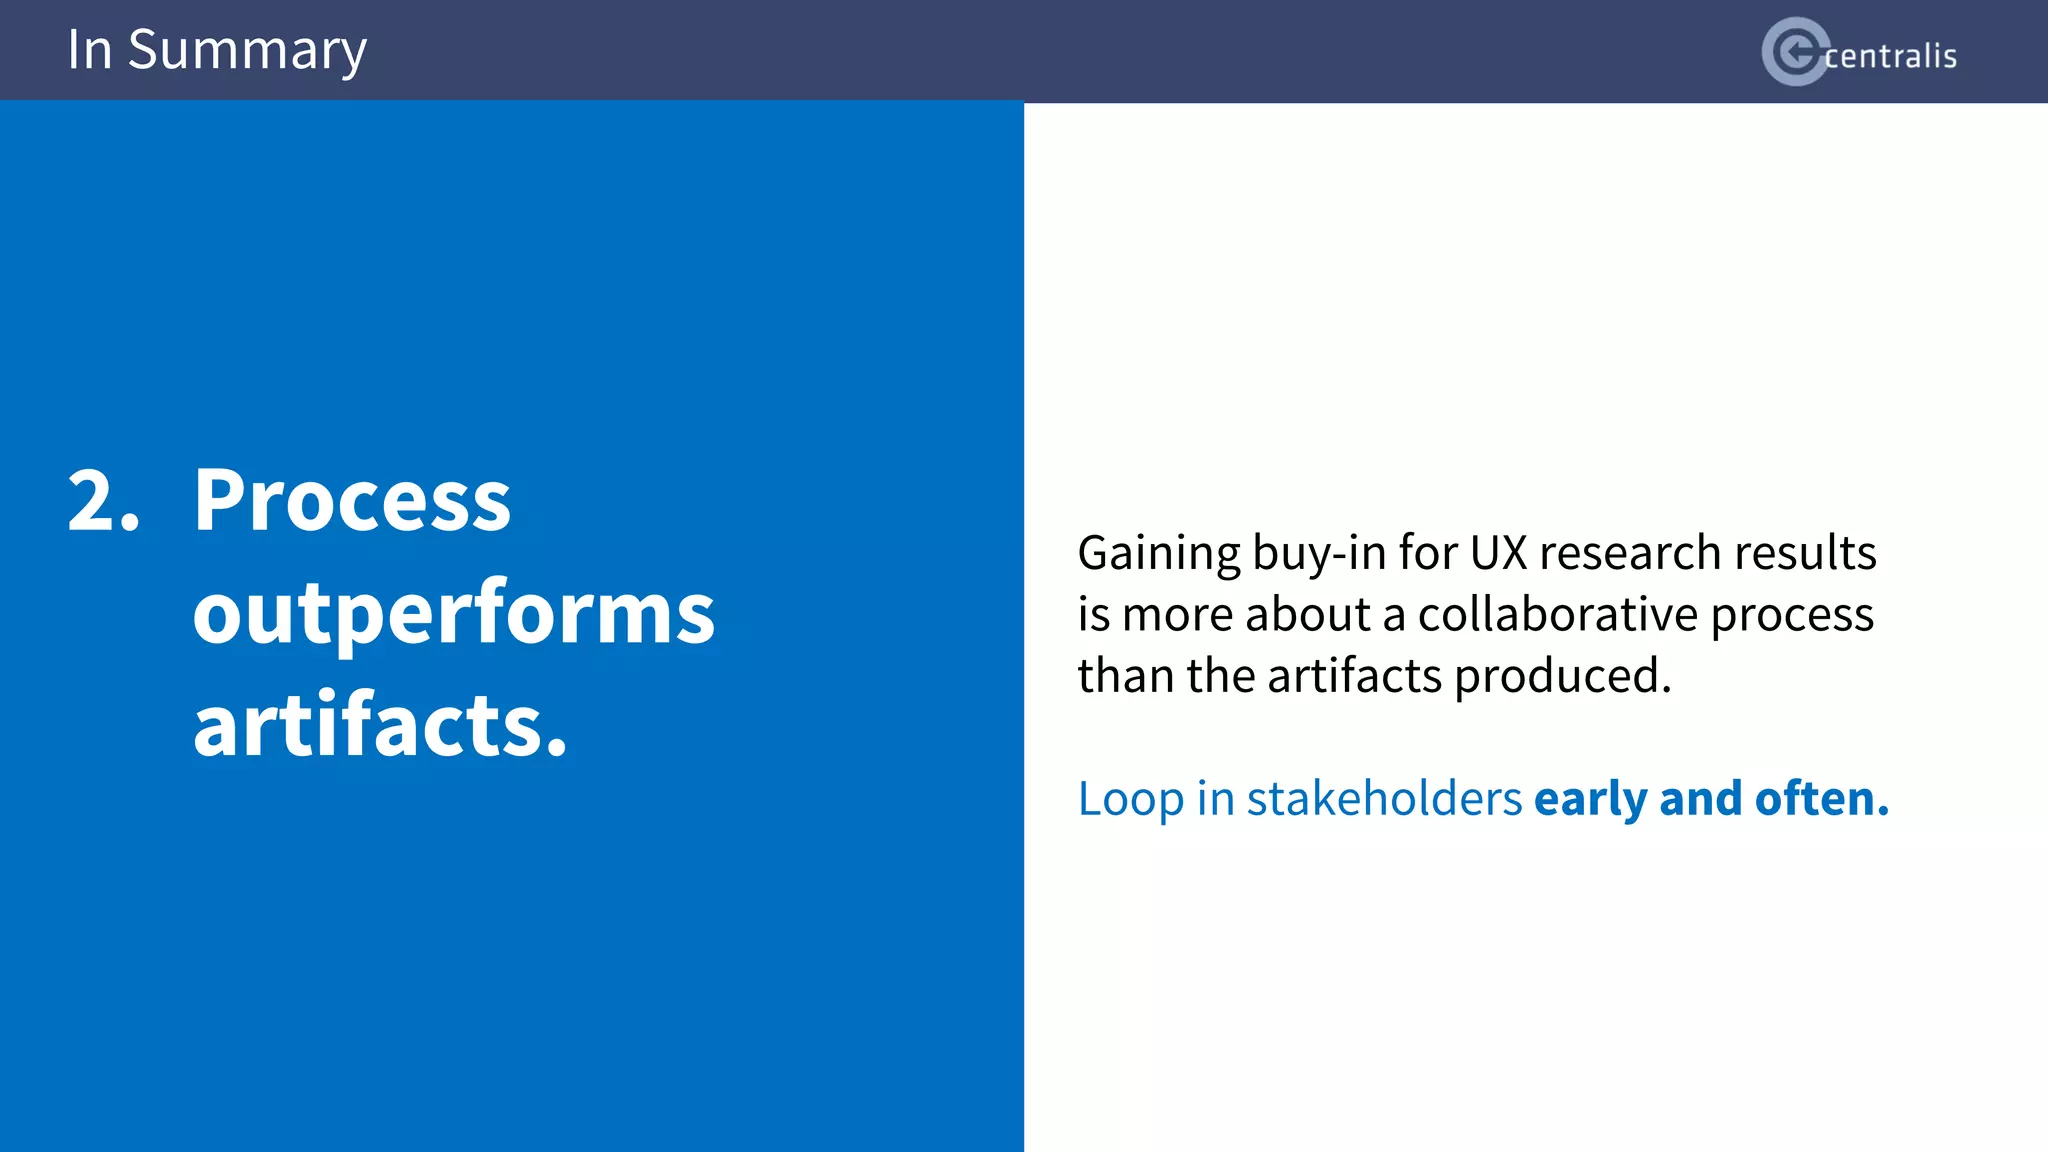
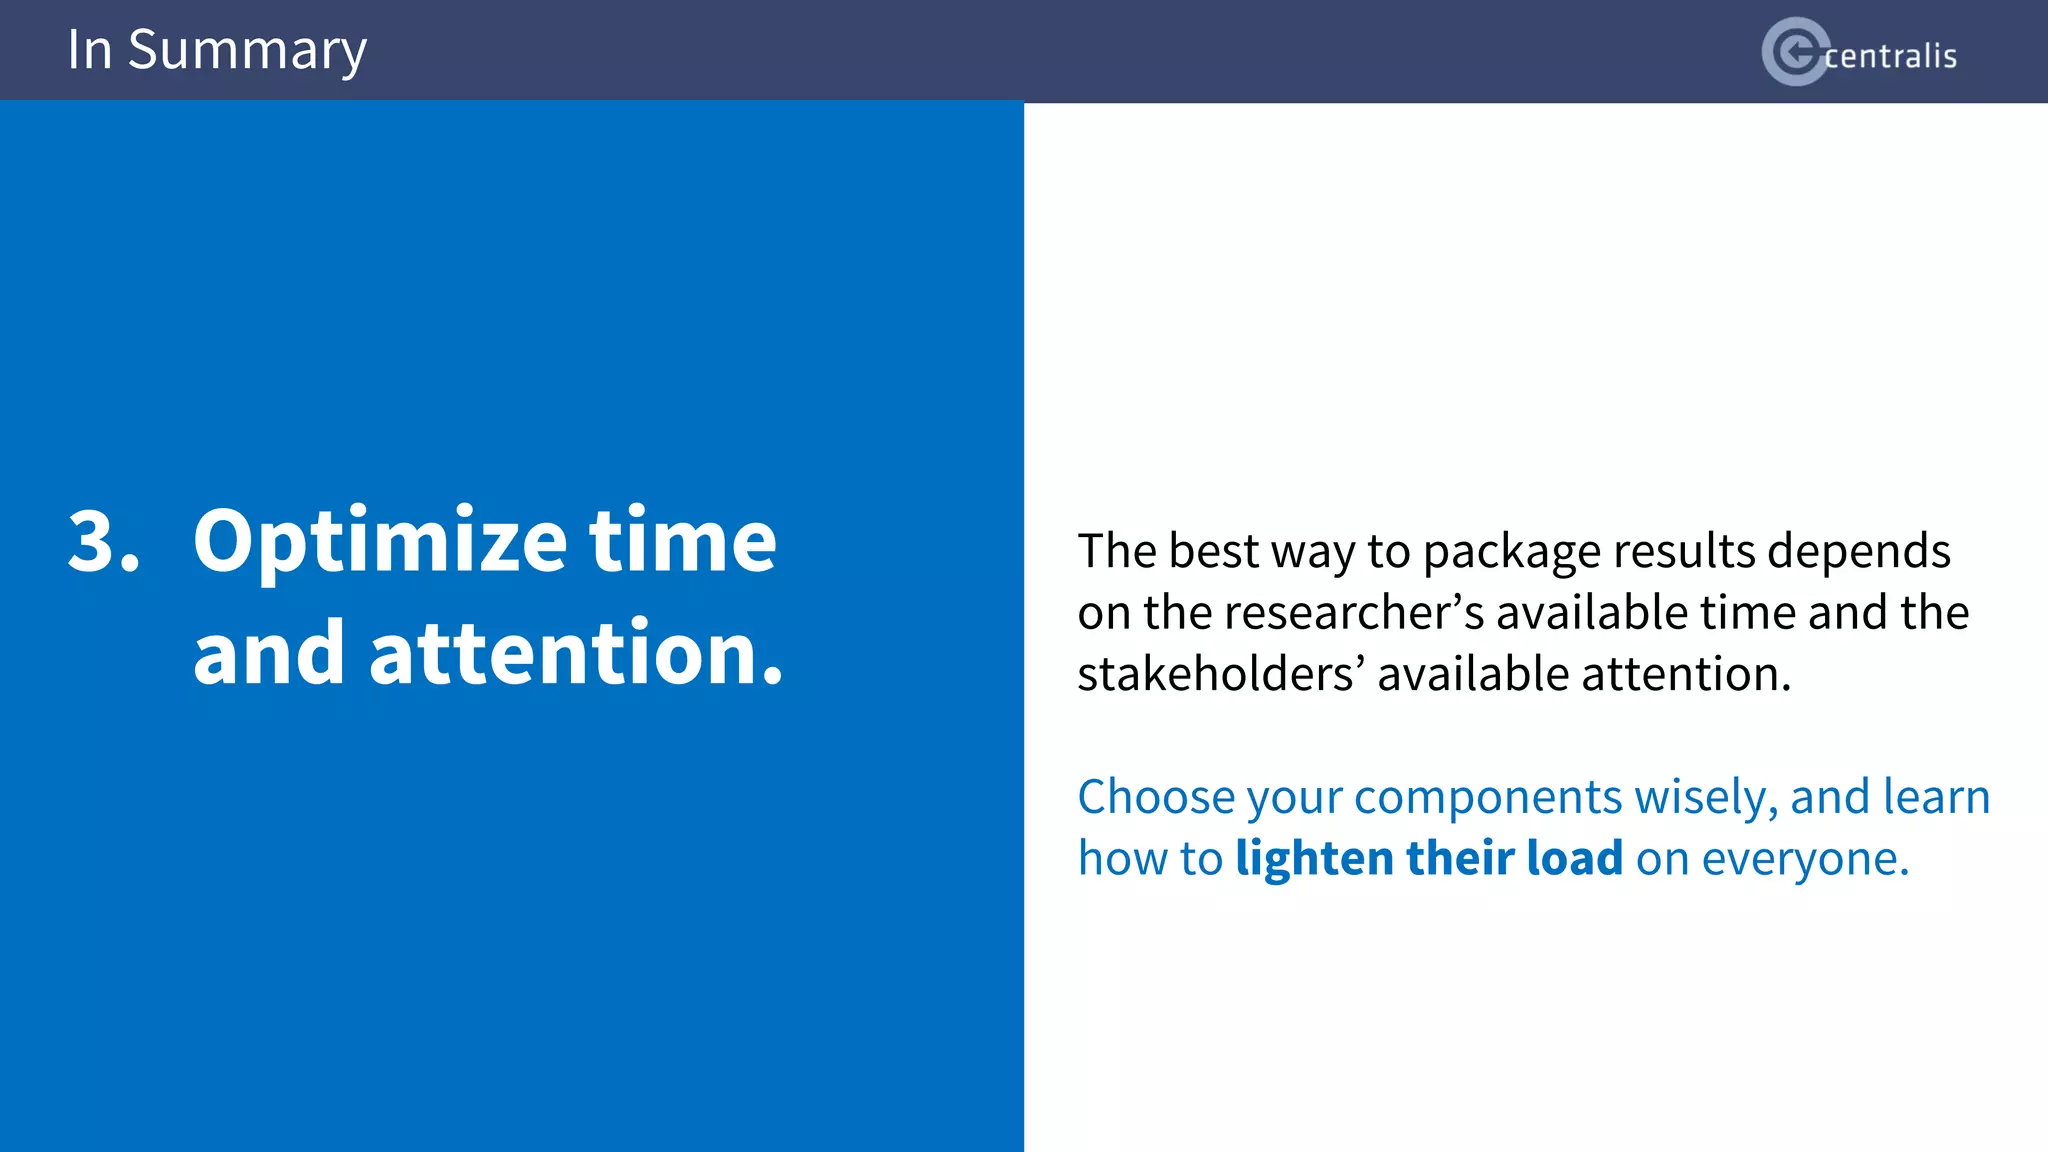

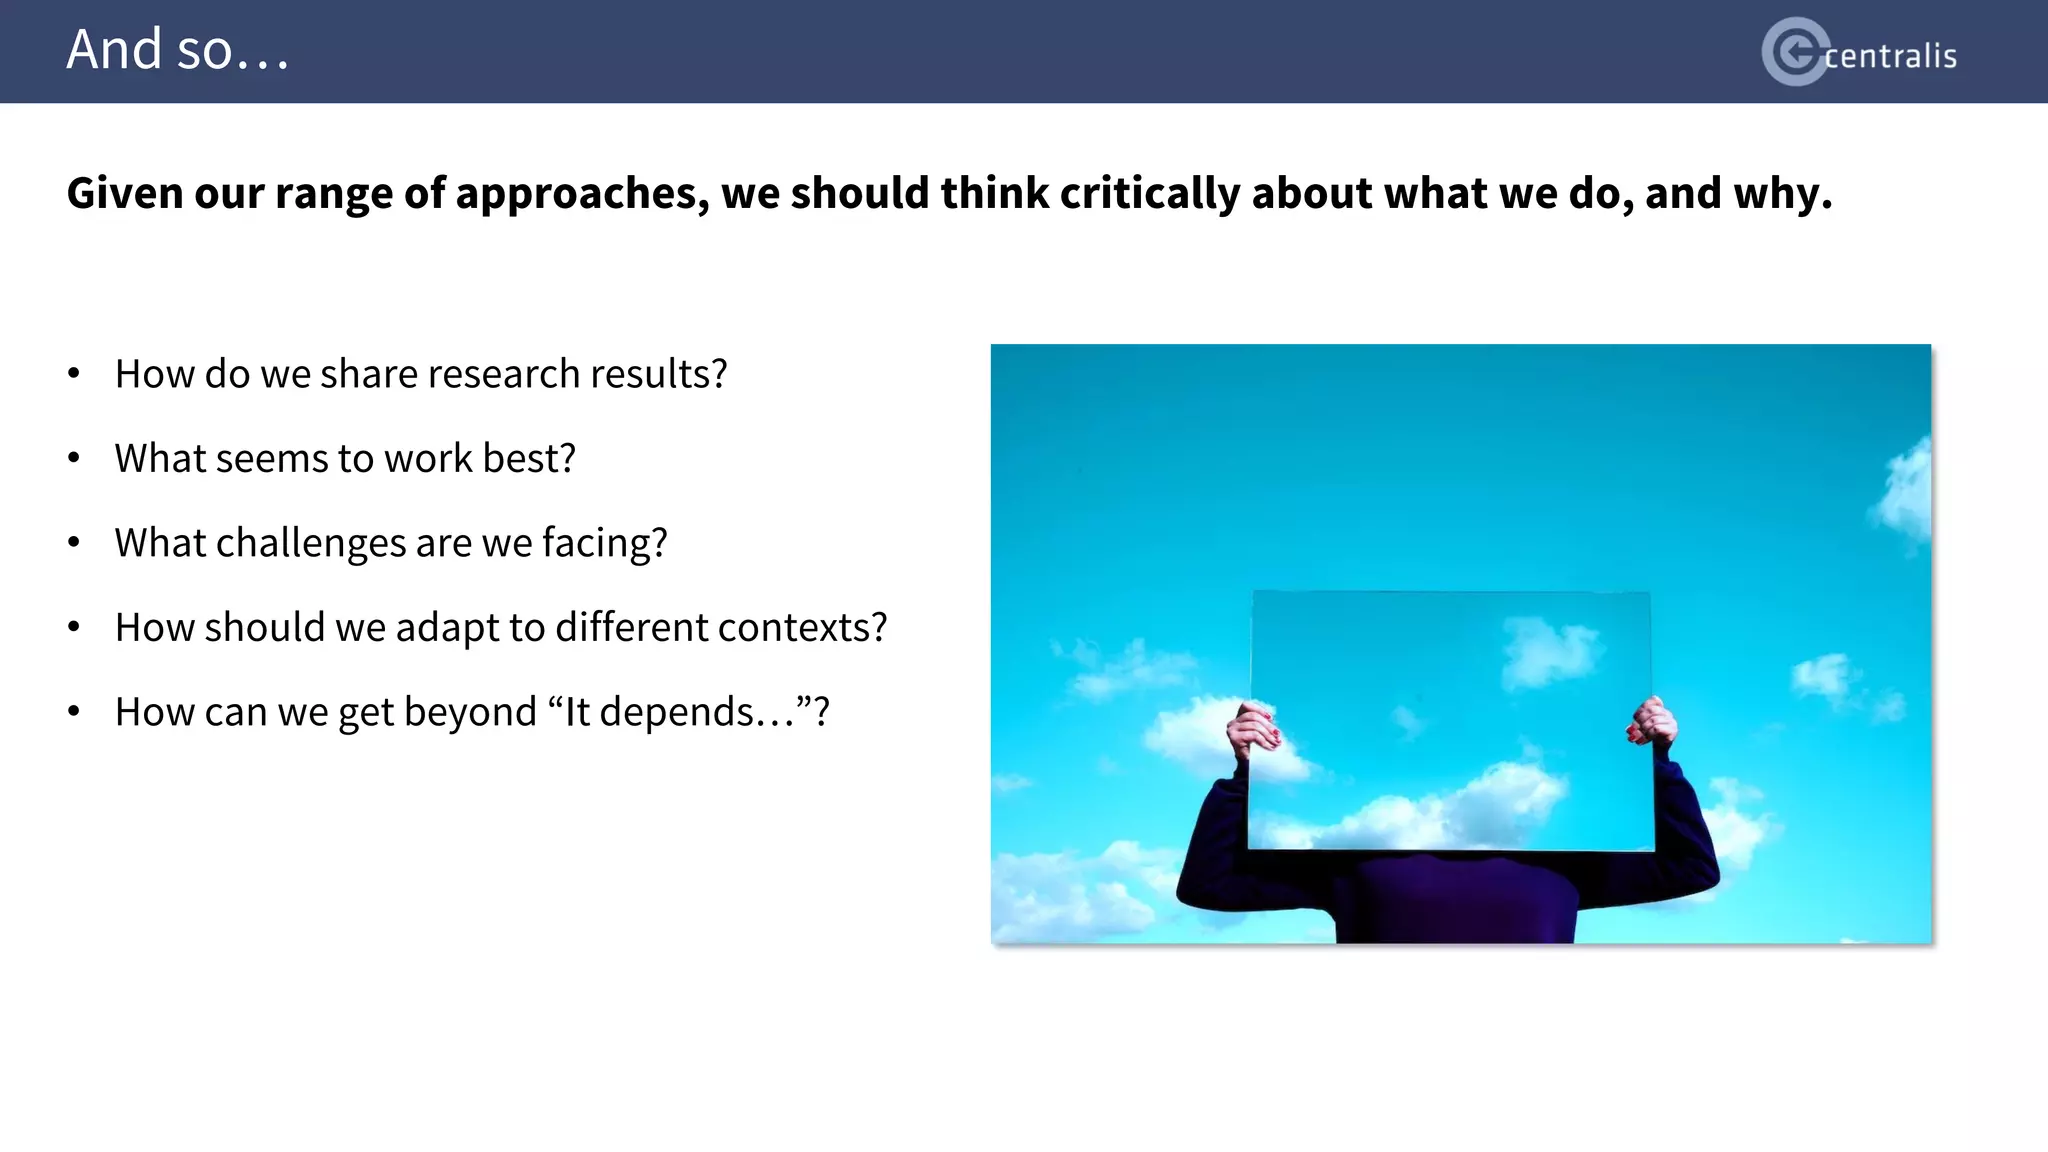
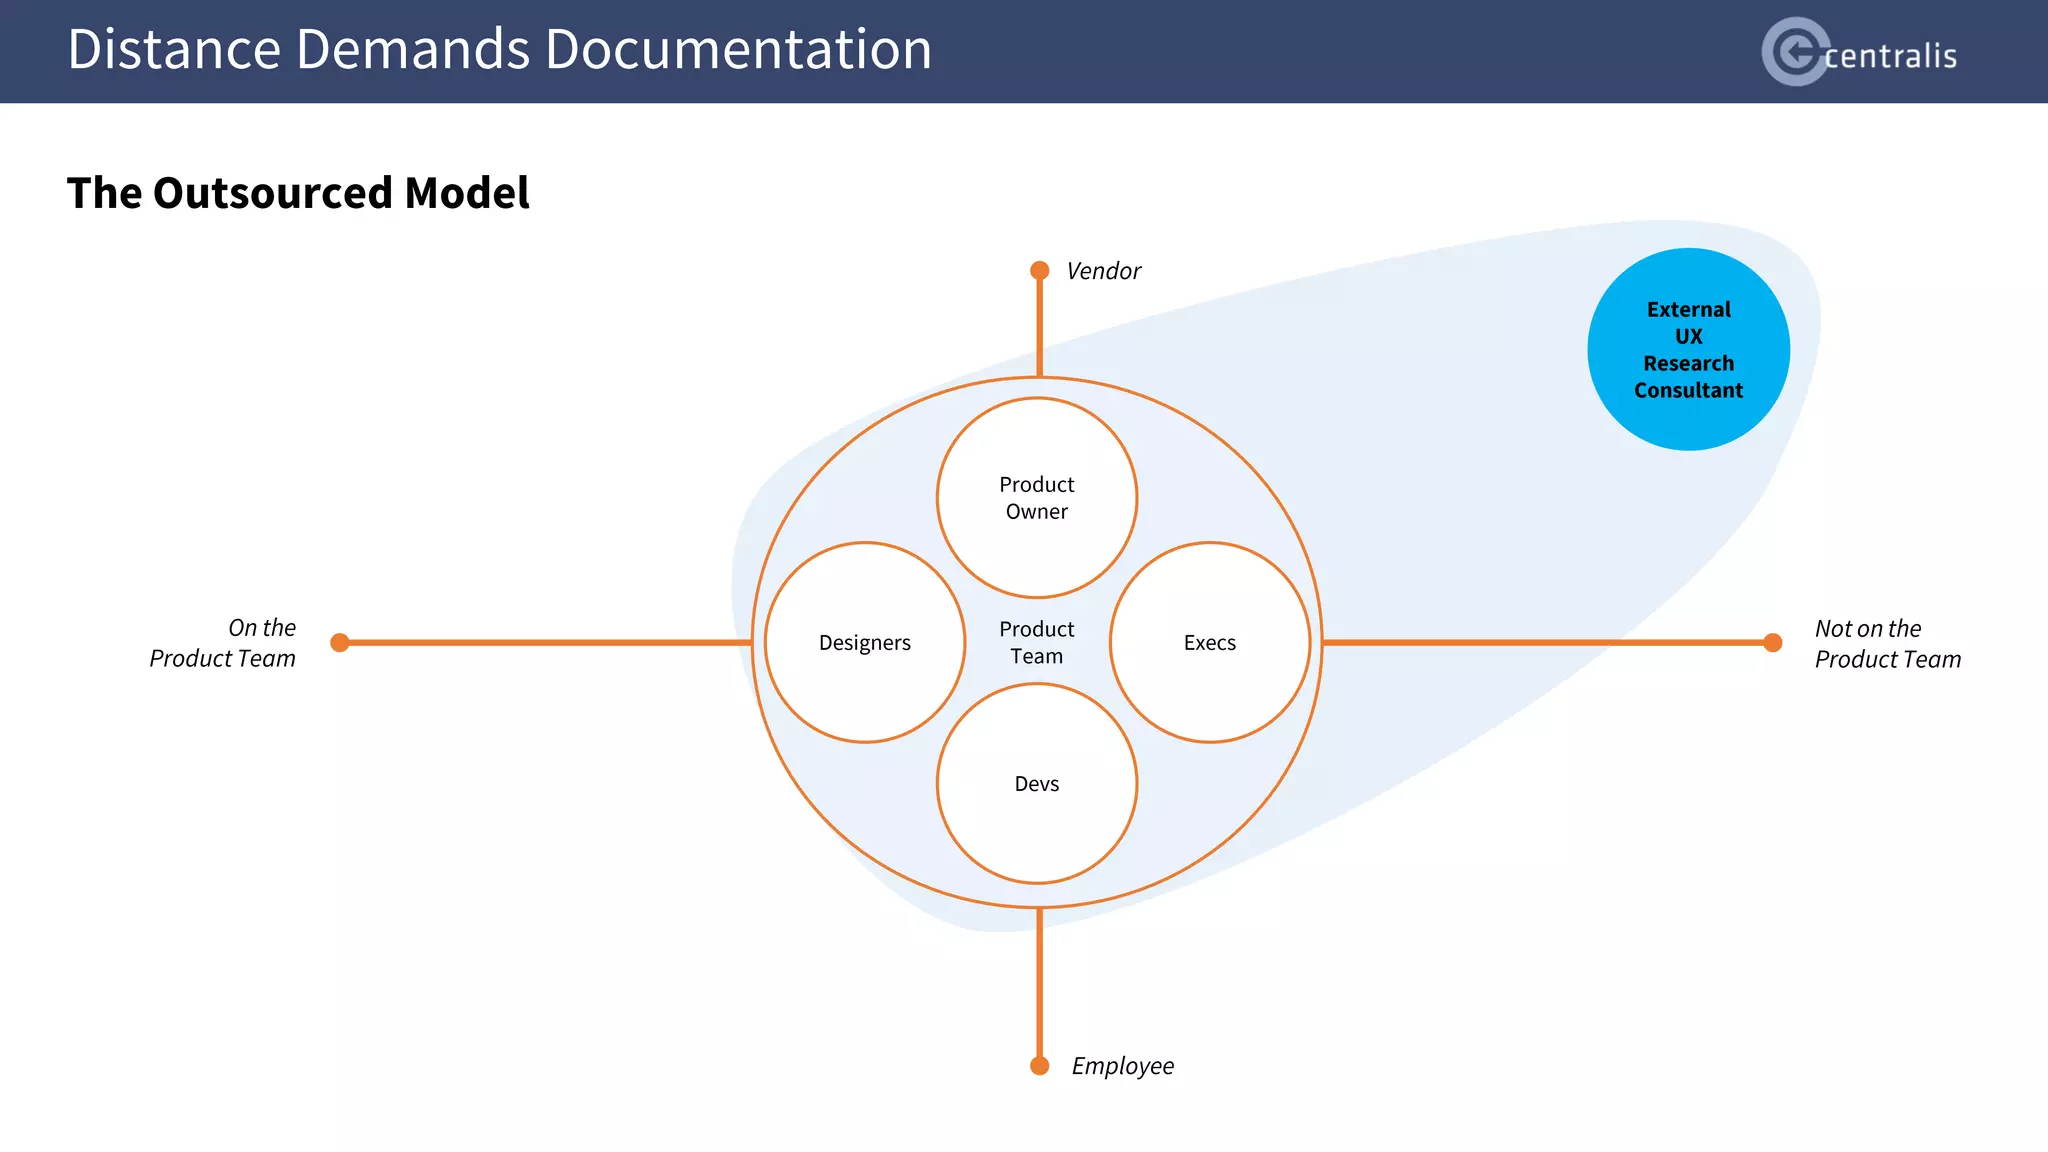
Kathi Kaiser's report emphasizes the evolution of UX research communication over 25 years, urging researchers to adapt their methods based on stakeholder proximity and context. Key insights reveal that successful sharing relies on collaboration and understanding audience attention, emphasizing process over artifacts for impactful results. In summary, the report argues that traditional reports may be outdated, advocating for dynamic engagement with stakeholders throughout the research process.


![[BROCHURE] Italy Tour Project | @SlideON](https://cdn.slidesharecdn.com/ss_thumbnails/brochure8-251215152319-2805af68-thumbnail.jpg?width=640&height=640&fit=bounds)


