Organic Soil and Water Management at the Arlington Agricultural Research Station
•
1 like•692 views


Recommended
More Related Content
What's hot
What's hot (19)
Similar to Organic Soil and Water Management at the Arlington Agricultural Research Station
Similar to Organic Soil and Water Management at the Arlington Agricultural Research Station (20)
Recently uploaded
Recently uploaded (20)
Organic Soil and Water Management at the Arlington Agricultural Research Station
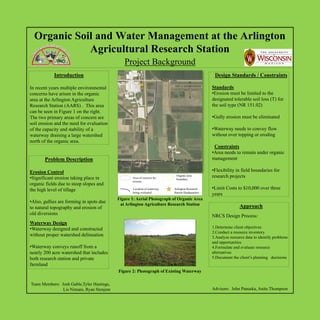
- 1. Organic Soil and Water Management at the Arlington Agricultural Research Station Project Background Introduction Design Standards / Constraints Badger Lane N In recent years multiple environmental Standards concerns have arisen in the organic •Erosion must be limited to the S area at the Arlington Agriculture designated tolerable soil loss (T) for Research Station (AARS) . This area the soil type (NR 151.02) can be seen in Figure 1 on the right. The two primary areas of concern are •Gully erosion must be eliminated Hopkins Road soil erosion and the need for evaluation of the capacity and stability of a •Waterway needs to convey flow waterway draining a large watershed without over topping or eroding north of the organic area. Constraints •Area needs to remain under organic Problem Description Ramsey Road management Erosion Control •Flexibility in field boundaries for •Significant erosion taking place in Area of concern for Organic area research projects boundary. erosion organic fields due to steep slopes and the high level of tillage Location of waterway Arlington Research •Limit Costs to $10,000 over three being evaluated Station Headquarters years Figure 1: Aerial Photograph of Organic Area •Also, gullies are forming in spots due at Arlington Agriculture Research Station Approach to natural topography and erosion of old diversions NRCS Design Process: Waterway Design •Waterway designed and constructed 1.Determine client objectives 2.Conduct a resource inventory without proper watershed delineation 3.Analyze resource data to identify problems and opportunities •Waterway conveys runoff from a 4.Formulate and evaluate resource nearly 200 acre watershed that includes alternatives both research station and private 5.Document the client’s planning decisions farmland Figure 2: Photograph of Existing Waterway Team Members: Josh Gable,Tyler Hastings, Lis Nimani, Ryan Stenjem Advisors: John Panuska, Anita Thompson
- 2. Organic Soil and Water Management at the Arlington Agricultural Research Station Waterway Analysis Purpose The Design Storm: SCS Type II HydroCAD In 2008, a grassed waterway was constructed 10–year, 24–hour storm The Stormwater Modeling Software, HydroCAD, uses hydrology principles that were developed by the NRCS as well as various to transport flows from an upstream hydraulic calculations. It uses the TR-55 method for calculating Time watershed, through the AARS Organic Corner of Concentration (tc) values and gives unique hydrographs through waterways, ponds, culverts and various other hydraulic components. (denoted with blue arrows in Figure 3). Because of the immediate need for the channel, a proper engineering design was not carried out. In order to verify that this waterway was adequately built, HydroCAD was used to model the watershed and waterway. Figure 4 Design Storm Unit Hydrograph, exported from HydroCAD Figure 1 Main Waterway, in Organic Corner, AARS Figure 6 HydroCAD Layout Map Results Figure 5 Design Storm Depth vs. Time Graph, exported from HydroCAD Figure 2 Cross-Section of Main Waterway Watershed Parameters The Contributing Watershed Table 1 Contributing Watershed Characteristics Sub - Time of Concentration, Tc Area (acres) Curve Number, CN Watershed (min) 1 8.2 76 15.6 2 13.4 77 23.2 3 34.4 70 37 Figure 7 Final Hydrograph for Main Waterway 4 42.5 76 32.1 5 127.2 76 78.4 Table 4 10-year, 24-hr Storm Results 6 9.2 76 13.1 Reach Channel Capacity (cfs) Peak Flow (cfs) Max Velocity (ft/s) 7 6.9 76 19.7 1 63.23 17.2 2.2 8 12.2 76 20.2 2 44.84 38.52 1.25 Table 2 Outlet Characteristics Main 316.5 141.34 5 Culvert Diameter (in) Length (ft) Slope (%) 1 24 50.3 2.25 Table 5 25-year, 24-hr Storm Results 2 18 38 1.37 Reach Channel Capacity (cfs) Peak Flow (cfs) Max Velocity (ft/s) 3 18 38 0.66 1 63.23 19.3 2.27 4 24 36 1.78 2 44.84 49.85 1.33 5 36 28.6 2.24 6 36 28.6 0.98 Main 316.5 208.5 5.57 7 18 24.3 3.29 Table 6 100-year, 24-hr Storm Results Table 3 Sub-Watershed Characteristics Reach Channel Capacity (cfs) Peak Flow (cfs) Max Velocity (ft/s) Trapezoidal Cross-Section Channel Length Channel Slope Reach Manning’s No. 1 63.23 20.71 2.32 bottom width (ft) depth (ft) side-slope (horizontal/vertical) (ft) (%) 2 44.84 72.86 1.44 1 10 1 10 1400 0.85 0.033 Main 316.5 257.95 5.9 2 8 1.5 10 1400 0.43 0.07 Main 12 2 6.7 1050 0.84 0.026 Conclusion In modeling the upstream watershed, culverts After completing the HydroCAD model were modeled as outlets to ponds with storage analyzing the waterway in the Organic Corner behind. Where water had the potential to flow and its upstream watershed, we have Figure 3 Contour Map of Watershed with 4 ft Contours over a roadway upon a culvert reaching capacity, determined that the current waterway is more Waterway – Organic Corner the roadway way was treated as a broad-crested than adequate for handling flows from the Watershed Boundary weir as an outlet to a pond. 4 ft Contour Lines design storm.
- 3. Organic Soil and Water Management at the Arlington Agricultural Research Station Erosion Management Problem Description Field Soil Slope Slope Design Options (%) Loss Length (ton/ac/yr) (ft) •Steep Slopes and intensive tillage •Option 1 – Implement strip cropping operations have lead to erosion. 401 4.3 140 3.7 and make three fields of equal width 402 2.9 160 2.5 out of fields 447 A and B, and also for •The DNR requires that erosion be 403 A 2.4 160 2.0 fields 404 and 403C-S and N. less than the designated tolerable soil 403 B 3.4 155 3.0 Field Soil Loss loss (T) for the soil type. (NR 403 C-N 6.5 180 4.9 (ton/ac/yr) 151.02). 403 C-S 5.5 180 4.5 401 4.3 404 7.4 175 5.6 402 2.9 •The tolerable soil loss for the 446 3.3 150 2.3 403 A 2.4 Organic Fields are 5 ton/acre/year. 447 A 4.9 175 4.1 403 B 3.4 (Web Soil Survey). 447 B 4.5 175 3.5 403 C-N Figure 1: Current field boundaries with respective 403 C-S 4.8 •Fields 403 C-N, 403 C-S, and 404 soil loss and LS Inputs. 404 are currently above T, and fields 447 Universal Soil Loss Equation 446 2.6 A and B are near T (Figure 1), so they A=RKLSCP 447 A 4.1 require best management practices, R Rainfall Erosivity Factor 447 B Figure 4: Soil loss after strip cropping such as strip cropping, terracing, or K Soil Erodibility Factor contouring, in order to reduce soil LS Topographic Factor (Slope Length and loss. Slope) •Option 2 – Design a terrace system to CP Cropping Management Factors break up the slope length along the steepest slopes Figure 2: USLE Equation RUSLE2 Field Soil Loss (ton/ac/yr) 401 4.3 •Is a computer program that utilizes 402 2.9 the Universal Soil Loss Equation 403 A 2.4 (USLE) to model rill and interrill 403 B 3.4 erosion. See Figure 2. 404 403 C-N 4.3 •Used a crop rotation of Winter 403 C-S wheat, 3 years alfalfa, Corn grain, 446 2.6 soybeans. 447 A 3.9 Figure 3: Screen shot of RUSLE2 447 B •Tillage operations of chisel plow and Figure 5: Soil loss after terraced disk before planting and 2-3 cultivations during spring.
- 4. Organic Soil and Water Management at the Arlington Agricultural Research Station Designs and Recommendations Designs and Recommendations Final Terrace Design Q = 2.0 ft3/s (determined from HydroCAD) Waterway Vpermissible = 1.5 - 5 ft/s In evaluating the waterway it was determined A = 3.5 ft2 that the current channel will be sufficient to S=2% handle the peak flow from a 10 yr – 24 hour storm event. This determination was made primarily using the results from the HydroCAD model. Erosion Control After Conversations with the Arlington Research Station staff a modified plan was devised. The impact of this proposed plan on erosion rates can be seen in Table 1. Figure 2: Proposed Terrace Cross Section •Terraces will be implemented in fields 404 and 403C (See Figure1 and Figure 2) Table 1: Proposal Impact on Erosion •A diversion will be cut along the top of field Rates 447 A to reduce the occurrence of gulley Field Current Expected erosion. (See Figure 1) Soil Loss Soil Loss Figure 1: Location for Proposed Construction (ton/ac/yr) (ton/ac/yr) •Strip Cropping is also recommended in the 401 4.3 4.3 area of fields 447 A and 447 B. Terrace Spacing Calculation 402 2.9 2.9 H.I. = (xs + y) (100/s) 403 A 2.4 2.4 •Impact of proposal can be seen in Table 1 403 B 3.4 3.4 H.I. = horizontal interval in feet 403 C-N 6.5 4.3 Channel Capacity Calculation x = constant determined by geographic location 403 C-S 5.5 4.3 Q = V*A s = land slope in percent 404 7.4 4.3 V = (1.49/n) * R(2/3)*S(1/2) y = constant determined by cropping and soil erodibility 446 3.3 3.3 447 A 4.9 4.1 Q = Peak flow rate in Channel (ft3/s) V = Flow velocity (ft/s) H.I .= (0.5 * 6 + 4) (100/6) 447 B 4.5 4.1 A = Cross sectional area of channel n = Manning’s Roughness Coefficient (varies H.I. = 140 depending on vegetation growth from 0.035 *raised to 150 feet due to farming equipment to 0.075) restrictions Special Thanks to: R = Hydraulic radius of channel (ft) Jeff Breuer, Darwin Frye, Scott S = Channel slope (ft/ft) Mueller, Matt Repking, Anita Thompson, and John Panuska