2. detecting and delineating faults and fractures (Gregory and Durrance,
1985; Toutain and Baubron, 1999; Guerra and Lombardi, 2001; Walia
et al., 2005, 2008; Yang et al., 2005).
The enrichment of radon (Rn), carbon dioxide (CO2) and mercury
(Hg) in soil or soil gas has been observed in several geothermal areas
(e.g., Koga, 1982; Varekamp and Buseck, 1983; Chuaviroj et al., 1987;
Lescinsky et al., 1987; Klusman, 1993; Murray, 1997). Radon is a ra-
dioactive noble gas that is soluble in water and decays by alpha emis-
sion. The presence of Rn in geothermal areas is a function of the
porosity and fracture distribution of the rocks in between the deep
geothermal source and the surface, i.e., the pathway for uprising
fluids (Koga, 1988). Radon gas surveys are widely used to monitor
seismic activity and to detect the locations of fractures and faults
(Walia et al., 2005; Yang et al., 2005).
Soil and soil gas surveys of Hg have been successfully used as geo-
thermal exploration techniques. Van Kooten (1987), Lescinsky et al.
(1987) and Murray (1997) all found broad Hg anomalies outlining
high-temperature thermal activity zones. Soil Hg surveys has also
been used to locate faults in volcanic and geothermal regions
(Klusman and Landress, 1979; Cox and Cuff, 1980; Varekamp and
Buseck, 1983). In the sub-surface, Hg is strongly partitioned into the
ascending vapor and is transported to the surface as elemental Hg.
This vapor is absorbed onto organic matter and clay minerals in the
shallow, low-temperature soil horizons, producing elevated (above
10 ppm) concentrations of Hg (Nicholson, 1993). Mercury is
absorbed by the soil in anomalous concentrations relative to the sur-
rounding areas (Lescinsky et al., 1987; Van Kooten, 1987). Mercury
levels in soil are the result of accumulation and loss processes; conse-
quently, soil gas mercury is a reliable indicator of geothermal fluid at
depth (Koga, 1988).
The present study aimed to i) delineate the up-flow zone of high
temperature geothermal fluids at depth, fractures below the surface,
in the Ungaran geothermal field using a soil gas survey; ii) character-
ize chemical characteristics of hot spring waters in the Ungaran geo-
thermal field; and iii) develop a hydro-geochemical conceptual model
of thermal water in the Ungaran geothermal field.
2. Geological setting
Geothermal areas in Central Java, including the Ungaran volcano,
are located in the Quaternary Volcanic Belt (Solo Zone) (Fig. 1). This
belt is located between the North Serayu Mountains and the Kendeng
Zone and contains numerous Quaternary eruptive centers, including
Dieng, Sindoro, Sumbing, Ungaran, Soropati, Telomoyo, Merapi,
Muria, and Lawu (Van Bemmelen, 1970; Thanden et al., 1996)
(Fig. 1). A structural analysis of this area revealed that the Ungaran
volcanic system is primarily controlled by the Ungaran collapse struc-
ture that runs from west to southeast of the Ungaran volcano. Old vol-
canic rocks of the pre-caldera formation are controlled by northwest–
southwest and southeast–southwest fault systems. The post-caldera
volcanic rocks, however, do not seem to be structurally controlled
by the regional faulting system (Budiardjo et al., 1997). The pre-
caldera volcanic rocks and the Tertiary marine sedimentary rocks
Fig. 1. Location of the Ungaran volcano (solid red circle).
24 N.K. Phuong et al. / Journal of Volcanology and Geothermal Research 229-230 (2012) 23–33
3. are inferred to be the main geothermal reservoir rocks (Budiardjo et
al., 1997).
Van Bemmelen (1970) noted that there is a gradual development of
volcanism along the transverse fault from north to south, starting in the
north with the Oldest or Proto-Ungaran in the Lower Pleistocene and
ending in the south with the very active Merapi volcano (Fig. 1). Two
generation of the Ungaran volcano (2050 m) were observed because
of gravitational collapse. The Oldest Ungaran deposits resulted from
submarine activity. Its basement is transitional beds, in which the facies
changes from marine into fresh water deposits consisting of coarse
polymictic conglomerates of the Lower Damar Beds. After magma
broke through the crust, the Oldest Ungaran volcano originated at the
eastern end of the crest. The coarse volcanic breccias of the Middle
Damar Beds, and the coarse conglomerates, tuff-sandstones and black-
clay of the Upper Damar Beds occur at the northern foot of the Oldest
Ungaran volcano. In the Upper Pleistocene, volcanic activity was
wide-spread. In the eastern part of the northern Serayu Range, volcanic
activity built up the Old Ungaran volcano, which is the second genera-
tion of Ungaran volcano. The breccias at its northern foot form the
Notopuro Beds, which cover the breccias of the Oldest Ungaran in the
Damar Beds with an angular unconformity. After the early Pleistocene
phase of volcanic growth, volcanic activity continued until the Holocene,
building up the Young Ungaran volcano, which consists of pyroclastic
flow deposits, pyroclastic lava and alluvial deposits.
The Ungaran geothermal system is associated with the Upper
Quaternary volcanism of the Ungaran volcano. The volcanic rocks
are rich in alkali metals and are classified as trachyandesite to trachy-
basaltic andesite, primarily containing plagioclase, sanidine and cris-
tobalite (Budiardjo et al., 1997; Kohno et al., 2005). Gedongsongo is
the main geothermal area on the southern flank of the Ungaran volca-
no (Fig. 2). The Gedongsongo area is characterized by the presence of
fumaroles (90–110 °C), neutral pH bicarbonate warm/hot springs and
diluted steam heated hot spring (22–80 °C) with underground tem-
peratures of 20 °C to 82 °C measured from 1 m depth. According to
Budiardjo et al. (1997), the composition of thermal spring waters at
Gedongsongo can be divided into two water types. The hot water
around the fumarolic area originates as a steam heated meteoric
water characterized by low chloride content (similar to local surface
water), high sulfate content (up to 1000 ppm), and low pH (up to
5) while neutral bicarbonate or chloride waters are located at
the other areas. Based on the analysis of soil and rocks samples col-
lected around the Ungaran volcano, Kohno et al. (2005) concluded
that quartz, halloysite and alunite are the main secondary minerals
found in the hydrothermal alteration zones. Quartz is formed by the
alteration of cristobalite from Ungaran rocks, while halloysite and
alunite are minerals formed by alteration s due to acidic and low tem-
perature hydrothermal waters.
3. Sampling and measurement
The study area is focused on the Gedongsongo area (Fig. 2), which
is the main geothermal prospect in the Ungaran area, located in
the southern part of the Ungaran volcano. Water samples (UW-1 to
UW-7A and UW-7B) were collected around the Gedongsongo area
where comprises a volcanic complex terrain at an altitude ranging
from 1200 to 2000 m above sea level. Others samples (UW-8A, UW-
8B and UW9), however, were collected at Kendalisodo area (approxi-
mately 8 km far from the Gedongsongo area) with altitude at 600 m
above sea level.
3.1. Chemical analysis of water
Water sampling was complemented by in situ measurement of pH,
temperature and conductivity. The water samples were filtered through
0.45 μm membrane filters prior to storage in sterile polyethylene bottles
(HDPE). Samples for cation (Li, NH4, Na, K, Mg and Ca) and silica (SiO2)
analyses were collected in plastic bottles that had been acidified with
1 mL of concentrated HCl. Filtered, un-acidified samples were collected
for anions (F, Cl, HCO3, SO4) analysis. All water analyses were conducted
at Kyushu University using standard methods. Cations and anions
were analyzed using ion chromatography (Dionex ICS-90) while boron
(B) was analyzed using ICP-AES (Vista-MPX). SiO2 contents was deter-
mined by colorimetry and analyzed using a digital spectrophotometer
(Hitachi U-1100) (APHA, 2005), while HCO3 was analyzed by titration
with 0.1 M HCl. The analytical error for techniques was ≤5%.
An aliquot of the water samples (20 mL) was collected and stored
in sterile polyethylene bottles (HDPE) for stable isotope analysis.
Water isotopes (δ18
O and δD) were determined using the CO2–H2
equilibration method (Epstein and Mayeda, 1953). Then, the isotope
ratios were measured using the DELTA Plus mass-spectrometer at
Fukuoka University, Japan. These internal standards were calibrated
using international reference materials V-SMOW and SLAP with
analytical precisions of ±0.1‰ for δ18
O and ±1‰ for δD.
Fig. 2. Sampling sites and geological map of the study area (UTM coordination system).
25N.K. Phuong et al. / Journal of Volcanology and Geothermal Research 229-230 (2012) 23–33
4. 3.2. Soil gas measurement
Soil gas surveys for Rn, Tn, CO2, mercury in soil gas (Hgsoil-gas) and
in soil samples (Hgsoil) were conducted in an area approximately
1.3 km north to south by 1.5 km west to east (Fig. 3). The distance be-
tween measurement points varied from 50 to 150 m. Soil gases were
collected from a depth of 60 cm using a steel pipe (5 cm in diameter)
inserted into the ground.
3.2.1. Radon measurement
The Rn and Tn concentrations were measured with a radon detec-
tor (RD-200, EDA Instruments Co. Ltd.). The soil gas was circulated
through the detector with an electrical pump for 10 s, replacing the
air in the detection cell. The Rn concentration was measured by an
α-scintillation radon counter with the soil gas pumped directly into
a scintillation chamber. When the α-particles produced during
radon decay impact the ZnS(Ag) layer in the scintillation counter,
an energy pulse is created in the form of photons, measured by a
photo-multiplier and a counter. As both Rn and Tn decay by means
of α-emission, the concentrations of Rn and Tn were calculated
from three counts in each minute obtained for three sequential
minutes.
3.2.2. CO2 measurement
To measure the CO2 concentration, 100 mL of soil gas was sampled
from the stainless steel probe inserted into the ground using a stain-
less steel syringe, and the CO2 concentration was measured using an
SA-type gas detector tube (Komyo-Kitagawa Instruments Co. Ltd.).
This gas detector works on the principles of chemical reaction and
physical absorption and has ±1% analytical precision. As the gas is
entered into the detector tube, a constant color is produced, which
varies in the length of discolored layer due to the reaction between
the reagent and the CO2. The CO2 concentration can then be obtained
directly by reading from the measuring scale on the tube or using a
concentration chart.
3.2.3. Mercury in soil gas (Hgsoil-gas) and in soil (Hgsoil)
The Hg concentration was measured by the gold wire method,
which indicates both the Hg in soil gas (Hgsoil-gas) in the hole, and
the concentration in the ascending gas. The Hgsoil measurement rep-
resents the concentration of Hg absorbed onto the surface of soil par-
ticle. To measure Hg in soil gas, a pure gold wire (10 cm long, 1 mm
diameter, 1.5 g weight and 3.16 cm2
in the effective surface) was
left in the hole for 7 days after completing the CO2 measurement
(Koga, 1982, 1988). After a week, the gold wire was removed from
the hole and stored in a tightly sealed glass tube.
Soil samples were collected at 0.6 m depth in the hole and sealed
in plastic bags. The soil samples were then air-dried at room temper-
ature for two weeks and ground with a mortar and a pestle after re-
moving rock fragments and plant roots.
The mercury concentrations were determined in the laboratory
by the cold vapor atomic absorption method using mercury analyzer
SP-3 (Nippon Instruments Co., Japan). This equipment uses the
heating-vaporization (700 °C) technique to liberate mercury present
in the sample.
4. Results and discussions
4.1. Water chemistry and stable isotope compositions
The results of the water analyses are given in Table 1, and show
that the water temperatures ranged from 18 °C (UW 6) to 56 °C
(UW 3), while pH values were in the range 3.45–7.87. The SiO2 con-
tents of the thermal waters ranged from 47 to 219 mg/L, while the
EC values were generally between 36 and 561 μS/cm, except for rela-
tively high values in UW 8A and 8B (up to 5300 μS/cm). Other major
Fig. 3. Location of soil gas and water samples around the fumarolic area (UTM coordination system).
26 N.K. Phuong et al. / Journal of Volcanology and Geothermal Research 229-230 (2012) 23–33
5. elements range from 2 to 746 mg/L for Na, from 3.54 to 278 mg/L for
Ca while concentrations of Mg are lower (b126 mg/L). The waters
contain relatively low K concentrations (1.18–47.11 mg/L). For anions,
the HCO3 concentration is relatively high (39–1824 mg/L) followed by
SO4 (b246 mg/L). Chloride concentration is rather low except UW-8A
and 8B are relatively high (about 1000 mg/L).
The chemical compositions of the water samples are plotted on
the Cl–SO4–HCO3 (Giggenbach, 1988) and Na–SO4–Mg diagrams
shown in Fig. 4. The UW 1 and UW 2 samples are classified as acid-
sulfate waters, with high concentrations of SO4 (247 mg/L and
136 mg/L, respectively), but low concentrations of F (b0.25 mg/L)
and Cl (below 1.5 mg/L) (Table 1) suggests that UW 1 and UW 2
have been steam heated, absorbing a gas phase enriched in S-
bearing compounds. The SO4 enrichment can be explained by the
O2-driven oxidation of H2S to H2SO4 in oxygenated near surface
groundwater (Henley and Stewart, 1983; Tassi et al., 2010; Joseph
et al., 2011). Differences from the above samples, most samples are
HCO3-dominated water, mostly Ca–HCO3 or Ca–Mg–HCO3 type (UW
3, 4, 5, 7A, 7B and 9) while UW 8A and 8B are of the Na–HCO3–Cl or
Na–Ca–Cl–HCO3 type with much higher Na, Ca, HCO3, Cl and B con-
centrations than the other samples (Table 1). Water–rock interaction
should be a source of sodium and chloride in UW 8A and 8B.
The minerals in the volcanic rocks primarily consist of plagioclase,
sanidine, and cristobalite with some biotite and hornblende (Kohno
et al., 2005). Table 2 shows the molar ratios of some of the major
components of thermal waters in the study area. Increases in the
Na/Cl and K/Cl ratios in thermal waters are likely to reflect reactions
with feldspar or clay minerals. These ratios can therefore be used as
an independent indicator of residence time. Thermal waters often fol-
low a longer, deeper, regional flow path than non-thermal waters,
and thus have much higher Na/Cl and K/Cl ratios than non-thermal
waters (Han et al., 2010). The Na/K ratio is controlled by temperature
dependent mineral–fluid equilibria (Koga, 1988; Gemini and Tarcan,
2002). The ratios of Na/K are large for all water samples, indicating
Table 1
Chemical composition (in mg/L) and δ18
O and δD values of water samples in the Ungaran geothermal field.
ID Temp pH EC HCO3
−
F−
Cl−
SO4
2−
SiO2 Li+
Na+
NH4
+
K+
Mg2
+
Ca2+
B δD δ18
O
(°C) (μS/cm) (‰) (‰)
UW-1 21.9 3.45 561 50 0.12 1.8 247 58 1.6 34.3 0.43 15.0 13.4 42.5 1.22 −47 −7.9
UW-2 40.0 5.36 368 59 0.21 1.2 136 109 1.1 25.3 0.64 8.6 10.3 32.6 0.79 −49 −7.9
UW-3 56.0 6.10 333 200 0.13 0.8 31.8 86 0.3 14.1 0.45 7.9 15.1 37.1 0.61 −50 −8.0
UW-4 32.2 6.00 297 465 0.05 0.8 2.6 82 0.1 10.7 0.49 5.5 14.7 35.9 0.65 −51 −8.2
UW-5a
n.a. 6.31 36 100 0.02 0.7 3.5 23 0.1 2.3 0.02 1.2 0.7 3.5 0.36 −51 −8.2
UW-6 18.0 5.42 177 107 0.01 0.7 50.3 51 0.2 6.8 0.04 3.1 5.6 18.2 0.42 −50 −8.0
UW-7A 50.0 6.10 491 501 0.06 0.8 3.4 93 0.5 11.8 0.65 6.4 19.8 38.9 0.58 −51 −8.1
UW-7B 25.0 5.90 164 496 0.05 0.8 2.9 89 0.4 12.3 0.53 6.0 17.6 40.7 0.52 −52 −8.2
UW-8A 35.2 6.84 4580 1732 0.06 998 0.2 92 4.4 700 16.1 44.2 117.7 217.3 15.9 −39 −5.3
UW-8B 38.1 6.78 5210 1824 0.06 1088 0.1 95 5.6 746 18.0 47.1 126.0 278.4 19.7 −40 −5.3
UW-9a
23.8 7.87 513 351 0.07 7.2 4.4 51 0.5 23.2 0.29 2.4 26.9 62.1 0.15 −39 −6.1
n.a.: not analyzed.
a
River water.
Fig. 4. Chemical compositions (a) Cl–SO4–HCO3 and (b) SO4–Mg–Na of thermal waters
in the Ungaran geothermal field.
Table 2
Molar ratios of some major components of water samples in the Ungaran geothermal
field.
ID Temp Na/Cl K/Cl Ca/Cl Na/K Na/Ca HCO3/SO4 Cl/B
(°C)
UW-1 21.9 28.68 7.42 20.4 15.8 0.32 2.17 0.46
UW-2 40.0 33.82 6.80 25.0 29.5 0.68 2.25 0.44
UW-3 56.0 28.36 9.37 43.0 152 9.91 2.61 0.38
UW-4 32.2 21.90 6.57 42.1 358 280 2.83 0.35
UW-5a
– 5.40 1.63 4.7 87.9 44.58 1.79 0.56
UW-6 18.0 16.06 4.39 24.8 96.0 3.36 2.12 0.47
UW-7A 50.0 21.78 6.94 41.4 349 231.9 2.28 0.44
UW-7B 25.0 23.11 6.62 44.1 353 274 2.09 0.48
UW-8A 35.2 1.08 0.04 0.2 26.9 5.6 13,629 19.1
UW-8B 38.1 1.04 0.04 0.2 26.8 4.66 28,706 16.8
UW-9a
23.8 4.96 0.3 7.6 16.7 0.65 124.4 14.6
n.a.: not analyzed.
a
River water.
27N.K. Phuong et al. / Journal of Volcanology and Geothermal Research 229-230 (2012) 23–33
6. that the temperature of geothermal reservoir is not probably too high.
This is in agreement with general increase in Na/K ratios of thermal
water with decreasing reservoir temperature (Ellis and Mahon,
1967; Koga, 1988; Cortecci et al., 2005). Based on relatively low
Na/K ratios (b15, Table 2) water of springs at the Gedongsongo area
that have reached the surface rapidly and are therefore associated
with up-flow structures or permeable zones while higher Na/K ratios
(>15, Table 2) are indicative of lateral flows which may undergone
near-surface reactions and conductive cooling (Nicholson, 1993;
Cortecci et al., 2005; Di Napoli et al., 2009). Similarly, high Na/Ca ra-
tios are also indicative of direct feeding from a geothermal reservoir
and less groundwater contribution, while the HCO3/SO4 ratio can be
used as an indicator of flow direction (Table 2). The Na/Ca values
for deep well thermal waters are very high (>50), while for cold
groundwater this ratio is around 0.25. Low Na/K and Na/Ca ratios
are found in thermal waters in the north of the fumarole (UW 1 and
UW 2) while to the south of the fumarole, the thermal waters have
high Na/K and Na/Ca ratios and increasing HCO3/SO4 ratios (Table 2).
Therefore, we can infer that thermal waters in the north of the fumarole
are associated with up-flow zones, while thermal waters to the south of
the fumarole are associated with lateral flow.
The behavior of conservative components useful in the delineation
of formation processes of waters, involving Cl, Li and B, is investigated
in Fig. 5. As pointed out above, Li is the alkali element least affected by
secondary absorption processes. Li is also released during water–rock
interactions and remains largely in solution (Giggenbach and Soto,
1992; Mainza, 2006; Tassi et al., 2010). Boron and Cl−
are not readily
incorporated into secondary, alteration minerals, so they can be
considered conservative chemical species (Seyfried et al., 1984;
Nicholson, 1993; Tassi et al., 2010). Boron may have several origins.
It may be leached from sedimentary rocks; due to its volatility in
high temperature steam, it may also be introduced with any high
temperature vapor phase absorbed into water. Moreover, the B con-
tent of thermal fluids is likely during the early heating up stages.
Therefore, fluids from older hydrothermal systems can be expected
to be depleted in B while the converse holds for younger hydrother-
mal systems (Mainza, 2006). It is, however, striking both Cl and B is
adding to the Li containing solutions in proportions close to those in
crustal rocks. For the UW 8A and 8B, it can be elucidated that dissolu-
tion of an averaged andesitic–rhyolitic rock, followed by exchange
with secondary minerals or interaction with gases (Fig. 5). Moreover,
water rock interaction can be postulated by Cl/B ratio. Ellis and
Mahon (1967) found that in areas where andesitic or rhyolitic rocks
predominate, Cl/B ratios are often between 10 and 30. The Cl/B ratios
Fig. 5. Binary diagram of Li vs Cl and B vs Cl.
Fig. 6. δD vs δ18
O composition of thermal waters in the Ungaran geothermal field.
Table 3
Estimated temperature (in °C) for thermal water in the Ungaran geothermal filed using
silica geothermometers.
ID Measured
temperature
Estimated temperature
(°C)
(°C)
TQz
a
TQz
b
TC
c
T d
UW 1 21.9 109 109 80 110
UW 2 40.0 142 137 116 143
UW 3 56.0 129 126 101 129
UW 4 32.2 127 124 99 127
UW 6 18.0 102 103 73 103
UW 7A 50.0 133 129 106 133
UW 7B 25.0 131 127 103 131
UW 8A 35.2 132 129 105 132
UW 8B 38.1 134 130 107 134
UW 9* 23.8 102 103 72 103
a
Quartz — no steam loss from Fournier (1983).
b
Quartz — maximum steam loss at 100 °C from Fournier (1983).
c
Chalcedony from Fournier (1983).
d
From Fournier and Potter (1982).
Fig. 7. Na–K–Mg ternary diagram for thermal waters in the Ungaran geothermal field
(Giggenbach, 1988).
28 N.K. Phuong et al. / Journal of Volcanology and Geothermal Research 229-230 (2012) 23–33
7. of the UW 8A and 8B are from 14 to 19 (Table 2), thus, it is suggested
that high concentration of Na, Cl, Li and B is originated from water–
rock interaction.
The results of the stable isotope analysis in the Gedongsongo area
are given in Table 1 and plotted in the δD vs δ18
O diagram (Fig. 6).
Stable isotope compositions of meteoric water from coastal Jakarta
(Gat and Gonfiantini, 1981) were used as reference data (δD=8.05
δ18
O+16.48) (Fig. 6). This line does not deviate significantly from
the global meteoric water line defined by Craig (1961). In Fig. 6, all
samples from Gedongsongo plot along the meteoric water line, sug-
gesting that the thermal waters are of meteoric origin. Compared to
the others samples, increase in δD values of UW 8A, 8B and UW 9
are results of altitude affect. The UW 8A, B and 9 were located at
area whose altitude (about 600 m a.s.l.) is relatively lower than the
Gedongsongo area. Moreover, the thermal waters from UW 8A and
8B show positively shift of δ18
O which caused by a reaction with rock.
The estimated reservoir temperatures for the Ungaran geother-
mal field using silica geothermometers (Fournier and Potter, 1982;
Fournier, 1983) are listed in Table 3. Chalcedony geothermometers
indicate lower temperatures (72 °C–116 °C) than quartz geother-
mometers (102 °C–142 °C). The Na–K–Mg1/2
triangle proposed by
Giggenbach (1988) is shown in Fig. 7. All of the thermal waters
Table 4
Soil gas concentrations of Rn, Tn, CO2 and Hgsoil-gas and Hgsoil in the Gedongsongo area.
ID Temp. at 60 cm depth Rn Tn CO2 Rn/Tn Hgsoil-gas Hgsoil
(°C) (cpm) (cpm) (%) (ng) (ppm)
UG-1 51.5 601 1272 >20 0.472 142.3 1.90
UG-2 24.5 498 1678 >20 0.297 83.3 0.31
UG-3 19.8 157 593 >20 0.264 41.3 0.69
UG-4 18.3 44 493 0.9 0.089 46.7 0.23
UG-5 19.0 251 971 0.6 0.134 37.9 2.80
UG-6 20.2 223 914 >20 0.229 104.9 2.21
UG-7 23.9 266 843 >20 0.315 61.1 0.79
UG-8 18.4 5.21 486 1.5 0.011 104.9 0.13
UG-9 19.1 83.7 429 9.0 0.195 93.3 0.09
UG-10 19.0 107 352 5.0 0.304 37.2 0.12
UG-11 20.5 105 695 1.0 0.151 11.0 0.01
UG-12 23.0 22.4 177 0.7 0.127 7.0 1.92
UG-13 22.2 51.5 351 1.8 0.147 52.4 0.13
UG-14 20.7 0.29 235 0.6 0.001 13.5 0.01
UG-15 19.8 28.3 209 0.8 0.136 21.1 0.62
UG-16 24.9 81 336 2.4 0.241 104.9 2.34
UG-17 29.5 230 857 >20 0.269 57.6 8.06
UG-18 19.3 63.1 312 5.0 0.202 15.6 0.53
UG-19 19.8 40.7 773 >20 0.053 66.5 21.56
UG-20 20.9 58.7 533 9.5 0.110 79.1 13.28
UG-21 18.8 176 676 >20 0.260 104.9 20.56
UG-22 19.0 31 298 0.8 0.104 26.3 0.43
UG-23 19.6 6.42 144 0.4 0.045 29.0 0.63
UG-24 18.4 153 505 14 0.303 78.2 0.26
UG-25 18.8 161 593 >20 0.272 35.7 0.09
UG-26 19.5 58.4 396 0.25 0.148 104.9 9.22
UG-27 20.2 235 450 9.0 0.523 50.2 1.58
UG-28 20.1 70 302 1.1 0.231 89.2 2.92
UG-29 22.0 73.3 467 1.4 0.157 36.7 2.54
UG-30 20.3 141 967 0.3 0.146 24.9 0.01
UG-31 20.7 40.4 220 1.9 0.184 1.3 0.20
UG-32 24 358 848 >20 0.422 38.7 0.44
UG-33 22 24.3 266 0.7 0.091 1.4 0.02
UG-34 19 22.8 214 1.0 0.107 3.0 0.01
UG-35 18.5 18.6 223 0.5 0.083 7.9 0.69
UG-36 20 19.3 266 1 0.072 1.5 1.54
UG-37 22.5 0.37 117 0.55 0.003 3.1 0.31
UG-38 23.5 2.26 35.7 0.3 0.063 1.8 0.01
UG-39 22.4 17.8 101 0.3 0.176 1.3 0.01
UG-40 22.6 14.2 83.8 0.3 0.169 1.8 0.00
UG-41 21.1 12.6 179 0.28 0.070 2.3 0.37
UG-42 23.5 3.19 62.8 0.29 0.051 3.1 0.33
UG-43 24.1 91.7 434 0.5 0.211 3.8 0.38
UG-44 22.6 6.19 67.8 0.2 0.091 3.1 0.11
UG-45 22.8 10.5 72.5 0.4 0.145 3.1 0.02
UG-46 21.6 9.85 182 0.7 0.054 1.1 0.01
UG-47 18.2 377 931 >20 0.406 5.9 0
UG-48 17.8 26.6 237. 0.4 0.112 3.0 0.07
UG-49 18.1 13.3 161 0.35 0.083 3.0 0
UG-50 18.5 38.6 228 0.38 0.169 5.4 0
UG-51 20.4 123 606 16.8 0.202 6.2 0
UG-52 20.1 86.4 408 11.0 0.212 2.3 0
UG-53 20 74.1 351 1.5 0.211 30.6 0.03
UG-54 22.8 1.74 251 0.5 0.007 30.5 0.00
UG-55 20.3 60.3 394 0.8 0.153 4.1 0.11
UG-56 20.5 12.2 419 0.6 0.029 2.8 0.59
UG-57 21.6 81.4 339 0.3 0.240 5.4 0.14
UG-58 20 150 484 4.0 0.309 45.4 1.33
UG-59 19.4 47 215 0.6 0.218 12.8 0.02
29N.K. Phuong et al. / Journal of Volcanology and Geothermal Research 229-230 (2012) 23–33
8. from the Gedongsongo area are classified as immature waters (locat-
ed to the Mg apex), so the use of chemical geothermometers for esti-
mating subsurface temperatures is not appropriate for this system.
The use of silica (quartz-no steam loss) geothermometers may there-
fore be acceptable for estimating reservoir temperatures of the
Ungaran geothermal field. However, estimating reservoir tempera-
tures are rather low because maybe part of SiO2 precipitated during
storage.
4.2. Soil gas survey
4.2.1. Statistical interpretation of soil gas data
The soil gas measurements for all samples were conducted within
one or two days to minimize the influence of changes in meteorolog-
ical conditions on the soil gas compositions. Table 4 shows the soil
gas concentrations of all samples collected in the Gedongsongo area
(Fig. 3).
Threshold values, used to recognize anomalous concentrations in
the soil gas data, were calculated using the geometric mean plus
one standard deviation (Lepeltier, 1969; Klusman and Landress,
1979; Varekamp and Buseck, 1983; Lescinsky et al., 1987; Klusman,
1993). Samples with concentrations above this threshold are consid-
ered anomalous. In geochemical exploration, cumulative frequency
diagrams are used for the determination of low (background) range,
anomalous samples or recognition of multiple populations in log-
normally distributed data (Lepeltier, 1969; Varekamp and Buseck,
1983; Lescinsky et al., 1987; Klusman, 1993). Individual populations
were separated by visual assessment using the procedure outlined
by Lepeltier (1969). The geometric mean, m, was read at the 50th per-
centile; and the coefficient of deviation, σ, representing the spread in
the data, is the logarithm of the ratio of the value one standard
deviation from the geometric mean over the geometric mean. Thus,
soil gas data from the study area are classified into three populations
as low or background (I), high (II), and anomalous values (III) as
shown in cumulative frequency diagrams (Fig. 8 and Table 5). High
soil gas concentrations were found over broad areas, while anoma-
lous concentrations were identified in the north of the fumarole in
the Gedongsongo area. Areas located at the east and south of the fu-
marole had generally low soil gas concentrations.
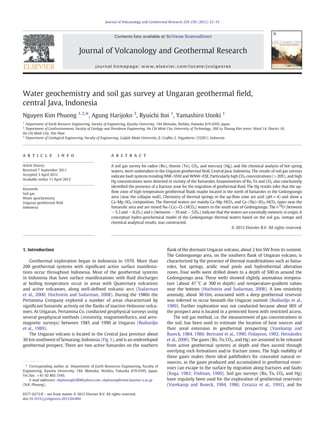
4.2.2. Spatial distribution of soil gas data and recognition of trace
of fault/fracture
To characterize the study area, the spatial distribution of soil gas
data was interpreted using contour maps (Figs. 9, 10 and 11) that
were produced using the kriging method with interpolation based
on a linear variogram model provided by the Surfer software.
Fig. 9 shows contour maps of the Rn concentration and the Rn and
Tn ratio. The Rn results show that the high and anomalous concentra-
tions occur in the northern parts of the surveyed area (200 m from
the fumarole) (Fig. 9a and Table 5). Anomalously high radon values
Fig. 8. Cumulative frequency diagrams of Rn (a), Tn (b), CO2 (c) Hgsoil-gas (d) and Hgsoil (e) in the Gedongsongo area. Three populations: low (I); high (II); and anomalous (III) are
shown.
Table 5
Distribution of soil gas into three populations (low, high and anomalous).
Classification Radon Thoron CO2 Hgsoil-gas Hgsoil
(cpm) (cpm) (%) (ng) (ppm)
Geometric mean (m) 98 450 5.4 34 1.7
Standard deviation (σ) 123 320 7.7 37 4.3
Low (concentrationbσ) b123 b320 b7.7 b37 b4.3
High (σbconcentrationbσ+m) 123–221 320–770 7.7–13.1 37–71 4.3–6.0
Anomalous (σ+mbconcentrationbσ+2⁎ m) 221–318 770–1266 13.1–20 71–105 6.0–7.8
30 N.K. Phuong et al. / Journal of Volcanology and Geothermal Research 229-230 (2012) 23–33
9. could be indicative of enhanced permeability where Rn-222 rapidly mi-
grates to the surface before disintegrating into daughter products. How-
ever, the release of radon is dependent on other factors, including the
degree of rock fractures and the ability of the ground water to permeate
through such rocks. Percolating ground water transports radon from
fractured porous rocks by preventing diffusion. As described above,
the radon will partition into the steam phase and be transported to
higher elevations through permeable zones. A NNE–SSW alignment of
Rn anomalies, associated with the fault in this area, can be observed.
Other areas west of the fumarole especially on a WNW–ESE alignment
also have relatively high Rn values, while low Rn values are observed
in most of the remaining survey area.
Many studies have been published on the feasibility of using Rn
and CO2 measurements to detect active structures such as fractures
and faults (King, 1980; Koga, 1988; Etiope and Lombardi, 1995;
Giammanco, et al., 1998; Fu et al., 2005; Yang et al., 2005; Lan et al.,
2007). Faults favor gas transport because they increase rock permeabil-
ity, helping the gas ascending to the surface. Furthermore, gases from a
deep source can migrate upward through faults where the gas flow is
driven by advection. As Tn has a short half-life, 55 s, its concentration
in counts per minute (cpm) decreases quickly during 3 min of sequen-
tial measurement. However, Rn has a half-life of 3.8 days and can be
transported in fractures for a considerable distance. To detect the pres-
ence of fracture or fault systems connecting the deep zone to the sur-
face, the Rn/Tn concentration ratio can be a suitable indicator. Fig. 9b
shows the Rn/Tn ratio contour map. High Rn/Tn ratios (>0.4) are
found mainly about 200 m to the north and 250–300 m to the south
east of the fumaroles. Zones with a high Rn/Tn ratio not only indicate
Fig. 9. Contour map of (a) radon concentration and (b) radon to thoron concentration
ratio.
Fig. 11. Contour maps of (a) Hgsoil-gas and (b) Hgsoil concentration.
Fig. 10. Contour maps of CO2 concentration.
31N.K. Phuong et al. / Journal of Volcanology and Geothermal Research 229-230 (2012) 23–33
10. the presence of a fault/fracture zone but also indicate the extending of
fault/fracture from deep zone to the surface.
Fig. 10 is a contour map of the CO2 concentration. The CO2 map
clearly shows a close relationship with the Rn, and Rn/Tn maps. It is
relevant that in the Gedongsongo, CO2 values greater than 20% are
considered anomalous. The high and anomalous CO2 values (>10%)
were detected around the fumaroles and 250–300 m to south of
the fumarole while low CO2 values are mainly located in the east
(Fig. 10). Zones with anomalous and high CO2 concentrations trend
from NNE–SSW and WNW–ESE, and these can be postulated as fault
locations. It is interesting to note that areas with high Rn/Tn ratios and
anomalous CO2 concentration occur at the same location. This align-
ment, trending NNE–SSW and WNW–ESE (Figs. 9b and 10) can be pos-
tulated as a fault in this area. The NNE–SSW alignment of soil gas
anomalies agrees with topographic and geologic data of a fault zone
(Van Bemmelen, 1970; Thanden et al., 1996), while the WNW–ESE
alignment may be another fault zones, unknown prior to the soil gas
survey.
The combined CO2 concentrations and soil temperatures (Table 4)
are correlated to the north of the fumarole. This observation may
identify the displacement of a high temperature heat source or an
up-flow zone of high temperature geothermal fluid (Lan et al.,
2007). The interpretation of Hg survey results will provide more evi-
dence on this potential up-flow zone.
4.2.3. Mercury as feature of geothermal activities
The Hg concentrations have a wide range from 1.1 to 142.3 ng and
0.01 to 21.6 ppm for Hg Hgsoil-gas and Hgsoil, respectively. Fig. 11a shows
a contour map of Hgsoil-gas. The high concentration zone represents
Hgsoil-gas concentrations above 40 ng, and extends from 0.7 km north
to south by 1 km west to east from the fumarole. This supports the sug-
gestion that geothermal activity is widespread around the fumarole
zone. Absorbed Hg on the soil surface is difficult to desorb except after
heating at high temperatures. Thus, the resulting mercury anomalies
are related to the temperature of the ascending geothermal fluids,
which act as a carrier while also providing the migration pathways.
Varekamp and Buseck (1983) and Murray (1997) concluded that Hg
anomalies occur when geothermal fluids escape from a deep reservoir
and migrate to shallow levels. Anomalous Hgsoil-gas values were found
in the north of the fumarole which consistent with the location of the
anomalous Rn, Tn, CO2 and temperature values. The chemistry of spring
waters in this area is acid-sulfate type, indicating that a component of
these fluids has condensed from H2S-rich vapor phase. Mercury is
strongly partitioned into the vapor phase, so steam escaping towards
the surface will be enriched in Hg, and acid hot-springs and fumaroles
will display strong Hg anomalies. We, therefore, postulate that upwell-
ing and subsequent boiling occurs beneath the area to the north of the
fumarole. The soil gas contours appear to define the NNE–SSW and
WNW–ESE alignments, which are thought to represent fault/fracture
zones. Non-thermal waters or a mixture of thermal and non-thermal
waters are found in the south of fumarole and this area coincides with
low Hg concentrations.
Mercury enrichment in soils is a dynamic process, as re-
volatilization and biogenic uptake with subsequent volatilization
(Varekamp and Buseck, 1983) will continuously remove Hg from
the soil. A steady-state will occur after an initial period of non-
equilibrium. The continuous Hg loss process means that old and current
thermal activity can be distinguished (Koga, 1982, 1988; Varekamp and
Buseck, 1983). The Hg results in soil and in soil gas are not always in
good agreement because Hgsoil-gas indicates current geothermal activity
while Hgsoil shows the history of geothermal activity up to the present
(Koga, 1982, 1988). Fig. 11b shows high Hgsoil concentrations are locat-
ed in the east of the fumarolic area, and we infer that was an ancient
geothermal zone. Varekamp and Buseck (1983) have documented
cases where active geothermal zones are enriched in Hgsoil-gas but lack
Hgsoil.
4.3. Conceptual hydro-geochemical model of the Ungaran geothermal
field
From this study, a hydro-geochemical model of the Gedongsongo
thermal waters has been developed and is shown in Fig. 12.
This model shows the up-flow of high temperature geothermal
fluid located in the north of the fumarole. The anomalous Hg values
occur in the vapor-dominated part of the system, which is explained
by the strong partitioning of Hg into the vapor phase during boiling.
Deep geothermal fluids are present below this area, and circulate
through the fault and fracture zones with some portion of the fluids
discharging at the surface. Based on the geochemical and isotopic
data, the thermal springs at Gedongsongo are of meteoric origin.
The meteoric waters percolate through the fault systems into the
mixing zone where they are heated by deep geothermal fluids and as-
cend to the surface along the NNE–SSW and WNW–ESE fault. In the
shallow zone, CO2 and H2S rich steam rises off the thermal waters,
which can lead to formation of sulfate-rich waters, while some of
the ascending thermal waters mix with cold water and rise along
the WNW–ESE fault. The areas with low soil gas concentrations
show that the boundary of the limited geothermal system is in the
northern section of the fumarole field at the Gedongsongo area.
5. Conclusions
The chemistry of the thermal waters discharged in the Gedongsongo
area indicates steam that heated acid-sulfate waters (Ca–(Na)–Mg–
SO4) are present in the north of the fumarole while mixed bicarbonate
(Ca–Mg–HCO3) and bicarbonate–chloride (Na–HCO3–Cl or Na–Ca–Cl–
HCO3) water is present in the south and southeast of the Gedongsongo
area. The compositions of the thermal waters reveal that they have not
reached chemical equilibrium with the host rocks. The reservoir tem-
peratures estimated using silica geothermometers is from102 °C to
142 °C.
A soil gas survey was also conducted at the Ungaran geothermal
field and has provided an overview of soil gas distribution patterns
produced by the underlying system. The soil gas contour maps
show that, Rn, and CO2 are reliable and sensitive indicators for tracing
Fig. 12. Simplified conceptual hydro-geochemical model of the Ungaran geothermal
field.
32 N.K. Phuong et al. / Journal of Volcanology and Geothermal Research 229-230 (2012) 23–33
11. faults. In this study, high gas concentrations were identified along the
faults trending NNE–SSW and WNW–ESE which act as conduits for
geothermal fluid and soil gas. From the anomalous Hg concentrations,
we inferred that the up-flow zone of high temperature geothermal
fluid is in the north of the fumarole.
Acknowledgments
This study was supported by AUN/SEED-Net program, JICA
(Japanese International Cooperation Academic) and Gadjah Mada
University, Indonesia. The authors thank Prof. Sachihiro Taguchi of
Fukuoka University for his help to analyze stable isotope of water
samples.
References
APHA, 2005. Standard Methods for the Examination of Water and Wastewater, Method
4500-SiO2, Automated Method for Molybdate-Reactive Silica. American Public
Health Association.
Van Bemmelen, R.W., 1970. The Geology of Indonesia, Vol. 1A, General Geology of
Indonesia and Adjacent Archipelago, 2nd Edition. Martinus Nilhoff, The Hague,
Netherlands.
Bertrami, R., Bounasorte, G., Ceccarelli, A., Lombardi, S., Pieri, S., Scandiffio, G., 1990. Soil
gases in geothermal prospecting: two case histories (Sabitini Volcanoes and Alban
Hills, Latium, Central Italy). Journal of Geophysical Research 95 (21), 475–481.
Budiardjo, B., Nogroho, D., Budihardi, M., 1989. Resource characteristics of the Ungaran
Field, Central Java, Indonesia. Technical Report. Pertamina Co. 8 pp.
Budiardjo, B., Nugroho, D., Budihardi, M., 1997. Resource characteristic of the Ungaran
Field, Central Java, Indonesia. Proceedings of the National Seminar Of Human
Resources Geologist, Geological Engineering Mineral Technology Faculty, UPN
“Veteran”, Jogyakarta.
Chuaviroj, S., Chingchit, K., Takashima, I., 1987. Soil gas and alteration of the San
Kamphageng geothermal field, northern Thailand. Bulletin of the Geological Survey
of Japan 38, 41–50.
Corazza, E., Magro, G., Pieri, S., Rossi, U., 1993. Soil gas survey in the geothermal area of
Bolsena Lake (Vulsini Mountains, central Italy). Geothermics 22, 201–214.
Cortecci, G., Boschetti, T., Missi, M., Lameli, C.H., Mucchino, C., Barbieri, M., 2005. New
chemical and original isotopic data on waters from El Tatio geothermal field,
northern Chile. Geochemical Journal 39, 547–571.
Cox, M.E., Cuff, K.E., 1980. Rn and Hg surveys: geothermal exploration in NE Maui,
Hawaii. Geoth. Res. Council Trans. 4, 451–454.
Craig, H., 1961. Isotopic variations in meteoric waters. Science 133, 1702–1703.
Di Napoli, R., Aiuppa, A., Bellomo, S., Brusca, L., D'Alessandro, W., Candela, E.G., Longo,
M., Percoraino, G., Valenza, M., 2009. A model for Ischia hydrothermal system:
evidence from the chemistry of thermal groundwaters. Journal of Volcanology
and Geothermal Research 186, 133–159.
Ellis, A.J., Mahon, W.A.J., 1967. Natural hydrothermal systems and experimental hot
water/rock interactions, part II. Geochimica et Cosmochimica Acta 31, 519–538.
Epstein, S., Mayeda, T.K., 1953. Variation of the 18
O/16
O ration in natural waters.
Geochimica et Cosmochimica Acta 4, 213–224.
Etiope, G., Lombardi, S., 1995. Evidence for radon transport by carrier gas through faulted
clay in Italy. Journal of Radioanalytical and Nuclear Chemistry 193, 291–300.
Finlayson, J.B., 1992. A soil air gas survey over Rotorua geothermal field, Rotorua, New
Zealand. Geothermics 21, 181–195.
Fournier, R.O., Potter, R.W., 1982. An equation correlating the solubility of quartz in water
from 250 °C to 900 °C at pressures up to 1000 bars. Geochimica et Cosmochimica
Acta 46, 1969–1974.
Fournier, R.O., 1983. A method of calculating quartz solubilities in aqueous sodium
chloride solutions. Geochimica et Cosmochimica Acta 47, 579–586.
Fridman, A.I., 1990. Application of naturally occurring gases as geochemical pathfinders
in prospecting for endogenetic deposits. Journal of Geochemical Exploration 38,
1–11.
Fu, C.-C., Yang, T.F., Walia, V., Chen, C.-H., 2005. Reconnaissance soil gas composition
over the buried fault and fracture zone in the southern Taiwan. Geochemical
Journal 39, 427–439.
Gat, J.R., Gonfiantini, R. (Eds.), 1981. Stable Isotope Hydrology: Deuterium and Oxygen
−18 in the Water Cycle. International Atomic Energy Agency, Vienna.
Gemini, Ü., Tarcan, G., 2002. Hydrogeochemistry of the Simav geothermal field, western
Anatolia, Turkey. Journal of Volcanology and Geothermal Research 116, 215–233.
Giammanco, S., Gurrieri, S., Valenza, M., 1998. Anomalous soil CO2 degassing in relation
to faults and eruptive fissures on Mount Etna (Sicily, Italy). Bulletin of Volcanology
60, 252–259.
Giggenbach, W.F., 1988. Geothermal solute equilibria. Derivation of Na–K–Mg–Ca
geoindicators. Geochimica et Cosmochimica Acta 52, 2749–2765.
Giggenbach, W.F., Soto, R.C., 1992. Isotopic and chemical composition of water and
steam discharge from volcanic–magmatic–hydrothermal systems of the Guanacaste
Geothermal Province, Costa Rica. Applied Geochemistry 7, 309–332.
Gregory, R.G., Durrance, E.M., 1985. Helium, carbon dioxide and oxygen soil gases:
small-scale variation over fractured ground. Journal of Geochemical Exploration
24, 29–49.
Guerra, M., Lombardi, S., 2000. Soil-gas method for tracing neotectonic faults in clay
basins: the Pisticci field (southern Italy). Tectonophysics 339, 511–522.
Han, D.M., Liang, X., Jin, M.G., Currell, M.J., Song, X.F., Liu, C.M., 2010. Evaluation of
groundwater hydrochemical characteristics and mixing behavior in the Daying
and Qicun geothermal systems, Xinzhou basin. Journal of Volcanology and
Geothermal Research 189, 92–104.
Henley, R.W., Stewart, M.K., 1983. Chemical and isotopic changes in the hydrology of the
Tauhara geothermal field due to exploitation at Wairakei. Journal of Volcanology and
Geothermal Research 15 (4), 285–314.
Hernández, P., Pérez, N., Salazar, J., Sato, M., Notsu, K., Wakita, H., 2000. Soil gas CO2,
CH4, and H2 distribution in and around Las Canadas caldera, Tenerife, Canary
Islands, Spain. Journal of Volcanology and Geothermal Research 103, 425–438.
Hochstein, M.P., Sudarman, S., 2008. History of geothermal exploration in Indonesia
from 1970 to 2000. Geothermics 37, 220–266.
Joseph, E.P., Fournier, N., Lindsay, J.M., Fischer, T.P., 2011. Gas and water geochemistry
of geothermal systems in Dominica, Lesser Antilles island arc. Journal of Volcanol-
ogy and Geothermal Research 206, 1–14.
King, C.Y., 1980. Episodic radon changes in subsurface soil gas along active faults and
possible relation to earthquakes. Journal of Geophysical Research 85, 3065–3078.
Klusman, R.W., Landress, R.A., 1979. Mercury in soils of the Long Valley, California geo-
thermal system. Journal of Volcanology and Geothermal Research 5, 49–65.
Klusman, R.W., 1993. Soil Gas and Related Methods for Natural Resource Exploration.
John Wiley & Son Ltd, England. 483 pp.
Koga, A., 1982. The use of volatile constituents in geothermal fluids for assessing the
type, potential and near surface permeability of a geothermal system: the Broad-
lands geothermal area, New Zealand. Proceedings of New Zealand Geothermal
Workshop, pp. 135–138.
Koga, A., 1988. Hydrothermal Geochemistry. Textbook for the Nineteenth International
Group Training Course on Geothermal Energy. Kyushu University. 86 pp.
Kohno, Y., Setijadji, L., Utami, P., Harijoko, A., Pecskay, Z., Imai, A., Watanabe, K., 2005. Geo-
chronology and petrogenesis aspects of Merapi–Merbabu–Telomoyo–Ungaran volca-
noes, Central Java, Indonesia. Proceeding, Joint Convention HAGI-IAGI-PERHAPI,
Surabaya, Indonesia.
Lan, T.F., Yang, T.F., Lee, H.-F., Chen, Y.-G., Chen, C.-H., Song, S.-R., Tsao, S., 2007. Com-
position and flux soil gas in Liu–Huang–Ku hydrothermal area, northern Taiwan.
Journal of Volcanology and Geothermal Research 165, 32–45.
Lepeltier, C., 1969. A simplified statistical treatment of geochemical data by graphical
representation. Economic Geology 64, 538–550.
Lescinsky, D.T., Connor, C.B., Stoiber, R.E., 1987. Soil mercury study of thermal areas,
Rincón de la Verja volcano, Costa Rica. Geothermics 16 (2), 159–168.
Mainza, D., 2006. The chemistry of geothermal waters of SW-Uganda. Report of
Geothermal Training Programme, Iceland, pp. 219–244.
Murray, K.S., 1997. The use of soil Hg to delineate zones of upwelling in low-to-
moderate temperature geothermal system. Geothermics 26 (2), 193–202.
Nicholson, K., 1993. Geothermal Fluids. Springer Verlag, Germany. 263 p.
Seyfried, W.E., Janecky, D.R., Mottle, M.J., 1984. Alteration of the oceanic crust: implica-
tions for geochemical cycles of lithium and boron. Geochimica et Cosmochimica
Acta 48, 557–559.
Sudarman, S., Suroto, Pudyastuti, K., Aspiyo, S., 2000. Geothermal development pro-
gress in Indonesia: country update 1995–2000. Proceedings of the WGC 2000,
Japan, pp. 455–460.
Tassi, F., Aguilera, F., Darrah, D., Vaselli, O., Capaccioni, B., Poreda, R.J., Huertas, A.D.,
2010. Fluid geochemistry of hydrothermal systems in the Arica–Parinacota, Tarapacá
and Antofagasta regions (northern Chile). Journal of Volcanology and Geothermal
Research 192, 1–15.
Thanden, R. E., Sumadirdja, H., Richards, P. W., Sutisna, K. and Amin, T. C., 1996. Geological
Map of the Magelang and Semarang Sheets, Java, scales 1: 100,000, Systematic
Geological Map, Indonesia, Geological Research and development Centre, Indonesia.
Toutain, J.-P., Baubron, J.-C., 1999. Gas geochemistry and seismotectonics: a review.
Tectonophysics 304, 1–27.
Van Kooten, G.K., 1987. Geothermal exploration using surface mercury geochemistry.
Journal of Volcanology and Geothermal Research 31, 269–280.
Varekamp, J.C., Buseck, P.R., 1983. Hg anomalies in soils: a geochemical exploration
method for geothermal areas. Geothermics 12, 29–47.
Varekamp, J.C., Buseck, P.R., 1984. The speciation of mercury in hydrothermal systems,
with applications for ore deposition. Geochimica et Cosmochimica Acta 48,
177–186.
Varekamp, J.C., Buseck, P.R., 1986. Global mercury flux from volcanic and geothermal
sources. Applied Geochemistry 1, 65–73.
Walia, V., Su, T.C., Fu, C.C., Yang, T.F., 2005. Spatial variations of radon and helium con-
centrations in soil gas across Shan–Chaio fault, Northern Taiwan. Radiation Mea-
surements 40, 513–516.
Walia, V., Mahajan, S., Kumar, A., Singh, S., Bajwa, B.S., Dhar, S., Tang, T.S., 2008. Fault
delineation study using soil-gas method in the Dharamsala area, NW Himalayas,
India. Radiation Measurements 43, S337–S342.
Yang, T.F., Walia, V., Chyi, L.L., Fu, C.C., Wang, C.C., Chen, C.-H., Liu, T.K., Song, S.R., Lee,
C.Y., Lee, M., 2005. Variation of soil radon and thoron concentrations in a fault zone
and prospective earthquakes in SW Taiwan. Radiation Measurements 40, 496–502.
33N.K. Phuong et al. / Journal of Volcanology and Geothermal Research 229-230 (2012) 23–33