
Recommended
Recommended
More Related Content
What's hot
What's hot (19)
Similar to Paper = geochemical signatures of potassic to sodic adang volcanics, western sulawesi implications for their tectonic setting and origin (final)(dec2016)
Similar to Paper = geochemical signatures of potassic to sodic adang volcanics, western sulawesi implications for their tectonic setting and origin (final)(dec2016) (20)
Recently uploaded
Recently uploaded (20)
Paper = geochemical signatures of potassic to sodic adang volcanics, western sulawesi implications for their tectonic setting and origin (final)(dec2016)
- 1. 195 Indonesian Journal on Geoscience Vol. 3 No. 3 December 2016: 195-214 IJOG/JGI (Jurnal Geologi Indonesia) - Acredited by LIPI No. 547/AU2/P2MI-LIPI/06/2013. valid 21 June 2013 - 21 June 2016 How to cite this article: Godang, S., Fadlin, and Priadi, B., 2016. Geochemical Signatures of Potassic to Sodic Adang Volcanics, West- ern Sulawesi: Implications for Their Tectonic Setting and Origin. Indonesian Journal on Geoscience, 3 (3), p.195-214. DOI: 10.17014/ijog.3.3.195-214 Geochemical Signatures of Potassic to Sodic Adang Volcanics, Western Sulawesi: Implications for Their Tectonic Setting and Origin Godang Shaban1 , Fadlin2 , and Bambang Priadi3 1 Geochemist, Rare Minerals and REEs Researcher 2 Geological Engineering, Jenderal Soedirman University (UNSOED) Jln. Mayjen. Sungkono Km 05, Blater, Purbalingga 3 Department of Geology, Institute of Technology Bandung (ITB) Jln. Ganesha No.10, Bandung Corresponding author: godang.sc@gmail.com Manuscript received: July 26, 2016; revised: October 24, 2016; approved: November 18, 2016; available online: December 7, 2016 Abstract - The Adang Volcanics represent a series of (ultra) potassic to sodic lavas and tuffaceous rocks of predominantly trachytic composition, which forms the part of a sequence of Late Cenozoic high-K volcanic and associated intrusive rocks occurring extensively throughout Western Sulawesi. The tectonic setting and origin of these high-K rocks have been the subject of considerable debates. The Adang Volcanics have mafic to mafitic-intermediate characteristics (SiO2 : 46 - 56 wt%) and a wide range of high alkaline contents (K2 O: 0.80 - 9.08 %; Na2 O: 0.90 - 7.21 %) with the Total Alkali of 6.67 - 12.60 %. Al2 O3 values are relatively low (10.63 - 13.21 %) and TiO2 values relatively high (1.27 - 1.91 %). Zr and REE concentrations are also relatively high (Zr: 1154 - 2340 ppm; Total REE (TREY = TRE): 899.20 - 1256.50 ppm; TRExOy: 1079.76 - 1507.97 ppm), with an average Zr/TRE ratio of ~ 1.39. The major rock forming minerals are leucite/pseudoleucite, diopside/aegirine, and high temperature phlogopite. Geochemical plots (major oxides and trace elements) using various diagrams suggest the Adang Volcanics formed in a postsubduction, within-plate continental extension/initial rift tectonic setting. It is further suggested magma was generated by minor (< 0.1 %) partial melting of depleted MORB mantle material (garnet-lherzolite) with the silicate melt having undergone strong metasomatism. Melt enrichment is reflected in the alkaline nature of the rocks and geochemical signatures such as Nb/Zr > 0.0627 and (Hf/Sm)PM > 1.23. A comparison with the Vulsini ultrapotassic volcanics from the Roman Province in Italy shows both similarities (spidergram pattern indicating affinity with Group III ultrapotassics volcanics) and differences (nature of mantle metasomatism). Keywords: Adang Volcanics, sodic and potassic/ultrapotassic, within-plate continental extension/initial rift, metasomatized silicate melts, leucite/pseudoleucite © IJOG - 2016. All right reserved Introduction Large parts of the Western Sulawesi Prov- ince are covered by thick (up to 5000 m) piles of Upper Cenozoic shoshonitic to ultra-potassic and subordinate sodic volcanic rocks together with associated intrusives and volcaniclastics. he volcanic rocks occurring in the central part of the province have been subdivided into four units, these are Sekala Formation, Sesean,Adang, and Talaya Volcanics (Ratman and Atmawinata, 1993). The Adang Volcanics are the subject of INDONESIAN JOURNAL ON GEOSCIENCE Geological Agency Ministry of Energy and Mineral Resources Journal homepage: h p://ijog.geologi.esdm.go.id ISSN 2355-9314, e-ISSN 2355-9306 Accredited by: - LIPI, valid August 2016 - August 2021 - RISTEKDIKTI, valid May 2016 - May 2021
- 2. Indonesian Journal on Geoscience, Vol. 3 No. 3 December 2016: 195-214 196 this paper. Their locations are shown in Figure 1. The unit consists of a sequence about 400 m thick of poorly bedded leucite-bearing lapilli tuff, volcanic breccias consisting of leucite basalt fragments embedded in leucite-bearing tuffaceous matrix, and leucite basalt flows (Ratman and At- mawinata, 1993). Major element analyses carried out previously on a number of samples suggest the Adang Volcanics are mafic to intermediate in composition, ranging from trachyte to tephrite and phonolite (Sukadana et al., 2015). Waele and Muharam (2014) describe the rocks as phlogopitic and leucitic volcanic rocks. TheAdang Volcanics interfinger with the marine sedimentary Mamuju Formation, which has a latest Miocene to Early Pliocene age (Ratman and Atmawinata, 1993), and have yielded K/Ar ages of 5.4 and 2.4 Ma (Bergman et al., 1996). The morphology of the volcanics is youthful, showing a volcanic centre and several domal structures (Sukadana et al., 2015). Opinions differ regarding the origin of these and other high-K rocks in the province: 1. Magmatism took place in a postsubduction, continental-margin rift setting with the source mantle having been metasomatized by previ- ous subduction processes (e.g. Yuwono et al., 1985; Leterrier et al., 1990); 2. The volcanic rocks were formed in an Active Continental Margin (ACM) setting in which magma was generated from mantle melting in the final stage of the subduction process (Pus- pita et al., 2005), which involved subduction of microcontinental crust (Sukadana et al., 2015); 3. The volcanics developed as the result of col- lision between the Banggai-Sula fragment and western Sulawesi (Bergman et al., 1996). The goal of the research is to deduce from the magmatic typology of the Adang Volcanics, their tectonic setting, and the nature of submantle enrichment, using the geochemical approach. The studied area is defined by the following coordinates 118°45’11.10”E - 119°5’13.41”E and 2°33’28.27”S - 2°59’34.52”S, covering the Subregencies of Kalukku, Mamuju, Tabulahan, Simboro, Tapalang, and Malunda. Materials and Methods For this purpose, six outcrop samples (loca- tions shown on Figures 1a, b, and 2) were sub- Figure 1. (a). Geological map of central Western Sulawesi (Ratman and Atmawinata, 1993) showing the location of the researched area and the six samples described in the text. Coordinate system UTM Zone 50S; (b). Simplified geological map of Sulawesi (modified after Sukamto, 1975b; Hamilton, 1979; Silver et al., 1983; Parkinson, 1991, in Van Leeuwen and Pieters, 2011). Western Sulawesi (dashed line) subdivided into NW (northwest; north part of Western Sulawesi), CW (central-west), and SW (southwest) Sulawesi. North Sulawesi Trench MakassarStrait Northern Sulawesi Easthern Sulawesi CW NW SW SangiheTrench Batui Trust Matano Fault Neogene sedimentary rocks Paleogene sedimentary rocks Mesozoic sedimentary rocks Pliocene-Recent volcanics Neogene calc-alkaline volcanics Neogene potassive volcanics Paleogene volcanics Intrusive rocks Metamoorphic rocks Ophiolite Major thrust Major strike-slip fault ToloTrench WalanaeFault Palu-KoroFault 100 km o 2 N o 2 N o 2 S o 2 S o 6 S o 6 S o 120 E o 124 E o 120 E o 124 E 9.715.0009.710.0009.705.000 Tma (Adang Volcanic), (Mid -- Late Miocene) Tmtv (Talaya Volcanic) Kls (Latimojong Formation) Tmpi (Granitoid complex) Mamuju City 9.700.0009.695.0009.690.0009.685.0009.680.000 Riftingfault 695.000 700.000 N N 0 6 12 km 705.000 710.000 715.000 720.000 725.000 730.000 735.000 a b
- 3. Geochemical Signatures of Potassic to Sodic Adang Volcanics, Western Sulawesi: Implications for Their Tectonic Setting and Origin (Godang, S. et al.) 197 jected to major oxide, trace element, and rare earth element (REE) analyses (Tables 1 and 2). The rocks were petrographically also studied in order to support the interpretation of the geo- chemical data. Geochemical analyses involved XRF and four acids digest (ICP-OES/MS, ICP- REE) assay methods, which were carried out at Intertek Laboratories in Jakarta and Perth. In addition, trace element data have been plotted on various diagrams previously obtained from 31 company drill core samples, and major oxide data for 36 previously analyzed outcrop samples for which LOI contents were not determined. These samples were also analyzed in the Intertek Laboratories. Field Relationships The field and petrologic observations indicate that the Adang Volcanics, covering an area of ~820 km2 (Ratman and Atmawinata, 1993), are composed predominantly of leucite/pseudoleu- cite-bearing trachytic tuff, lapilli-tuff, agglom- erate, volcanic breccia, volcanic-sedimentary products (volcaniclatics consisting of trachytic weathering residue, trachytic fragments), vol- caniclastics and lava intercalations of mafic/ mafitic-intermediate composition (consisting of leucite/pseudoleucite, diopside/aegirine and high temperature phlogopite). Other rocks observed locally include peralkaline dyke, a mafic trachyte body, multiple dykes of mafic and leucitic intru- sions, subvolcanic sanidine trachyte intrusion, intercalations of crystalline limestone, and other carbonate rocks. The limestone intercalations and the presence of pillow lavas indicate the Adang Volcanics were deposited in a marine environ- ment. Figures 3 and 4 show how the volcanics occur in the field. Analytical Results The mineralogy of three samples in thin secton is shown in Figures 5 - 7. Moreover, major and trace element results for the six samples presented in Tables 1 and 2 respectively have a Mafic Index ofAlteration (MIA(o)) ranging from 31.6 to 45.9 (Figure 8). This suggests that all six samples were Figure 2. Image of DEM-SRTM (ASTER 30m) and the position of sampling points. Mamuju City Tma TmtvSample for Petrographic (GS1-0607-10) Sample for Petrographic (GS1-0926-28) Sample for Petrographic (GS1-0016-17) Kls Tmpi Riftingfault 9.715.0009.710.0009.705.0009.700.0009.695.0009.690.0009.685.0009.680.000 695.000 700.000 705.000 710.000 715.000 720.000 725.000 730.000 735.000 1600 m 1500 m 1400 m 1300 m 1200 m 1100 m 1000 m 900 m 800 m 700 m 600 m 500 m 400 m 300 m 200 m 100 m 0 m N 0 4.5 9 km
- 4. Indonesian Journal on Geoscience, Vol. 3 No. 3 December 2016: 195-214 198 fresh (after Nesbitt and Wilson, 1992), including two samples (No.82 and No.1002) with relatively high LOI contents (4.3 - 5.7 wt%). This is sup- ported by petrographic observations (Figures 7a, b). The Adang Volcanics samples are mafic/ mafitic - intermediate in composition with rela- tively low SiO2 contents (46 - 56 wt%). Na2 O and K2 O contents show a wide range of values, 0.90 - 7.21 wt% and 0.80 - 9.08 wt%, respectively. Four of the samples have high K2 O contents (7.86 and 9.08 wt%) and Na2 O contents varying between 0.90 and 3.52 wt%, which classifies these rocks as ultrapotassic (Foley et al., 1987). The other two samples have high Na2 O contents (5.52 and 7.21 wt%) and low K2 O values, indicating they have a sodic composition. It is these two samples that also have high LOI contents, possibly indicating the presence of primary volatiles. Al2 O3 contents are relatively low (10.63 - 13.21 wt%) and TiO2 contents relatively high (1.27 - 1.91 wt%) (typi- cal of nonsubduction volcanics {TiO2 > (-1.161 + 0.1935 x Al2 O3 ), (in wt%)} (Figure 9) (Muller and Groves, 1993 and 2000). Zircon concentrations are high (1,154.00 - 2,3440.00), the Total REE (TREY = TRE) ranges between 899.20 and 1256.50 ppm, and TRExOy between 1079.76 and 1507.97 ppm (Table 2). The percentage of LREE is 88.23 % (La–Sm) and that of HREE 11.77% (Eu–Y). The Th/U ratio is ~ 4.32/1, indicating a “Non-Uranium anomaly”, based on a Th/U ratio of ~ 3/1 {normal abundance of the earth crust : Th (6 ppm), U (1.8 ppm)} (https://en.wikipedia.org). Relatively high radio- metric signatures (200 - 419 cps) may be related to relatively high contents of Zr, K, Th, U, and Ba (Figure 3g). Interpretation of Results The analytical results on various diagrams have been plotted in a diagram to classify the Adang Volcanics, and to elucidate their tectonic setting and the processes in the source mantle that led to their formation. On the TAS diagram of Le Bas et al. (1986) most samples (including the 36 other samples) Table 1. Major Oxides (wt%) of Six Samples (Adang Volcanics) No Sample_code 28 GS1-0016-17 75 GS1-0481-85 82 GS1-0533-36 99 GS1-0607-10 121 GS1-0280-86 1002 GS1-0926-28 Rock_types Fine Trachyte Mafic Trachyte Leucitic Trachyte Mafic Trachyte Mafic Trachyte Fine Trachyte Area Salu Dango Takandeang Ampalas Botteng Bebanga Tapalang SiO2 (%) 55.48 49.28 54.86 50.79 49.15 53.74 TiO2 (%) 1.91 1.77 1.27 1.45 1.70 1.70 Al2 O3 (%) 10.91 10.92 13.21 10.63 11.89 12.10 Fe2 O3 (%) 11.78 10.80 7.50 9.82 12.80 11.42 FeO (%) 2.15 2.04 2.83 2.04 3.68 1.49 MnO (%) 0.25 0.19 0.12 0.14 0.18 0.14 MgO (%) 2.54 5.87 3.00 6.19 3.53 2.11 CaO (%) 2.03 6.98 3.83 7.25 4.57 3.32 Na2 O (%) 3.52 0.90 5.52 1.40 1.89 7.21 K2 O (%) 9.08 9.03 1.15 7.86 8.16 0.80 LOI (%) 0.90 1.32 5.70 1.21 1.20 4.32 P2 O5 (%) 0.22 0.86 0.55 0.56 0.46 0.22 Total (%) 100.76 99.96 99.54 99.34 99.21 98.56 TA=Na2 O+K2 O 12.60 9.93 6.67 9.26 10.05 8.01 K2 O/Na2 O 2.58 10.03 0.21 5.61 4.32 0.11 Cr2 O3 (%) 0.006 0.01 <0.005 0.04 0.04 <0.005 Radiometric 345 cps 255 cps 419 cps 200 cps 250 cps 210 cps
- 5. Geochemical Signatures of Potassic to Sodic Adang Volcanics, Western Sulawesi: Implications for Their Tectonic Setting and Origin (Godang, S. et al.) 199 Table 2. Trace Element Concentrations (ppm) in Six Samples (Adang Volcanics) No Sample_code 28 GS1-0016-17 75 GS1-0481-85 82 GS1-0533-36 99 GS1-0607-10 121 GS1-0280-86 1002 GS1-0926-28 Rock_types Fine Trachyte Mafic Trachyte Leucitic Trachyte Mafic Trachyte Mafic Trachyte Fine Trachyte Cr 5.00 56.00 30.00 197.00 5.00 5.00 Cu 128.00 144.00 122.00 104.00 199.00 96.00 Mn 1,600.00 1,320.00 831.00 965.00 1,150.00 838.00 Ni 14.00 46.00 35.00 116.00 17.00 11.00 P 900.00 3,740.00 2,410.00 2,510.00 2,020.00 870.00 S 90.00 <50 1,330.00 160.00 1,150.00 60.00 Sc 7.00 21.00 9.00 23.00 11.00 8.00 Ti 11,300.00 11,000.00 8,030.00 9,180.00 10,100.00 9,650.00 V 254.00 218.00 177.00 210.00 350.00 319.00 Zn 162.00 136.00 130.00 133.00 180.00 101.00 Ag <0.1 0.30 0.30 0.30 0.50 0.40 As 17.00 6.00 29.00 5.00 15.00 4.00 Ba >5000 2,450.00 4,970.00 4,270.00 >5000 >5000 Be 34.20 19.80 28.40 25.10 28.30 39.00 Bi 1.57 1.53 0.72 0.89 2.49 0.95 Cd 1.36 0.75 0.75 0.83 1.10 1.06 Co 22.00 33.00 23.00 30.00 28.00 17.00 Cs 32.30 57.70 50.60 68.20 31.60 214.00 Ga 21.40 20.20 23.70 20.10 24.30 23.00 Ge 0.40 0.60 0.40 0.80 0.20 0.60 Hf 61.50 36.60 35.20 31.90 45.30 47.20 In 0.07 0.08 0.06 0.08 0.11 0.10 Li 61.50 33.10 33.30 30.80 52.00 12.60 Mo 0.30 0.30 1.80 0.40 0.30 0.20 Nb 192.00 102.00 117.00 94.70 121.00 104.00 Pb 330.00 143.00 293.00 147.00 313.00 203.00 Rb 336.00 636.00 614.00 2,126.26 498.00 1,310.00 Sb 0.60 0.40 1.40 0.70 0.80 0.70 Re <0.05 <0.05 <0.05 <0.05 <0.05 <0.05 Se <1 <1 <1 <1 <1 <1 Sn 29.80 18.10 24.00 15.60 25.70 31.00 Sr 699.00 1,350.00 930.00 1,300.00 1,410.00 769.00 Ta 10.00 5.83 6.38 4.82 7.30 8.44 Te <0.1 <0.1 <0.1 <0.1 0.10 <0.1 Th 310.00 154.00 266.80 167.80 230.30 324.10 Tl 4.84 2.66 1.48 3.43 5.52 12.90 U 62.80 32.60 68.10 45.80 51.30 75.50 W 3.00 4.50 18.40 3.20 8.60 2.30 Zr 2,340.00 1,384.00 1,269.00 1,154.00 1,549.00 1,651.00 Average % REE La 277.00 230.60 234.20 194.20 263.60 292.30 248.65 22.28% LREE= 88.23% Ce 552.00 445.40 429.70 371.90 513.70 469.00 463.62 41.54% Pr 59.60 52.90 47.50 44.30 58.20 63.10 54.27 4.86% Nd 194.00 196.60 166.70 159.70 191.20 211.00 186.53 16.71% Sm 32.30 32.80 27.40 26.20 33.70 37.70 31.68 2.84% Eu 5.80 6.10 4.90 4.70 6.50 7.20 5.87 0.53% HREE = 11.77% Gd 21.70 21.80 20.20 18.10 24.40 30.40 22.77 2.04% Tb 3.10 3.00 2.70 2.40 3.20 4.00 3.07 0.27% Dy 16.30 13.10 12.60 10.90 15.20 19.20 14.55 1.30% Ho 2.50 2.10 2.00 1.70 2.60 3.40 2.38 0.21% Er 7.10 5.40 5.40 4.90 6.40 8.90 6.35 0.57% Tm 0.90 0.80 0.90 0.60 0.90 1.20 0.88 0.08% Yb 5.70 4.20 4.60 3.70 5.40 7.40 5.17 0.46% Lu 0.70 0.30 0.60 0.60 0.80 1.00 0.67 0.06% Y 67.60 61.90 63.20 55.30 69.40 100.70 69.68 6.24% TRE 1,246.30 1,077.00 1,022.60 899.20 1,195.20 1,256.50 TREO 1,391.46 1,202.53 1,142.18 1,004.26 1,334.62 1,404.64 TRExOy 1,497.89 1,292.80 1,228.36 1,079.76 1,435.94 1,507.97 TRE2 O3 1,464.03 1,265.29 1,201.96 1,056.78 1,404.32 1,478.70 dEu 0.67 0.70 0.64 0.66 0.69 0.65 *The average values of Th (242.17 ppm) and U (56.02 ppm); average Th/U ratio = 4.32/1, Zr/TRE (avg) = 1.39
- 6. Indonesian Journal on Geoscience, Vol. 3 No. 3 December 2016: 195-214 200 a g j b h e k c i f l L d Figure 3. Field observation photos of Adang Volcanics. (a) Volcaniclastic rock (consists of trachytic fragments); (b) Boul- der of trachyte lava; (c) Crystalline limestone; overlies the Adang rocks, indicating that it formed after volcanic activ- ity had ceased; (d) Intercalation of heavy concentrate-rich sediment in Adang trachytic rock, indicating the volcanics were deposited in a submarine environment (drill sample A07_14-15m); (e) Pyroclastic sodic-rich fine-grained trachyte breccia (East Tapalang region); (f) Peralkaline dyke (silica and alumina undersaturated), sample of fine-grained trachyte No. 28 (GS1-0016-17); (g) Portable Dosimeter (Thermo Scientific tester), showing relatively high radiometric signature (255 cps) of mafic trachyte rock (sample GS1-0481-85, No.75) with low U (32.60 ppm), Th (154.00 ppm), high Zr (1384 ppm), Ba (2450 ppm), high K (K2 O: 9.03 wt% and Na2 O (0.90%); (h) The marine sedimentary rock (clastic carbonate; drill sample M01_14-15m); (i) Magnifier 40x manual close-up of zircon crystal (tetragonal, yellow), drill sample C03_10-11m; (j) Magnifier 40x manual close-up of green diopside (monoclinic) in leucite trachyte; (k) Leucite trachyte (drill sample A29_22-23m) containing zircon crystal; (l) Magnifier 40x manual close-up of zircon crystal (tetragonal, colorless) from (k) leucite trachyte. plot in the trachybasalt and basaltic-trachyandesite fields (Figure 10). The two sodic samples fall under the basaltic-trachyandesite field, while the remaining “other samples” are in the tephrite and alkali-basalt fields. On the K2 O vs. SiO2 diagram (after Peccerillo and Taylor, 1976) (Figure 11) the Adang Volcanics are represented by three series: potassic alkaline, alkaline, and subalkaline. If the recently developed GodangsTrapezoid Geochem- istry Diagram (Godang, 2016) is used which also
- 7. Geochemical Signatures of Potassic to Sodic Adang Volcanics, Western Sulawesi: Implications for Their Tectonic Setting and Origin (Godang, S. et al.) 201 some in the ultrapotassic-series field. A plot on the Rock Classification Diagram of Pearce (1996), which is based on relatively immobile trace ele- takes Al2 O3 and NaO contents into consideration (Figure 12), most of the 43 samples plot in the sodic-series and shoshonitic-series fields, and Figure 4. Nature of the Adang volcanic rock textures, showing variation in: (a-f) trachytic textures, (g) mafic aphanitic texture (sample GS1-0481-85), (h) ‘pelitic like’ texture (sample GS1-0926-28), and (i) ‘green pelitic like’ texture (sample GS1-0016-17). PPL XPL a Thin section mineralogy (GS1-0016-17) leucite pyroxene (diopside) phlogopite phlogopite diopside needles in groundmass 250 µm b “Leucite pyroxene (diopside) phlogopite Lamproite” Mineralogy (% volume): *Leucite: 52% * Pyroxene (diopside): 35% *Phlogopite: 12% * Apatite : < 1% Total = 100% 250 µm phlogopite phlogopite diopside needles in groundmass leucite pyroxene (diopside) Thin section mineralogy (GS1-0016-17) Figure 5. (a) Petrographic (PPL) sample GS1-0016-17 (No. 28; fine-grained trachyte; peralkaline dyke); (b) Petrographic (XPL) sample GS1-0016-17 (No. 28; fine-grained trachyte; peralkaline dyke) showing abundant leucite (52%), interpreted as lamproite. d g e h f i a b c leucite phenocryst (mela-trachyte) medium-grained (leucite trachyte) medium-grained (leucite-rich mela-trachyte) coarse-grained (leucite trachyte) fine-grained (leucite trachyte sub-volcanic sanidine phenocryst trachyte fine-grained (sodic-rich trachyte breccia) very fine-grained (peralkaline dyke) mafic trachyte
- 8. Indonesian Journal on Geoscience, Vol. 3 No. 3 December 2016: 195-214 202 Figure 6. (a) Petrographic (PPL) sample GS1-0607-10 (No. 99; mafic trachyte dyke). (b) Petrographic (XPL) sample GS1- 0607-10 (No. 99; mafic trachyte dyke) showing abundant leucite (40%), intrepeted as lamprophyre. Figure 7. (a) Petrographic (PPL) sample GS1-0926-28 (No. 1002; sodic-rich fine-grained trachyte volcanic breccia) shows clearly unaltered condition. (b) Petrographic (XPL) sample GS1-0926-28 (sodic-rich fine-grained trachyte volcanic brec- cia) : pseudoleucite (70%): an intergrowth of albite, nepheline, orthoclase; interpreted as lamproite. ments, indicates that the rocks are of trachyte af- finity (Figure 13), consistent with the TAS results. As a comparison, data for a leucite phonolite have been plotted from theVulsiniVolcano, Roman Province, Italy (Santii et al., 2003) on Figure 11, which shows the rock belongs to the ultrapotas- sic sub-alkaline series (alkaline-calcic character, alumina oversaturated). It should be noted that its alumina content (Al2 O3 : 19.97 - 20.37 %) is sig- nificantly higher than that of the Adang Volcanics (Al2 O3 : 10.63 - 13.21 %). Using the diagram designed by Muller and Groves (1994) to discriminate the tectonic settings of potassic to ultrapotassic rocks, the plotting result shows that the Adang Volcanic samples fall within the anorogenic within-plate field (Figures 9 and 14). In contrast, the Vulsini Volcanics appear to have formed in an arc-related tectonic setting (Alkaline Continental Arc; Supra-subduction Continental Volcanic Arc). Similar settings for the two units are suggested by plots on tectonic discriminant dia- grams for mafic rocks using trace elements shown on Figure 15 (after Hollocher et al., 2012b) (http:// minerva.union.edu), Figure 16 (after Wang et al., 2001; modified in this paper), and Figure 17 (after Sun et al., 2006; modified in this paper). Thin section mineralogy (GS1-0607-10) Thin section mineralogy (GS1-0607-10) “Leucite pyroxene phlogopite lamprophyre” Mineralogy (% volume): *Leucite: 40% * Clinopyroxene (diopside & aegirine): 20% * Phlogopite: 10% *Apatite: <<1% *Opaque grains/masses: 3% *Glass materials (groundmass): 5% *Vesicles (voids): 10% *Clay minerals: 6% *Zeolite (secondary): 5% Total = 100% Vesicle filled with zeolite Amphibole pseudomorph PPL XPL Clinopyroxene Phlogopite a b Clinopyroxene Vesicle filled with zeolite Diopside needles in groundmass Amphibole pseudomorph Leucite Clinopyroxene Diopside needles in groundmass Leucite Phlogopite Clinopyroxene Thin section mineralogy (GS1-0926-28) Pyroxene inclusions Phlogopite 125 µm a PPL Pyroxene inclusions Phlogopite 125 µm b pseudoleucite Pyroxene (aegirine) needlesin groundmass PPL Thin section mineralogy (GS1-0926-28) “Leucite? pyroxene (diopside/aegirine) phlogopite Lamproite” Mineralogy (5 volume): * Pseudoleuctite: 70% *Pyroxene (diopside/aegirire): 27% *Phlogopite: <1% *Nosean: <1% *Opaque: <1% Total = 100% Rock Class (Pearce, 1996): Sodic-rich fine-treachyte SiO (53.74%), NA O (7.21%, K O (0.80%), Al O (12.10%)2 2 2 2 3 Pyroxene (aegirine) needlesin groundmass pseudoleucite
- 9. Geochemical Signatures of Potassic to Sodic Adang Volcanics, Western Sulawesi: Implications for Their Tectonic Setting and Origin (Godang, S. et al.) 203 Altered (weathered) Unaltered (unweathered) Ternary Diagram of Weathered/Unweathered Mafic/Basaltic Rock (after Nesbitt and Wilson, 1992), modified by Babechuk et al., 2014 (MIA(o)) [Ternary : (Al O +Fe O (t))-(CaO*+Na O+K O)-MgO (in molar)]2 3 2 3 2 2 MIA(o)= Mafic Index of Alteration (oxidized) MgO Symbols: Adang Volcanics: : Mafic Trachyte Fine-grained Trachyte .. Leucitic Trachyte Vulsini Volcanics (Roman, Italy) Others Adang Trachytic rocks C (Al O +Fe O (t))2 3 2 3 A 0 10 20 30 40 50 60 70 80 90 100 0 10 20 30 40 50 60 70 80 90 1000 10 20 30 40 50 60 70 80 90 100 (CaO*+Na O+K O)2 2 B Figure 8. Plots in Ternary Diagram of weathered/unweathered rock (after Nesbitt and Wilson, 1992), showing all Adang Volcanic samples (6), others Adang Trachytic rocks (36 outcrop samples) and Vulsini Volcanic samples (5) are fresh showing unweathered rocks. Figures 18 and 19 are diagrams designed by La Fleche et al. (1998) for mafic rocks to identify different metasomatic processes in the mantle. Plots of the six Adang Volcanic outcrop and 31 drill core samples suggest that the rocks were formed by mantle metasomatism during the silicate melting processes, whereas the Vulsini Volcanics were derived from a hydrated mantle Arc-related Within-plate TiO = -1.1610 + 0.1935xAl O 2 2 3 Al O (wt%)2 3 TiO(wt%)2 6 7 8 9 10 11 12 13 14 15 16 17 18 19 20 21 22 4.5 4.0 3.5 3.0 2.5 2.0 1.5 1.0 0.5 0 Symbols: Mafic Trachyte Leucitic Trachyte Others Adang Trachytic rocks Adang Volcanics Fine-grained Trachyte Vulsini Volcanics (Roman, Italy) Figure 9. Geotectonic diagram for within-plate vs. Arc-related (Muller and Groves, 1993 and 2000) suggesting the Adang Volcanics, others Adang trachytic rocks and Vulsini Volcanic rocks were formed in different tectonic settings.
- 10. Indonesian Journal on Geoscience, Vol. 3 No. 3 December 2016: 195-214 204 Figure 11. Volcanic rocks classification for orogenic zone (K2 O vs. SiO2 , wt%), (Peccerillo and Taylor, 1976). The depth to Benioff Zone 15 (modified by Fadlin and Godang, 2015 (in Godang, 2015; after Hatherton and Dickinson, 1969). The plotting result of Vulsini Volcanic (Table 3) shows ultrapotassic rocks whereas the Adang Volcanics and others Adang trachytic rocks showed medium-K calc-alkaline to potassic peralkaline. Figure 10. Plot in TAS Diagram (after Le Bas et al., 1986) Vulsini Volcanics show peralkaline magma series (silica under- saturated), whereas Adang Volcanics and other Adang trachytic rocks show subalkaline to peralkaline series. high-K basalt Absarokite low-K dacite medium-K dacite high-K dacite low-K rhyolite medium-K rhyolite high-K rhyolite high-K (Calc-alkaline series) medium-K (Calc-alkaline series) low-K (Tholeiitic series) medium-K andesite Banakite low-K basaltic-andesite Alkaline vs. subalkaline (Keith, 1983) Potassic alkaline (after Calanchi et al., 2002) basalt (TAS) basaltic-andesite andesite (TAS) dacite and rhyolite (TAS) 100 km 200 km 250 km 300 km 350 km 400 km KO(wt%)2 SiO (wt %)2Mafic Intermediate Felsic Symbols: Adang Volcanics MaficMafic Trachyte Fine-grained Trachyte Leucitic Trachyte Vulsini Volcanics (Roman, Italy) Others Adang Trachytic rocks 50 km 150 km low-K andesite high-K andesite Shoshonite series medium-K basaltic-andesite high-K basaltic-andesite Shoshonite medium-K basalt low-K basalt 45 46 47 48 49 50 51 52 53 54 55 56 57 58 59 60 61 62 63 64 65 66 67 68 69 70 71 72 73 74 75 76 77 78 10 9 8 7 6 5 4 3 2 1 0 source (subduction arc-related). This is reflected in the relatively high Zr and REEs contents (with geochemical signature (Hf/Sm)PM > 1.23) of the Adang rocks, and low Zr contents rela- tive to Total REE (with geochemical signature (Hf/Sm)PM < 1.00) of the Vulsini volcanic rocks (Table 3). Figure 20 (diagram after Aldanmaz et al., 2000; modified in this paper) suggests the mantle source from which the Adang Volcanics Note: * ol = CIPW normative olivine. * P.I = Peralkaline Index (mol), (Na O+K O)/Al O2 2 2 3 basalt basaltic andesite andesite dacite basanite (ol > 10%) tephrite (ol < 10%) phonotephrite tephriphonolite phonolite trachy basalt trachyandesite basaltic trachyandesite - trachyte (P.I < 0.875) alkali trachyte (P.I > 0.875) rhyolite (P.I < 0.875) alkali rhyolite (P.I > 0.875) foidite Alkaline vs. Subalkaline (Miyashiro, 1978) Saturation Line Symbols : Adang Volcanics: Leucitic Trachyte Vulsini Volcanics (Roman, Italy) Others Adang Trachytic rocks. alkali-basalt Mafic Trachyte Fine-grained Trachyte picro- basalt NaO+KO(wt%)22 18 17 16 15 14 13 12 11 10 9 8 7 6 5 4 3 2 1 0 SiO (wt%)2Mafic Intermediate Felsic 36 37 38 39 40 41 42 43 44 45 46 47 48 49 50 51 52 53 54 55 56 57 58 59 60 61 62 63 64 65 66 67 68 69 70 71 72 73 74 75 76 77 78 79 80 81
- 11. Geochemical Signatures of Potassic to Sodic Adang Volcanics, Western Sulawesi: Implications for Their Tectonic Setting and Origin (Godang, S. et al.) 205 Figure 12. Plots in Godangs Trapezoid Geochemistry Diagram (Godang, 2016). The Vulsini Volcanics show the ultrapo- tassic subalkaline (alkaline-calcic character, alumina oversaturated; higher Al2 O3 contents), whereas Adang Volcanics and others Adang rocks show a contrast multimagmatic affinity (sodic series, shoshonitic, potassic, and ultrapotassic with alumina from oversaturated to undersaturated). Madupitic lamproite indicates ultrapotasic alkaline - peralkaline, whilst Virunga Volcanics are shoshonitic subalkaline - alkaline - peralkaline. Figure 13. Rock Classification Diagram (Pearce, 1996) showing Adang Volcanics, others Adang trachytic rocks and Vul- sini Volcanics to have trachytic composition, whereas Virunga Volcanics (East African Rift) and Madupitic lamproite (Leucite Hills) showing the foiditic composition. Peralkaline Sub-alkaline(M eta-Peralum inous) A lkaline K O/Na O = 2/1 2 2 NaO/AlO,(molar)223 enrichment of Zr and/or REEs (alkaline-calcic) A ndesine O ligoclase A lbite Labradorite Bytow nite Anorthite Ab OrAn Shoshobitic series Sodic series transition alkaline Sodic calc-alkaline Potassic calc-alkaline Potassic series Ultra-potassic series Mostly weathered/alteredMostly weathered/altered (or Potassic mafic rocks) An 50% (strong Ca-) Ab 50% (strong Na-) (Calc-alkaliinesub-group) afterDeeretal.,1963(approx) Anorthoclase Phlogopite Microcline Sanidine Biotite Leucite Kalsilite NephelineNepheline Godangs Trapezoid Geochemistry Diagram (2016) Discrimination of Alkaline type of Igneous rocks for Ultra-potassic-Potassic-Shoshonitic-Sodic-Calc-alkaline rocks. (after Shand, 1927 (alumina saturation), after Turner et al., 1996 (ultra-potassic and sodic series)) Calc-alkaline sub-group * Calc-alkaline (Sodic, Potassic) * Tholeiitic Vulsini Volcanic : Ultra-potassic Sub-alkaline [Na O+K O]/Al O , (molar)2 2 2 3 Symbols : Adang Volcanics Mafic Trachyte Fine-grained Trachyte Leucitic Trachyte Vulsini Volcanics (Roman, Italy) Others Adang Trachytic rocks. Madupitic Lamproite (Badgers Teeth, Leucite Hills) Nyiragongo 2002 lava & Older lavas, Virunga Volcanics (East African Rift) K O/Na O = 1.52/1 2 2 K O/Na O = 1.24/1 2 2 K O/Na O = 1/1 2 2 K O/Na O = 1/2 (wt %) 2 2 0 0.10 0.20 0.30 0.40 0.50 0.60 0.70 0.80 0.90 1.00 1.10 1.20 1.30 1.40 1.50 1.05 1.00 0.90 0.80 0.70 0.60 0.50 0.40 0.30 0.20 0.10 0 Z/Ti(ppm) Andesite-basaltic Basalt RhyoliteRhyolite DaciteDacite Alkali Rhyolite Foidite Trachyte Alkali Basalt Trachy-andesite Tephriphonolite Phonolite Basic Intermediate Evolved Nb/Y (ppm)Sub-alkaline Alkaline Ultra-alkaline Symbols : AdangAdang Volcanics Mafic Trachyte Fine -grained Trachyte Leucitic Trachyte Vulsini Volcanics (Roman, Italy) Others Adang Trachytic rocks Madupitic Lamproite (Badgers Teeth, Leucite Hills) Nyiragongo 2002 lava & Older lavas, Virunga Volcanics (East African Rift) 0.01 0.05 0.1 0.5 1.0 5.0 10 50 100 1.0 0.5 0.1 0.05 0.01 0.01 0.005 0.001
- 12. Indonesian Journal on Geoscience, Vol. 3 No. 3 December 2016: 195-214 206 Figure 15. Tectonic discrimination diagram for Basalts (after Hollocher et al., 2012b). Magmatic Affinity: ratio LaYb for Tholeiitic--Transitional--Calc-alkaline to Alkaline (MacLean and Barrett, 1999), ratio Th/Nb (after Sun et al., 2006). Plot in Figure 15 and overlaying with Figure 14, the result showed Adang Volcanics were formed in within-plate continental extension zone/initial rift and Vulsini Volcanics formed in alkaline arcs, whereas Virunga Volcanics (East African Rift) were formed from within-plate oceanic island and the magma is possible generated from ‘mantle plume’? Madupitic lamproite (Leucite Hills) shows a lower HREE signature (La/Yb ~ 800). Figure 14. Tectonic discrimination diagram for high-K igneous rocks (Muller and Groves, 1994) suggesting the Adang Volcanics, other Adang trachytic rocks were formed in different tectonic settings. 0.4 0.5 1 5 10 50 100 5 4 3 2 1 0.5 0.1 0.05 0.02 Tholeiitic Transitional Calc-alkaline to alkaline (peralkaline) La/Yb <3 La/Yb = 3 - 6 La/Yb > 6 Th/Nb - 0.11/1 Th/Nb = 0.27/1 Hawaiite OIBOIB Lower crust PM Th/Nb(inppm) La/Yb (in ppm) Oceanic arcs (IAB) Continental arcs (ACM) Alkaline arcs (or within-plate continental rift) MORB Oceanic islands (or within-plate oceanic crust basalts) OIB,EMORB,T-MORB,Mantleplume (tholeiitic) lower HREE signature (La/Yb ~ 800). Symbols: Adang Volcanics: Mafic Trachyte Fine-grained Trachyte Leucitic Trachyte Vulsini Volcanics (Roman, Italy) Trachytic rocks (company drill data) Madupitic Lamproite (Badgers Teeth, Leucite Hills) Nyiragongo 2002 lava & Older lavas, Virunga Volcanics (East African Rift) Th/Nb = 0.67/1 Intracontinentalrift (alkalibasalts) Continentalextensionalzone/initialriftbasalts (oralkalinearcs) TiO / Al O (in wt%)2 2 3 Zr/AlO23 (Zrinppm,AlOinwt%)23 within-platearc-related Within-plate ( anorogenic) Continental Arc (or ACM) + Post-collisional Arc Initial oceanic arc, Late oceanic arc (Subduction Ocean crust-Ocean crust) 0.001 0.005 0.01 0.05 0.1 0.5 1 1.000 500 100 50 10 5 1 Symbols : Adang Volcanics: Mafic Trachyte Fine-grained Trachyte Leucitic Trachyte Vulsini Volcanics (Roman, Italy) Others Adang Trachytic rocks
- 13. Geochemical Signatures of Potassic to Sodic Adang Volcanics, Western Sulawesi: Implications for Their Tectonic Setting and Origin (Godang, S. et al.) 207 Figure 16. Tectonic discrimination diagram for basalts (after Wang et al., 2001; modified in this paper). Overlaying with Figure 14 suggesting the Adang Volcanics were formed in within-plate continental extension zone/initial rift, Vulsini Volcanics were formed in an arc-related (alkaline arcs; supra-subduction continental volcanic arc) and Virunga Volcanics were formed in mantle plume. Figure 17. Tectonic discrimination diagram for basalts (after Sun et al., 2006; modified in this paper). Overlaying with Figure 14 suggesting the Adang Volcanics were formed in within-plate continental extension zone/initial rift, Vulsini Volcanics was formed in an arc-related (alkaline arcs; supra-subduction continental volcanic arc) and Virunga Volcanics (East African Rift) were formed in mantle plume, but the plot result of Madupitic lamproite (Leucite Hills) showed the difference tectonic setting (after Wang et al., 2001 and after Sun et al., 2006) is possible indicating to an interaction of two magma sources. enrichedmantlesourcedepletedmantlesourceslightly Hawaiite PM Th/Hf (ppm) Ta/Hf = 0.1 ---t r a n s i t i o n--- Ta/Hf = 0.29 Ta/Th = 0.131 (PM) IV-3: Continental extensional zone/ initial rift basalts (or Alkaline arcs) II-2: Continental arc & Continental margin island-arc (ACM)II-1: Island arc (Oceanic arc, IAB)I: N-MORB V:M antleplum ebasalts IV-2:Intracontinentalriftalkalibasalts IV-1: Intracontinental rift tholeiiticIII: Oceanic IntraIII: Oceanic Intra-plate Island (OIB, E-MORB, T-MORB) (M elt-related enrichm ent) (Fluid-related enrichment) Subduction enrichment Symbols: Adang Volcanics: Mafic Trachyte Fine grained Trachyte Leucitic Trachyte Vulsini Volcanics (Roman, Italy) Trachytic rocks (company drill data) Madupitic Lamproite (Badgers Teeth, Leucite Hills) Nyiragongo 2002 lava & Older lavas, Virunga Volcanics (East African Rift) W ithin-plate enrichm ent Ta/Th = 1/1.6 Ta/Th = 1/4 Ta/Th(ppm) 0.01 0.05 0.1 0.5 1 5 10 2 1 0.5 0.1 0.05 0.02 0.001 0.005 0.01 0.05 0.1 0.5 1.0 1.0 0.5 0.1 0.05 0.01 W ithin-plate enrichm ent (M elt-related enrichm ent) (Fluid-related enrichment) Subduction enrichment N b/Th = 1/0.67 Hawaiite slightly Nb/Zr(ppm) --- t r a n s i t i o n --- Nb/Zr = 0.15 Nb/Zr = 0.0627 (PM) Nb/Zr = 0.04 PM (ACM) II-1: Island arc (Oceanic arc, IAB) I: N-MORB II-2: Continental arc & Continental margin island-arc V: Mantle plume basalts III: Oceanic Intra-plate Island (OIB, E-MORB, T-MORB) IV-2:Intracontinentalriftalkalibasalts IV-3: Continental extensional zone/initial rift basalts (or Alkaline arcs) depletedmantlesource Th/Zr (ppm) Symbols : Adang Volcanics: Mafic Trachyte Fine-grained Trachyte Leucitic Trachyte Vulsini Volcanics (Roman, Italy) Trachytic rocks (company drill data) Madupitic Lamproite (Badgers Teeth, Leucite Hills) Nyiragongo 2002 lava & Older lavas, Virunga Volcanics (East African Rift) enrichedmantlesource N b/Th = 1/0.27 N b/Th = 1/0.11 IV-1:Intracontinentalrifttholeiitic
- 14. Indonesian Journal on Geoscience, Vol. 3 No. 3 December 2016: 195-214 208 Figure 19. Plot in metasomatism of Mafic Rocks Diagram (after La Flèche et al., 1998; modified in this paper) shows Adang Volcanics (‘Adang Volcanic Complex’) were formed by the silicate melt mantle metasomatism + a hydrated mantle source metasomatism process and Vulsini Volcanics was formed by a hydrated mantle source metasomatized, whereas Madupitic lamproite (Leucite Hills) formed from a hydrated mantle source metasomatism + carbonatite metasomatism (very low HREE signature, Figure 19) and Virunga Volcanics (East African Rift) were formed from moderate to strongly of the hydrated mantle metasomatism process. Figure 18. Metasomatism of Mafic Rocks Diagram (La Flèche et al., 1998). The plotting result showed Adang volcanics (‘Adang Volcanic Complex’) were formed by the silicate melt mantle metasomatism + a hydrated mantle source meta- somatism process and Vulsini Volcanics was formed by a hydrated mantle source metasomatized, whereas Madupitic lamproite (Leucite Hills) showed forming from a hydrated mantle source + carbonatite metasomatized. (Hf/Sm)PM Primitive Mantle Ta La Hf Sm ppm 0.0370 0.6480 0.2830 0.4060 * Sun and McDonough (1995) PM OIB Lower crust MORB DM (Depleted Mantle) Hawaiite Carbonatite metasomatism Fluid -related subduction metasomatism (from a hydrated mantle source) Melt-related subduction metasomatism (from mantle source metasomatized by silicated fluids) Symbols: Adang Volcanics: Mafic Trachyte Fine-grained Trachyte Leucitic Trachyte Vulsini Volcanics (Roman, Italy) Trachytic rocks (company drill data). Madupitic Lamproite (Badgers Teeth, Leucite Hills) Nyiragongo 2002 lava & Older lavas, Virunga Volcanics (East African Rift) (Ta/La)PM 5.0 1.0 0.5 0.1 0.07 0.01 0.05 0.1 0.5 1.0 5.0 (Hf/Sm)or1.4346x(Hf/Sm)PM DM (depleted mantle) weakly metasomatism moderately metasomatism strongly metasomatism enriched (0-10x) enriched (10-60x) enriched ( > 60x) Low moderate high moderate Hf/Sm) = 1.23PM *Sun and McDonough (1989) 5.0 1.0 0.5 0.1 1 5 10 50 100 500 1000 5000 Melt-related subduction metasomatism (from mantle source metasomatized by silicated fluids) Fluid-related subduction metasomatism (from a hydrated mantle source) Carbonatite metasomatism depleted mantle Komatiite Lower crust IAB MORB OIB Hawaiite PM TREY = (REE+Y) Chondrite For the six samples: Strongly metasomatized of silicate melts from mantle source. High Zr signature (Zr/TRE (avg) = 1.39) REE rich Ratio (Hf/Sm) > 1.23PM Strongly metasomatized from a hydrated mantle source Low Zr signature (Zr/TRE (avg) = 0.85) REE rich Strongly metasomatized from a hydrated mantle source + Carbonatite metasomatized Lower Zr signature (Zr/TRE (avg) = 0.28) REE rich à à à à à à à à à Ratio (Hf/Sm) < 1.00PM Ratio (Hf/Sm) < 1.00PM Primitive Mantle (PM) ppm Hf Sm 0.2830 0.4060
- 15. Geochemical Signatures of Potassic to Sodic Adang Volcanics, Western Sulawesi: Implications for Their Tectonic Setting and Origin (Godang, S. et al.) 209 Figure 20. Partial melting curves of mantle source (after Aldanmaz et al., 2000; modified in this paper). magmatic affin- ity: ratio LaYb (MacLean and Barrett, 1999), Depleted--slightly--enriched Mantle (after Le Roex et al., 1983 and after Sun et al., 2006), showing the genesis of the Adang Volcanics is related enrichment of DMM (garnet-lherzolite), whereas Virunga Volcanics are related enrichment of WAM (spinel-lherzolite). Tholeiitic Transitional Calc-alkaline to alkaline (peralkaline) La/Yb < 3 La/Yb = 3 - 6 La/Yb > 6 Nb/Zr = 0.04 Chondrite PM spinel-lherzolite garnet-lherzolite garnet-lherzolite garnet-lherzolite spinel-lherzolite spinel-lherzolite E-MORB N-MORB DMM WAM OIB Hawaiite Lower crust IAB depleted mantle M ORB field Nb/Zr(inppm) Nb/Zr = 0.0627 (PM) La/Yb (in ppm) depletedmantlesource1 0.5 0.1 0.05 0.01 0.1 0.5 1 5 10 50 100 150 enrichedmantlesourcesslightly Remarks: *DMM = Depleted MORB Mantle. *PM = Primitive Mantle. *WAM = Western Anatolian Mantle, defined in Aldanmaz et al., 2000. 0.1% 0.1% 0.1% 0.1% 0.1% 0.1% Symbols: Adang Volcanics: Mafic Trachyte Fine-grained Trachyte Leucitic Trachyte Trachytic rocks (company drill data). Nyiragongo 2002 lava & Older lavas, Virunga Volcanics (East African Rift) Table 3. Major Oxides (%) and Trace Elements (ppm) of Vulsini Volcanics - Roman, Italy (Santi et al., 2003) Code# #1 #2 #3 #4 #5 Code# #1 #2 #3 #4 #5 Rock_type Leucite phonolite Leucite phonolite Leucite phonolite Leucite phonolite Leucite phonolite Rock_type Leucite phonolite Leucite phonolite Leucite phonolite Leucite phonolite Leucite phonolite Sample_No# OSM 1 OSM 2 OSM 3 OSM 4 OSM 7 Sample_No# OSM 1 OSM 2 OSM 3 OSM 4 OSM 7 SiO2 55.51 55.03 55.44 56.21 56.31 La 173.00 182.00 189.00 176.00 169.00 TiO2 0.53 0.51 0.51 0.49 0.52 Ce 345.00 312.00 317.00 304.00 336.00 Al2 O3 20.04 19.97 20.01 20.37 20.28 Pr 37.30 34.00 34.60 32.20 36.30 Fe2 O3 4.19 4.08 4.13 3.92 4.18 Nd 124.00 112.00 114.00 106.00 116.00 FeO Sm 18.40 16.70 16.90 15.70 17.50 MnO 0.14 0.15 0.15 0.15 0.16 Eu 3.67 3.33 3.52 3.26 3.54 MgO 0.77 0.82 0.82 0.82 0.81 Gd 12.30 11.20 11.70 10.80 11.90 CaO 3.81 3.66 3.84 3.66 3.84 Tb 1.56 1.43 1.45 1.37 1.50 Na2 O 3.42 2.83 3.89 2.69 3.07 Dy 8.01 7.28 7.35 6.89 7.62 K2 O 8.46 9.18 9.01 9.78 9.11 Ho 1.47 1.34 1.35 1.26 1.38 LOI 2.34 3.05 1.32 1.93 1.75 Er 4.22 3.74 3.77 3.55 3.93 P2 O5 0.13 0.13 0.11 0.13 0.13 Tm 0.62 0.55 0.57 0.51 0.57 Total 99.34 99.41 99.23 100.15 100.16 Yb 4.00 3.66 3.60 3.32 3.74 TA=Na2 O+K2 O 11.88 12.01 12.90 12.47 12.18 Lu 0.60 0.53 0.54 0.50 0.55 K2 O/Na2 O 2.47 3.24 2.32 3.64 2.97 Y 47.50 42.40 43.80 40.10 45.10 Radiometric ? cps ? cps ? cps ? cps ? cps TRE 781.65 732.16 749.15 705.46 754.63 V 131.00 130.00 129.00 121.00 129.00 TREO 873.08 817.72 836.73 787.87 842.88 Cr < 20 < 20 < 20 < 20 < 20 TRExOy 939.94 879.63 899.96 847.68 907.59 Co 6.00 6.00 6.00 6.00 6.00 TRE2 O3 918.79 860.49 880.52 829.07 886.99 Ni < 20 < 20 < 20 < 20 < 20 dEu 0.75 0.74 0.77 0.77 0.75 Rb 298.00 395.00 292.00 350.00 294.00 Hf 12.30 10.90 11.20 10.40 11.70 Sr 2,130.00 1,900.00 2,140.00 2,020.00 2,150.00 Ta 2.79 2.44 2.53 2.35 2.62 Zr 677.00 610.00 626.00 584.00 657.00 Pb 183.00 157.00 200.00 217.00 192.00 Nb 49.50 46.60 47.90 45.80 51.40 Th 194.00 170.00 173.00 161.00 180.00 Ba 2,430.00 2,330.00 2,670.00 2,540.00 2,520.00 U 38.40 36.60 34.60 35.30 39.40
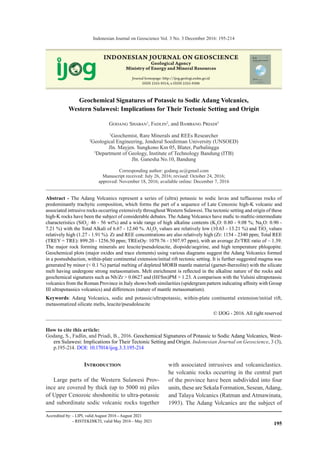
- 16. Indonesian Journal on Geoscience, Vol. 3 No. 3 December 2016: 195-214 210 are derived was enriched (Nb/Zr > 0.0627) and the magma was generated by small-scale partial melting (< 0.1 %) of Depleted MORB Mantle (DMM) composed of ultramafic (garnet- lherzolite). Discussion The results show that the Adang Volcanics are represented by potassic and sodic magma series, and consist predominantly of trachybasalt and basaltic trachyandesite. Furthermore, they indicate that they were formed in a within-plate continental extension/initial rifting tectonic set- ting after subduction had ceased. The samples include ultrapotassic rocks. Foley et al., 1987 (in Gupta, 2015) have subdivided the within-plate ultrapotassic rocks into four groups, as follows: 1. Group I: Lamproites. These rocks are not readily linked to subduction, although they may occur above a fossil subduction zone. Classic examples are Leucite Hills (Wyoming, USA), West Kimberley, and Gaussberg. 2. Group II: Ultrapotassic rocks of continental rift zones. Included in this group are leucitites, olivine melilities, perovskite, kalsilite, and some micaceous kimberlites. Type localities are in the East African Rift (e.g. Virunga Volcanics, Nyiragongo; Cupaello and San Vananzo, Italy). 3. Group III: Ultrapotassic rocks of active oro- genic zones. These rocks are a typical feature of many Cenozoic volcanic provinces in the Mediterranean region, including the Roman Province of Central Italy. Group III rocks show a strong association with active or re- cently active subduction systems. 4. Group IV: which cannot be included in either of the three groups. The type examples of group IV rocks are the potassic rocks of Na- vajo volcanic field, which lack mantle-derived xenoliths. The Adang Volcanics clearly belong to Group III based on their spidergram pattern, which is similar to that of the Vulsini volcanic rocks (Figure 21a and b) and other Group III volcanics, which are characterized by distinctly negative spikes in Ba, Nb-Ta, Ti, and P, whereas Rb, Th, and K are strongly enriched (Wilson, 1989). Lamproites of Group I and Group II rocks show a very different pattern (Figure 21b; Wilson, 1989). These differences may be caused by different genesis or metasomatism processes. Lamproites of Group I (e.g. Leucite Hills rocks) were formed from mixing between melts from metasomatized hydrated mantle and carbonatite sources (the rocks have a lower Zr/TRE and very low HREE signatures) (Figures 19 and 21b) and Group II rocks {e.g. Virunga Volcanics (Nyiragongo, East African Rift)} have a genesis from related enrichment of the Western Anatolian Mantle (WAM) from mantle material spinel-lherzolite (Figure 20). While the patterns shown by the Adang and Vulsini volcanics are very similar, it should be noted that the Adang rocks are more strongly enriched in Zr and Hf (~110–222x) than the Vulsini volcanic rocks (Zr 56x and Hf 38x). This difference can be explained by authors’ interpretation that the high Zr-Hf signature displayed by the Adang Volcanics is the result of enrichment of the silicate melt from a source within the mantle itself, whereas the relatively low Zr-Hf signature of the Vulsini volcanic rocks is linked to metasomatism by a hydrated mantle source (see above; Figure 19). Over the years a number of models have been proposed for the tectonic setting and origin of the Late Cenozoic potassic to ultrapotassic volcanics and associated intrusives in Western Sulawesi. Most favour a post-subduction, within plate extensional setting (cf. Maulana et al., 2016), consistent with authors’ findings, which some authors based on similarities with the high-K volcanics in the Roman Province (Leterrier et al., 1990). It is generally assumed that the magmas were derived from mantle previously metaso- matized by one ore more subduction events. As mentioned above, the result suggests, however, the magma that generated (at least part of) the Late Cenozoic volcanics in Western Sulawesi was metasomatized in a different way.
- 17. Geochemical Signatures of Potassic to Sodic Adang Volcanics, Western Sulawesi: Implications for Their Tectonic Setting and Origin (Godang, S. et al.) 211 Figure 21. (a) Incompatible to compatible multitrace elements diagram Normalized to Primitive Mantle (the inco patibility sequence: after Zhang, 2014; depleted–weakly–moderately–strongly metasomatism: after La Flèche et al., 1998 (Figure 19); modified in this paper) showing plots of the Adang Volcanics, Vulsini Volcanics (leucite phonalite), and Madupitic lamproite (Leucite-Hills); (b) Plots of the Adang Volcanics, Group I (Madupitic lamproite, Leucite-Hills), Group II (Virunga Volcanics: Nyiragongo, East African Rift system) and Group III (Vulsini Volcanics: leucite phonalite, Roman-Italy). moderatelystronglymetasomatismweaklydepleted mantle Normalizedconcentration (Rock/Primitivemantle) Primitive Mantle (PM) 20000 10000 5000 1000 500 100 50 10 5 1 0.5 0.1 depleted mantle LILE LILE LILE HFSE HFSE HFSE HFSE HFSEHFSE incompatible to compatible à increasing compatibility ß compatible to incompatible decreasing compatibility Rb Th Ba U Nb Ta P Sr Ti Hf ZrLa* Ce* Pr* Nd* Sm* Eu* Gd* Tb* Dy* Ho* Er* Tm* Yb* Lu* Y* TREY Adang Volcanics (Trachyte affinity) : Tectonic setting : within-plate continental extension/initial rift. à Strongly metasomatized of silicate melts. Geochemical Signature : High Zr -Hf (enriched ~ 110 - 222x)Hf (enriched ~ 110 - 222x) Vulsini Volcanic, Italy (leucite phonolite): Tectonic setting : Arc-related (Supra-subduction Volcanic Arc). Geochemical Signature: low Zr-Hf (enriched: Zr 56x and Hf 38x) Symbols: Adang Volcanics: Mafic Trachyte Fine-grained Trachyte Leucitic Trachyte Vulsini Volcanics (leucite phonolite lava; Roman, Italy) Madupitic Lamproite (Badgers Teeth, Leucite Hills) à ß Primitive Mantle (PM) LILE LILE LILE HFSE HFSE HFSE HFSE HFSEHFSE Rb Th Ba U Nb Ta P Sr Ti Hf ZrLa* Ce* Pr* Nd* Sm* Eu* Gd* Tb* Dy* Ho* Er* Tm* Yb* Lu* Y* TREY Normalizedconcentration (Rock/Primitivemantle) depleted mantle moderatelystronglymetasomatismweaklydepleted mantle incompatible to compatible increasing compatibility compatible to incompatible decreasing compatibility 20000 10000 5000 1000 500 100 50 10 5 1 0.5 0.1 Symbols: Adang Volcanics (6 samples) Virunga Volcanics (East African Rift : Group II) Madupitic Lamproite (Badgers Teeth, Leucite Hills : Group I) Vulsini Volcanics (leucite phonolite, Roman-Italy : Group III) Conclusion and Suggestion The main conclusion of this study, involv- ing petrographic and geochemical analyses, the results of which have been plotted on a series of diagrams, is that the Adang Volcanics consist of (ultra) potassic to sodic rocks of predominantly trachytic composition, that were formed by minor partial melting (<0.1 % by volume) which has been enriched DMM (Depleted MORB Mantle)
- 18. Indonesian Journal on Geoscience, Vol. 3 No. 3 December 2016: 195-214 212 of garnet-lherzolite composition. Metasomatic processes accompanying silicate melting caused the strong enrichment in Na, K, Zr, and REEs (with a geochemistry signature of (Hf/Sm)PM > 1.23). The magmatism that gave rise to the Adang volcanic complex took place during a within-plate rifting event. The presence of both potassic and sodic volcanic rocks possibly indi- cates magma was generated from more than one mantle reservoir. It would be of great interest to carry out a comparative study on the ultrapotassic leucite/ pseudoleucite-bearing volcanics from Gunung Muria and Bawean Island (Central Java) with the aim to establish whether or not those rocks were formed by similar processes as the Adang Volcanics and in a similar tectonic setting. It is further recommend to carry out U/P zircon dat- ing on a suite of representative samples from the Adang Volcanics in order to better constrain the age of this unit, including the temporal relation- ship between the potassic and sodic series. Acknowledgements The authors express their gratitude to Dr. Nur- chayo Indro Basuki (ITB) for petrographic ad- vise and useful discussions pertaining to leucite/ pseudoleucite, Dr.Ade Kadarusman for valuable input regarding the partial melting of mantle, Dr. rer. nat. Arifudin Idrus (UGM) for his help and support in writing this manuscript, and Theo Van Leeuwen for his constructive review. References Aldanmaz, E., Pearce, J.A., Thirlwall, M.F., and Mitchell, J.G., 2000. Petrogenetic evolution of late Cenozoic, post-collision volcanism in western Anatolia, Turkey. Journal of Volcanology and Geothermal Research 102 p.67-95. Elsevier. DOI: 10.1016/S0377- 0273(00)00182-7 Aldanmaz, E., Koprubasi, N., Gurer, O.F., Kay- makci, N., and Gourgaud, A., 2006. Geo- chemical constraints on the Cenozoic, OIB- type alkaline volcanic rocks of NW Turkey : Implications for mantle sources and melting processes. Lithos 86 p.50-76, Elsevier. DOI: 10.1016/j.lithos.2005.04.003 Anthony R., Philpotts, and Ague, J.J., 1989. (2nd edition): Principles of Petrography of Igneous and Metamorphic Rocks. Cambridge University Press (Fig. 15.10 : Depth to Benioff zone, Hatherton and Dickinson, 1969. DOI: 10.1017/CBO9780511813429 Babechuk, M.G., Widdowsonc, M., and Kamber, B.S., 2014. Quantifying chemical weathering intensity and trace element release from two contrasting basalt profiles, Deccan Traps, India. Chemical Geology, 363, p.56-75. (modified of Weathering Ternary Diagram of Mafic/Basaltic from Nesbitt & Wilson (1992), MIA(o)). DOI: 10.1016/j.chem- geo.2013.10.027 Bergman, S.C., Coffield, D.Q., Talbot, J.P., and Garrard, R.A., 1996. Tertiary Tectonic and Magmatic Evolution of Western Sulawesi and the Makassar Strait, Indonesia - Evi- dence for a Miocene Continent-Continent Collision. In: (eds Hall, R. and Blundell, D. J.(Eds.), Tectonic evolution of Southeast Asia. Geological Society of London, Special Publication, 106, p.391-429. DOI: 10.1144/ GSL.SP.1996.106.01.25 Deer W.A. and Andrew R., 2001. (2nd edi- tion). Rock-Forming Minerals: Framework Silicates (Feldspars), Volume 4A. Published by The Geological Society. p.46 (Ternary solid solution An-Ab-Or). DOI: 10.1017/ CBO9780511813429 Foley, S.F., Venturelli, G., Green, D.H., and Toscani, L., 1987. The ultrapotassic rocks : Characteristics, classification and constraints for petrogenetic models. Earth Science Reviews, 24, p.81-134. DOI: 10.1016/0012- 8252(87)90001-8 Godang, S., 2015a. Introduction of Godangs Trapezoid Geochemistry for Determining Magmatic Classification, Review & Dis- cussion with Unsoed’s Geo-academician & Geo-colleger.
- 19. Geochemical Signatures of Potassic to Sodic Adang Volcanics, Western Sulawesi: Implications for Their Tectonic Setting and Origin (Godang, S. et al.) 213 Godang, S., 2015b. Introduction of Godangs Trapezoid Geochemistry for Determining Magmatic Classification, Guest Lecture STT- NAS and AKPRIND (Jogya). Godang, S., 2016. Godangs Trapezoid Geochem- istry Diagram. In preparation. Gupta A.K., 2015. Origin of Potassium-rich Silica-deficient Igneous Rocks. Springer India. p.11(pseudoleucite), p.72-74. DOI: 10.1007/978-81-322-2083-1_2 Hatherton, T. and Dickinson, W.R., 1969. The relationship between andesitic volcanism and seismicity in Indonesia, the Lesser Antilles, and other island arcs. Journal Geophysical Research (74), p.5301-5310. DOI: 10.1029/ JB074i022p05301 Hollocher, K., Robinson, P., Walsh, E., and Rob- erts, D., 2012. Geochemistry of amphibolite- facies volcanics and gabbros of the Støren Nappe in extensions west and southwest of Trondheim, Western Gneiss Region, Nor- way: a key to correlations and paleotectonic settings. American Journal of Science, 312, p.357-416. DOI: 10.2475/04.2012.01 https://en.wikipedia.org/wiki/Abundance_of_ele- ments_in_Earth’s_crust (ratio Th/U ~ 3) https://minerva.union.edu/hollochk/c_petrology/ discrim/discrim.htm La Flèche, R., Camiré, G., and Jenner, G.A., 1998. Geochemistry of post-Acadian, Carbonifer- ous continental intraplate basalts from the Maritimes Basin, Magdalen Islands, Québec, Canada. Chemical Geology, 148, p.115-136. DOI: 10.1016/S0009-2541(98)00002-3 Le Bas, M.J, Le Maitre, R.W., StreckeisenA, and Zanettin, B., 1986. A Chemical classification of Volcanic Rocks based on the Total Alkali- silica Diagram. Journal of Petrology, 27, p.745-750. DOI: 10.1093/petrology/27.3.745 Le Roex, A.P., Dick, H.J.B., Erlank, A.X, Reid, A.M., Frey, F.A., and Hart, S. R., 1983. Geo- chemistry, Mineralogy and Petrogenesis of Lavas Erupted along the Southwest Indian Ridge Between the BouvetTriple Junction and 11 Degrees East. Journal of Petrology, 24 (3), p.267-318. DOI: 10.1093/petrology/24.3.267 Leterrier, J., Yuwono, Y.S., Soeria-Atmadja, R., and Muary, R.C., 1990. Potassic Volca- nism in Central Jawa and South Sulawesi, Indonesia. Journal Southeast Asian Earth Sciences, 4, p.171-187. DOI: 10.1016/S0743- 9547(05)80011-X MacLean, W.H., and Barrett, T.J., 1993. Litho- geochemical technique using immobile elements. Journal of Geochemical Explora- tion 48(2), p.109-133. DOI: 10.1016/0375- 6742(93)90002-4 Maulana, A., Imai, A., Van Leeuwen, T., Wata- nabe, K., Yonezu, K., Nakano, T., Boyce, A., Page, L., and Schertsen, A., 2016. Origin and geodynamic setting of Late Cenozoic Gran- itoids in Sulawesi. Journal of Asian Earth Sciences, 124, p.102-125. DOI: 10.1016/j. jseaes.2016.04.018 Muller D. and Groves D.I., 1997 . Potassic Ig- neous Rocks and Associated Gold-copper Mineralization. In: Bhattacharji, S., Fried- man, G.M., Neugebauer, H.J., and Seilacher, A.(Eds.), Lecture Notes in Earth Sciences, 56, p.143-166. DOI: 10.1007/978-3-662- 00920-8_3 Muller, D. and Groves, D.I., 1993. Direct and indirect associations between potassic igneous rocks, shoshonites and gold–copper deposits. Ore Geology Reviews, 8, p.383-406. DOI: 10.1016/0169-1368(93)90035-W Muller, D., and Groves D.I., 2000. Potassic igneous rocks and associated gold-copper mineralization, 3rd edn. Springer, Ber- lin Heidelberg New York. DOI: 10.1017/ S001675680135495X Nesbitt, H., and Wilson, R., 1992. Recent chemi- cal weathering of basalts, American Journal of Science, 292, p.740-777. DOI: 10.2475/ ajs.292.10.740 Peccerillo,A. and Taylor, S.R., 1976. Geochemis- try of the Eocene calc-alkaline volcanic rocks from the Kastamonu area, northern Turkey. Contributions to Mineralogy and Petrology. 58, p.63-81. DOI: 10.1007/BF00384745 Pearce, J.A. 1996. A user’s guide to basalt dis- crimination diagrams. In Trace element geo-
- 20. Indonesian Journal on Geoscience, Vol. 3 No. 3 December 2016: 195-214 214 chemistry of volcanic rocks, applications for massive sulphide exploration, Short Course Notes. (Bailes, A.H., Christiansen, E.H., Galley, A.G., Jenner, G.A., Keith, Jeffrey D., Kerrich, R., Lentz, D.R., Lesher, C.M., Lucas, S.B., Ludden, J.N., Pearce, J.A., Peloquin, S.A., Stern, R.A., Stone, W.E., Syme, E.C., Swinden, H.S., Wyman, D.A., (ed). Geologi- cal Association of Canada 12, p.79-113. Puspita, S.D., Hall, R., and Elders, C.F., 2005. Structural Styles of the OffshoreWest Sulawe- si Fold Belt, North Makasar Strait, Indonesia. Proceedings of Indonesia Petroleum Associa- tion, 30th Annual Convention, p.519-542. Ratman, N. andAtmawinata, S., 1993. Geological map of the Mamuju Quadrangle, Sulawesi, scale 1:250.000. Geological Research and Development Centre, Bandung. Santi, P., Antonelli, F., Renzulli, A., and Pensa- bene, P., 2003. Leucite phonolite millstones from the Orvieto production centre: new data and insights into the Roman trade. Periodico di Mineralogia, 73, p.57-69. Shand, S.J., 1927. Eruptive Rocks. Thomas Murby, London. 360pp. (Gabbroid, Meta- luminous, Peraluminous). DOI: 10.1017/ S0016756800103504 Sukadana, I.G., Harijoko,A., and Setijadji, L.D., 2015. Tectonic Setting of Adang Volcanic Complex in Mamuju Region, West Sulawesi Province. Eksplorium, 36 (1), p.31-44. Sun, S.Q., Zhang, C.J., and Huang, R.Q., 2006. The Tectonic Settings Discrimination of the Basalts in the Convergent Margin of Plate by Th, Nb and Zr. Advances in Earth Sci- ence, 21 (6), p.593-598 (in China Mandarin language). (modified in this paper by Godang et al., 2016). Turner, S., Arnaud, N., Liu, J., Rogers, N., Hawkesworth, C., Harris, N., Kelley, S., Van Calsteren, P., and Deng, W., 1996. Postcolli- sion, shoshonitic volcanism on the Tibetan, plateau: implications for convective thinning of the lithosphere and source of ocean island basalts. Journal of Petrology, 37, p.45-71. DOI: 10.1093/petrology/37.1.45 Van Leeuwen, T. and Pieters, P.E., 2011. Min- eral Deposits of Sulawesi. Proceedings of the Sulawesi Mineral Resources. Seminar MGEI-IAGI Waele, B.D. and Muharam, 2014. Geological Interpretation of the Mamuju Rare Earth Mineral Prospect, West Sulawesi, Indonesia. PT. SRK Consulting Indonesia (Unpublished report) Wang,Y.N., Zhang, C.J., and Xiu, S.Z., 2001. Th/ Hf-Ta/Hf identification of tectonic setting of basalts. Acta Petrol Sin (in Chinese), 17 (3), p.413-421. (modified in this paper by Godang et al., 2016) Wilson, M., 1989. Igneous Petrogenesis - A Glob- al Tectonic Approach, published by Harper CollinsAcademic, London, UK, 466pp. (Chap 12: Potassic magmatism within continental plates, p.375-411). DOI: 10.1007/978-1-4020- 6788-4_12 Yuwono, Y.S., Bellon, H., Soeria-Atmadja, R., and Maury, R.C., 1985. Neogene and Pleisto- cene Volcanism in South Sulawesi, Proceed- ing PIT XIV Ikatan Ahli Geologi Indonesia, Jakarta, p.169-179. Zhang,Y. X., 2014. Quantification of the elemen- tal incompatibility sequence, and composition of the “superchondritic” mantle. Chemical Geology 369, p.12-21. DOI: 10.1016/j.chem- geo.2014.01.012