2014 Construction Vital Statistics - December
•
0 likes•211 views

2014 Construction Vital Statistics - December
Recommended

Recommended
More Related Content
What's hot
What's hot (20)
Viewers also liked
Viewers also liked (10)
Similar to 2014 Construction Vital Statistics - December
Similar to 2014 Construction Vital Statistics - December (13)
More from CBIZ & MHM Phoenix
More from CBIZ & MHM Phoenix (20)
Recently uploaded
Recently uploaded (20)
2014 Construction Vital Statistics - December
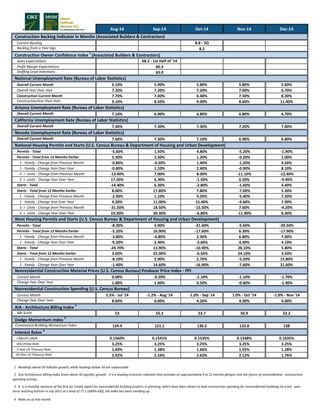
- 1. Aug-14 Sep-14 Oct-14 Nov-14 Dec-14 Current Backlog 8.8 - 3Q Backlog from a Year Ago 8.2 Sales Expectations 68.2 - 1st Half of '14 Profit Margin Expectations 60.3 Staffing Level Intentions 65.0 Overall Current Month 6.10% 5.90% 5.80% 5.80% 5.60% Overall Year Over Year 7.20% 7.20% 7.20% 7.00% 6.70% Construction Current Month 7.70% 7.00% 6.40% 7.50% 8.30% ConstructionYear Over Year 9.10% 8.50% 9.00% 8.60% 11.40% Overall Current Month 7.10% 6.90% 6.80% 6.80% 6.70% Overall Current Month 7.40% 7.30% 7.30% 7.20% 7.00% Overall Current Month 7.60% 7.30% 7.10% 6.90% 6.80% Permits - Total -5.60% 1.50% 4.80% -5.20% -1.90% Permits - Total from 12 Months Earlier 5.30% 2.50% 1.20% -0.20% 1.00% 1 - Family - Change from Previous Month -0.80% -0.50% 1.40% -1.20% 4.50% 1 - Family - Change Year Over Year -0.80% 1.10% 2.40% -0.90% 8.10% 5 + Units - Change from Previous Month -13.40% 7.00% 8.00% -11.10% -12.40% 5 + Units - Change Year Over Year 17.50% 6.30% -1.50% 0.50% -9.90% Starts - Total -14.40% 6.30% -2.80% -1.60% 4.40% Starts - Total from 12 Months Earlier 8.00% 17.80% 7.80% -7.00% 5.30% 1 - Family - Change from Previous Month -2.40% 1.10% 4.20% -5.40% 7.20% 1 - Family - Change Year Over Year 4.20% 11.00% 15.40% -4.60% 7.90% 5 + Units - Change from Previous Month -31.50% 18.50% -15.50% 7.60% -4.20% 5 + Units - Change Year Over Year 19.20% 30.30% -6.80% -11.90% 0.30% Permits - Total -8.30% 5.90% -21.60% -5.60% -20.50% Permits - Total from 12 Months Earlier -5.20% 16.90% -17.60% 6.30% -17.90% 1 - Family - Change from Previous Month -3.80% -0.80% 2.30% 6.80% 7.00% 1 - Family - Change Year Over Year -9.20% 2.40% -3.60% 4.40% 4.10% Starts - Total -24.70% 13.90% -10.90% 28.10% 5.80% Starts - Total from 12 Months Earlier 3.60% 25.00% -0.50% 24.10% 3.50% 1 - Family - Change from Previous Month -8.10% 2.90% 2.70% -5.20% 15.80% 1 - Family - Change Year Over Year -1.40% 14.60% -16.90% -7.60% 21.60% Current Month 0.00% -0.20% -1.10% -1.10% -1.70% Change Year Over Year 1.00% 1.00% 0.50% -0.60% -1.90% Current Month 2.5% - Jul '14 -1.2% - Aug '14 -1.0% - Sep '14 1.0% - Oct '14 -1.0% - Nov '14 Change Year Over Year 8.60% 6.00% 4.20% 4.30% 4.00% ABI Score 53 55.2 53.7 50.9 52.2 Commerical Building Momentum Index 124.4 121.1 130.2 133.8 138 I-Month LIBOR 0.1560% 0.1541% 0.1535% 0.1548% 0.1635% WSJ Prime Rate 3.25% 3.25% 3.25% 3.25% 3.25% 5 Year US Treasury Rate 1.69% 1.38% 1.66% 1.55% 1.28% 10 Year US Treasury Rate 2.42% 2.16% 2.63% 2.12% 1.76% 4 Rates as of mid month. AIA - Architecture Billing Index 2 Construction Backlog Indicator in Months (Associated Builders & Contractors) Construction Owner Confidence Index 1 (Associated Builders & Contractors) National Unemployment Rate (Bureau of Labor Statistics) Arizona Unemployment Rate (Bureau of Labor Statistics) California Unemployment Rate (Bureau of Labor Statistics) Nevada Unemployment Rate (Bureau of Labor Statistics) National Housing Permits and Starts (U.S. Census Bureau & Department of Housing and Urban Development) West Housing Permits and Starts (U.S. Census Bureau & Department of Housing and Urban Development) Nonresidential Construction Material Prices (U.S. Census Bureau) Producer Price Index - PPI Nonresidential Construction Spending (U.S. Census Bureau) Dodge Momentum Index 3 Interest Rates 4 1 Readings above 50 indicate growth, while readings below 50 are unfavorable 2 Any Architecture Billing Index Score above 50 signifies growth - it is a leading economic indicator that provides an approximately 9 to 12 months glimpse into the future of nonresidential construction spending activity. 3 It is a monthly measure of the first (or initial) report for nonresidential building projects in planning, which have been shown to lead construction spending for nonresidential buildings by a full year. Since reaching bottom in July 2011 at a level of 77.1 (2000=100), the index has been trending up.