SlideShare a Scribd company logo
1 of 7
KATHERINE LORENA SILVA ALONSOCODIGO: 2073612METODOS NUMERICOS-895985-633730<br />CALCULATION OF THE ROOT<br />Calculate the root of following:  <br />For the methods: <br />a) Bisección<br />b) Falsa Posición<br />c) Secante<br />d) Newton-Raphson<br />e) Punto Fijo<br />We first make the graph of the function to get an inkling of what the value of the root and so allocate an appropriate interval to assess <br />Xf(X)010,10,718730750,20,470320050,30,248811640,40,049328960,5-0,132120560,6-0,298805790,7-0,453403040,8-0,598103480,9-0,73470111<br />Now with the help of Microsoft excel can do the calculation of the root for each method.<br />Down are the tables that are the result of this process and the respective root found, which is in a blue box. <br />BISECTION METHODN° ITERATIONXiXs Xr=Xi+Xs/2F(Xi)F(Xr)F(Xi)*F(Xr)Ea00211-0,86466472-0,86466472 1010,51-0,13212056-0,13212056100200,50,2510,356530660,3565306610030,250,50,3750,356530660,097366550,0347141633,333333340,3750,50,43750,09736655-0,02063798-0,0020094514,285714350,3750,43750,406250,097366550,037497310,003650987,6923076960,406250,43750,4218750,037497310,008219640,000308213,703703770,4218750,43750,42968750,00821964-0,00626086-5,1462E-051,8181818280,4218750,42968750,425781250,008219640,000966377,9432E-060,9174311990,425781250,42968750,4277343750,00096637-0,00265049-2,5613E-060,456621100,425781250,427734380,4267578130,00096637-0,00084287-8,1453E-070,22883295110,425781250,426757810,4262695310,000966376,1544E-055,9474E-080,11454754<br />FALSE POSITION METHODN° ITERACIONXiXs Xr=Xs-F(Xs)(Xi-Xs)/F(Xi)-F(Xs)F(Xi)F(Xs)F(Xr)F(Xi)*F(Xr)Ea0020,670761811-1,98168436-0,40931479-0,40931479 100,670761810,475948891-0,40931479-0,08994112-0,0899411240,93147915200,475948890,4366739461-0,08994112-0,01912266-0,019122668,994111954300,436673950,4284802651-0,01912266-0,00403004-0,004030041,912265637400,428480270,4267604051-0,00403004-0,00084767-0,000847670,403003816500,42676040,4263989581-0,00084767-0,00017823-0,000178230,084767304600,426398960,4263229761-0,00017823-3,7469E-05-3,7469E-050,017822515<br />NEWTON METHOD xiF(x)F´(x)ERROR01-0,86466472-1,270670566 10,319520940,20827694-2,055595758212,96853720,420842870,01014051-1,86196676424,075953930,4262892,5474E-05-1,8526289491,2775670940,426302751,612E-10-1,8526055020,003225450,426302750-1,8526055022,0411E-08<br />SECANTE METHOD Xi-1xiF(xi)F(xi-1)xi+1ERROR002-1,98168436110,67076181198,168436120,67076181-0,409314792-1,981684360,32473829106,55457920,670761810,324738290,197580806-0,409314790,4373896425,755376130,324738290,43738964-0,0204355940,197580810,426830352,4738832340,437389640,42683035-0,0009772-0,020435590,426300070,12439283<br />FIXED POINT METHODG1(x)N° ITERACIONESXF(x)G(x)101121-0,864664720,13533528330,135335280,627532490,76286776940,76286777-0,545406720,21746104750,217461050,429854050,64731509560,64731509-0,373315920,27399917370,273999170,304106650,5781058280,57810582-0,263429790,31467603190,314676030,218260970,532936999100,532937-0,18851030,344426695110,34442670,157724820,502151511120,50215151-0,135851660,366299849130,366299850,114357950,480657799140,4806578-0,098268320,382389484150,382389480,083047310,465436796160,4654368-0,071227610,394209182170,394209180,0603540,454563181180,45456318-0,051687140,402876038190,402876040,043875770,446751809200,44675181-0,037532320,40921949210,409219490,031900220,441119714220,44111971-0,027264640,413855074230,413855070,023193840,437048918<br />Plot a curve to compare the percentage of relative error versus the number of iterations of each method.<br />First we make the tables<br />NEWTON METHOD% ERROR RELATIVON° ITERACIONES  212,9685366124,0759539321,27756708930,00322540542,04108E-085  <br />SECANTE METHOD% ERROR RELATIVON° ITERACIONES                                  198,16843610106,5545793125,7553760722,47388323130,1243928264<br />BISECCION METHOD% ERROR RELATIVON° ITERACIONES  1000100133,33333333214,2857142937,69230769243,70370370451,81818181860,91743119370,45662100580,22883295290,11454753710<br />Now make de graph<br />
Example of calculate of root

More Related Content

What's hot

What's hot (20)

Trident International Graphics Workshop2014 3/5
Trident International Graphics Workshop2014 3/5Trident International Graphics Workshop2014 3/5
Trident International Graphics Workshop2014 3/5
 
April 7, 2014
April 7, 2014April 7, 2014
April 7, 2014
 
Funções 5
Funções 5Funções 5
Funções 5
 
ITA 2020 - aberta
ITA 2020 - abertaITA 2020 - aberta
ITA 2020 - aberta
 
Proof
ProofProof
Proof
 
Ex1 d sketchlinfuncs
Ex1 d sketchlinfuncsEx1 d sketchlinfuncs
Ex1 d sketchlinfuncs
 
Apoyo guía-12-2°-medio-ppt.-parábola
Apoyo guía-12-2°-medio-ppt.-parábolaApoyo guía-12-2°-medio-ppt.-parábola
Apoyo guía-12-2°-medio-ppt.-parábola
 
SIGNATE 国立国会図書館の画像データレイアウト認識 1st place solution
SIGNATE 国立国会図書館の画像データレイアウト認識 1st place solutionSIGNATE 国立国会図書館の画像データレイアウト認識 1st place solution
SIGNATE 国立国会図書館の画像データレイアウト認識 1st place solution
 
Act2_GalindoChavezJaqueline_GrupoA
Act2_GalindoChavezJaqueline_GrupoAAct2_GalindoChavezJaqueline_GrupoA
Act2_GalindoChavezJaqueline_GrupoA
 
Unicamp 2018 - aberta
Unicamp 2018 - abertaUnicamp 2018 - aberta
Unicamp 2018 - aberta
 
Assignment 1 b
Assignment 1 b Assignment 1 b
Assignment 1 b
 
5.1 quadratic functions
5.1 quadratic functions5.1 quadratic functions
5.1 quadratic functions
 
Problema
ProblemaProblema
Problema
 
Math hssc-ii-a1
Math hssc-ii-a1Math hssc-ii-a1
Math hssc-ii-a1
 
Aman 2019
Aman 2019Aman 2019
Aman 2019
 
Efoom 2020
Efoom 2020Efoom 2020
Efoom 2020
 
Digital Differential Analyzer Line Drawing Algorithm
Digital Differential Analyzer Line Drawing AlgorithmDigital Differential Analyzer Line Drawing Algorithm
Digital Differential Analyzer Line Drawing Algorithm
 
Julia Set
Julia SetJulia Set
Julia Set
 
INVERSE FUNCTION
INVERSE FUNCTIONINVERSE FUNCTION
INVERSE FUNCTION
 
Activity 2
Activity 2Activity 2
Activity 2
 

Viewers also liked

Iterative methods
Iterative methodsIterative methods
Iterative methodsKt Silva
 
01 software test engineering (manual testing)
01 software test engineering (manual testing)01 software test engineering (manual testing)
01 software test engineering (manual testing)Siddireddy Balu
 
Software Testing Fundamentals
Software Testing FundamentalsSoftware Testing Fundamentals
Software Testing FundamentalsChankey Pathak
 
Software engineering lecture notes
Software engineering lecture notesSoftware engineering lecture notes
Software engineering lecture notesSiva Ayyakutti
 

Viewers also liked (6)

Iterative methods
Iterative methodsIterative methods
Iterative methods
 
bisection method
bisection methodbisection method
bisection method
 
01 software test engineering (manual testing)
01 software test engineering (manual testing)01 software test engineering (manual testing)
01 software test engineering (manual testing)
 
Software Testing Fundamentals
Software Testing FundamentalsSoftware Testing Fundamentals
Software Testing Fundamentals
 
Software engineering lecture notes
Software engineering lecture notesSoftware engineering lecture notes
Software engineering lecture notes
 
Software testing ppt
Software testing pptSoftware testing ppt
Software testing ppt
 

Similar to Example of calculate of root

Compression of “noisy” measurement data for plotting with TikZ and pgfplots
Compression of “noisy” measurement data for plotting with TikZ and pgfplotsCompression of “noisy” measurement data for plotting with TikZ and pgfplots
Compression of “noisy” measurement data for plotting with TikZ and pgfplotsMathias Magdowski
 
Données hospitalières relatives à l'épidémie de COVID-19 FRANCE
Données hospitalières relatives à l'épidémie de COVID-19 FRANCEDonnées hospitalières relatives à l'épidémie de COVID-19 FRANCE
Données hospitalières relatives à l'épidémie de COVID-19 FRANCENalron
 
Application of recursive perturbation approach for multimodal optimization
Application of recursive perturbation approach for multimodal optimizationApplication of recursive perturbation approach for multimodal optimization
Application of recursive perturbation approach for multimodal optimizationPranamesh Chakraborty
 
Fundamentals of Image Processing & Computer Vision with MATLAB
Fundamentals of Image Processing & Computer Vision with MATLABFundamentals of Image Processing & Computer Vision with MATLAB
Fundamentals of Image Processing & Computer Vision with MATLABAli Ghanbarzadeh
 
Material unidad ii metodos
Material unidad ii metodosMaterial unidad ii metodos
Material unidad ii metodosFaint Aitnyc
 
Particles Swarm Optimization
Particles Swarm OptimizationParticles Swarm Optimization
Particles Swarm OptimizationBrian Raafiu
 
Regression and Classification with R
Regression and Classification with RRegression and Classification with R
Regression and Classification with RYanchang Zhao
 
Newton divided difference interpolation
Newton divided difference interpolationNewton divided difference interpolation
Newton divided difference interpolationVISHAL DONGA
 
Monte carlo-simulation
Monte carlo-simulationMonte carlo-simulation
Monte carlo-simulationjaimarbustos
 
A Study on the Short Run Relationship b/w Major Economic Indicators of US Eco...
A Study on the Short Run Relationship b/w Major Economic Indicators of US Eco...A Study on the Short Run Relationship b/w Major Economic Indicators of US Eco...
A Study on the Short Run Relationship b/w Major Economic Indicators of US Eco...aurkoiitk
 
STRESS ANALYSIS OF AN ISOTROPIC MATERIAL
STRESS ANALYSIS OF AN ISOTROPIC MATERIALSTRESS ANALYSIS OF AN ISOTROPIC MATERIAL
STRESS ANALYSIS OF AN ISOTROPIC MATERIALRohit Katarya
 
Terminado matematica ii
Terminado matematica iiTerminado matematica ii
Terminado matematica iiyonygerardo
 
SAMPLE QUESTIONExercise 1 Consider the functionf (x,C).docx
SAMPLE QUESTIONExercise 1 Consider the functionf (x,C).docxSAMPLE QUESTIONExercise 1 Consider the functionf (x,C).docx
SAMPLE QUESTIONExercise 1 Consider the functionf (x,C).docxagnesdcarey33086
 
FREQUENCY DISTRIBUTION ( distribusi frekuensi) - STATISTICS
FREQUENCY DISTRIBUTION ( distribusi frekuensi) - STATISTICSFREQUENCY DISTRIBUTION ( distribusi frekuensi) - STATISTICS
FREQUENCY DISTRIBUTION ( distribusi frekuensi) - STATISTICSAirlangga University , Indonesia
 

Similar to Example of calculate of root (20)

Compression of “noisy” measurement data for plotting with TikZ and pgfplots
Compression of “noisy” measurement data for plotting with TikZ and pgfplotsCompression of “noisy” measurement data for plotting with TikZ and pgfplots
Compression of “noisy” measurement data for plotting with TikZ and pgfplots
 
Données hospitalières relatives à l'épidémie de COVID-19 FRANCE
Données hospitalières relatives à l'épidémie de COVID-19 FRANCEDonnées hospitalières relatives à l'épidémie de COVID-19 FRANCE
Données hospitalières relatives à l'épidémie de COVID-19 FRANCE
 
Analysis of data
Analysis of dataAnalysis of data
Analysis of data
 
Application of recursive perturbation approach for multimodal optimization
Application of recursive perturbation approach for multimodal optimizationApplication of recursive perturbation approach for multimodal optimization
Application of recursive perturbation approach for multimodal optimization
 
Fundamentals of Image Processing & Computer Vision with MATLAB
Fundamentals of Image Processing & Computer Vision with MATLABFundamentals of Image Processing & Computer Vision with MATLAB
Fundamentals of Image Processing & Computer Vision with MATLAB
 
DCT
DCTDCT
DCT
 
DCT
DCTDCT
DCT
 
DCT
DCTDCT
DCT
 
Material unidad ii metodos
Material unidad ii metodosMaterial unidad ii metodos
Material unidad ii metodos
 
Particles Swarm Optimization
Particles Swarm OptimizationParticles Swarm Optimization
Particles Swarm Optimization
 
8th semester Computer Science and Information Science Engg (2013 December) Qu...
8th semester Computer Science and Information Science Engg (2013 December) Qu...8th semester Computer Science and Information Science Engg (2013 December) Qu...
8th semester Computer Science and Information Science Engg (2013 December) Qu...
 
Slides networks-2017-2
Slides networks-2017-2Slides networks-2017-2
Slides networks-2017-2
 
Regression and Classification with R
Regression and Classification with RRegression and Classification with R
Regression and Classification with R
 
Newton divided difference interpolation
Newton divided difference interpolationNewton divided difference interpolation
Newton divided difference interpolation
 
Monte carlo-simulation
Monte carlo-simulationMonte carlo-simulation
Monte carlo-simulation
 
A Study on the Short Run Relationship b/w Major Economic Indicators of US Eco...
A Study on the Short Run Relationship b/w Major Economic Indicators of US Eco...A Study on the Short Run Relationship b/w Major Economic Indicators of US Eco...
A Study on the Short Run Relationship b/w Major Economic Indicators of US Eco...
 
STRESS ANALYSIS OF AN ISOTROPIC MATERIAL
STRESS ANALYSIS OF AN ISOTROPIC MATERIALSTRESS ANALYSIS OF AN ISOTROPIC MATERIAL
STRESS ANALYSIS OF AN ISOTROPIC MATERIAL
 
Terminado matematica ii
Terminado matematica iiTerminado matematica ii
Terminado matematica ii
 
SAMPLE QUESTIONExercise 1 Consider the functionf (x,C).docx
SAMPLE QUESTIONExercise 1 Consider the functionf (x,C).docxSAMPLE QUESTIONExercise 1 Consider the functionf (x,C).docx
SAMPLE QUESTIONExercise 1 Consider the functionf (x,C).docx
 
FREQUENCY DISTRIBUTION ( distribusi frekuensi) - STATISTICS
FREQUENCY DISTRIBUTION ( distribusi frekuensi) - STATISTICSFREQUENCY DISTRIBUTION ( distribusi frekuensi) - STATISTICS
FREQUENCY DISTRIBUTION ( distribusi frekuensi) - STATISTICS
 

More from Kt Silva

example presented
example presentedexample presented
example presentedKt Silva
 
example presented
example presentedexample presented
example presentedKt Silva
 
example presented
example presentedexample presented
example presentedKt Silva
 
Ecuacion diferencial
Ecuacion diferencialEcuacion diferencial
Ecuacion diferencialKt Silva
 
Ecuacion diferencial
Ecuacion diferencialEcuacion diferencial
Ecuacion diferencialKt Silva
 
example presented
example presentedexample presented
example presentedKt Silva
 
Perforacion de pozos, grupo d3 b, tarea numero 1
Perforacion de pozos, grupo d3 b, tarea numero 1Perforacion de pozos, grupo d3 b, tarea numero 1
Perforacion de pozos, grupo d3 b, tarea numero 1Kt Silva
 
ROOTS OF EQUATIONS
ROOTS OF EQUATIONSROOTS OF EQUATIONS
ROOTS OF EQUATIONSKt Silva
 
mathematical model
mathematical modelmathematical model
mathematical modelKt Silva
 

More from Kt Silva (11)

example presented
example presentedexample presented
example presented
 
example presented
example presentedexample presented
example presented
 
example presented
example presentedexample presented
example presented
 
Refuerzo
RefuerzoRefuerzo
Refuerzo
 
Refuerzo
RefuerzoRefuerzo
Refuerzo
 
Ecuacion diferencial
Ecuacion diferencialEcuacion diferencial
Ecuacion diferencial
 
Ecuacion diferencial
Ecuacion diferencialEcuacion diferencial
Ecuacion diferencial
 
example presented
example presentedexample presented
example presented
 
Perforacion de pozos, grupo d3 b, tarea numero 1
Perforacion de pozos, grupo d3 b, tarea numero 1Perforacion de pozos, grupo d3 b, tarea numero 1
Perforacion de pozos, grupo d3 b, tarea numero 1
 
ROOTS OF EQUATIONS
ROOTS OF EQUATIONSROOTS OF EQUATIONS
ROOTS OF EQUATIONS
 
mathematical model
mathematical modelmathematical model
mathematical model
 

Example of calculate of root

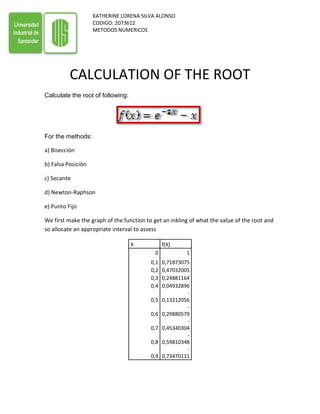
  • 1. KATHERINE LORENA SILVA ALONSOCODIGO: 2073612METODOS NUMERICOS-895985-633730<br />CALCULATION OF THE ROOT<br />Calculate the root of following: <br />For the methods: <br />a) Bisección<br />b) Falsa Posición<br />c) Secante<br />d) Newton-Raphson<br />e) Punto Fijo<br />We first make the graph of the function to get an inkling of what the value of the root and so allocate an appropriate interval to assess <br />Xf(X)010,10,718730750,20,470320050,30,248811640,40,049328960,5-0,132120560,6-0,298805790,7-0,453403040,8-0,598103480,9-0,73470111<br />Now with the help of Microsoft excel can do the calculation of the root for each method.<br />Down are the tables that are the result of this process and the respective root found, which is in a blue box. <br />BISECTION METHODN° ITERATIONXiXs Xr=Xi+Xs/2F(Xi)F(Xr)F(Xi)*F(Xr)Ea00211-0,86466472-0,86466472 1010,51-0,13212056-0,13212056100200,50,2510,356530660,3565306610030,250,50,3750,356530660,097366550,0347141633,333333340,3750,50,43750,09736655-0,02063798-0,0020094514,285714350,3750,43750,406250,097366550,037497310,003650987,6923076960,406250,43750,4218750,037497310,008219640,000308213,703703770,4218750,43750,42968750,00821964-0,00626086-5,1462E-051,8181818280,4218750,42968750,425781250,008219640,000966377,9432E-060,9174311990,425781250,42968750,4277343750,00096637-0,00265049-2,5613E-060,456621100,425781250,427734380,4267578130,00096637-0,00084287-8,1453E-070,22883295110,425781250,426757810,4262695310,000966376,1544E-055,9474E-080,11454754<br />FALSE POSITION METHODN° ITERACIONXiXs Xr=Xs-F(Xs)(Xi-Xs)/F(Xi)-F(Xs)F(Xi)F(Xs)F(Xr)F(Xi)*F(Xr)Ea0020,670761811-1,98168436-0,40931479-0,40931479 100,670761810,475948891-0,40931479-0,08994112-0,0899411240,93147915200,475948890,4366739461-0,08994112-0,01912266-0,019122668,994111954300,436673950,4284802651-0,01912266-0,00403004-0,004030041,912265637400,428480270,4267604051-0,00403004-0,00084767-0,000847670,403003816500,42676040,4263989581-0,00084767-0,00017823-0,000178230,084767304600,426398960,4263229761-0,00017823-3,7469E-05-3,7469E-050,017822515<br />NEWTON METHOD xiF(x)F´(x)ERROR01-0,86466472-1,270670566 10,319520940,20827694-2,055595758212,96853720,420842870,01014051-1,86196676424,075953930,4262892,5474E-05-1,8526289491,2775670940,426302751,612E-10-1,8526055020,003225450,426302750-1,8526055022,0411E-08<br />SECANTE METHOD Xi-1xiF(xi)F(xi-1)xi+1ERROR002-1,98168436110,67076181198,168436120,67076181-0,409314792-1,981684360,32473829106,55457920,670761810,324738290,197580806-0,409314790,4373896425,755376130,324738290,43738964-0,0204355940,197580810,426830352,4738832340,437389640,42683035-0,0009772-0,020435590,426300070,12439283<br />FIXED POINT METHODG1(x)N° ITERACIONESXF(x)G(x)101121-0,864664720,13533528330,135335280,627532490,76286776940,76286777-0,545406720,21746104750,217461050,429854050,64731509560,64731509-0,373315920,27399917370,273999170,304106650,5781058280,57810582-0,263429790,31467603190,314676030,218260970,532936999100,532937-0,18851030,344426695110,34442670,157724820,502151511120,50215151-0,135851660,366299849130,366299850,114357950,480657799140,4806578-0,098268320,382389484150,382389480,083047310,465436796160,4654368-0,071227610,394209182170,394209180,0603540,454563181180,45456318-0,051687140,402876038190,402876040,043875770,446751809200,44675181-0,037532320,40921949210,409219490,031900220,441119714220,44111971-0,027264640,413855074230,413855070,023193840,437048918<br />Plot a curve to compare the percentage of relative error versus the number of iterations of each method.<br />First we make the tables<br />NEWTON METHOD% ERROR RELATIVON° ITERACIONES  212,9685366124,0759539321,27756708930,00322540542,04108E-085  <br />SECANTE METHOD% ERROR RELATIVON° ITERACIONES    198,16843610106,5545793125,7553760722,47388323130,1243928264<br />BISECCION METHOD% ERROR RELATIVON° ITERACIONES  1000100133,33333333214,2857142937,69230769243,70370370451,81818181860,91743119370,45662100580,22883295290,11454753710<br />Now make de graph<br />