Senior Project Students' Presentation on ECG Monitoring
•Download as PPTX, PDF•
2 likes•3,131 views

Towards Development of a Low Cost and Portable ECG Monitoring System for Rural/Remote Areas of Bangladesh

Recommended
More Related Content
What's hot
What's hot (20)
Similar to Senior Project Students' Presentation on ECG Monitoring
Similar to Senior Project Students' Presentation on ECG Monitoring (20)
More from Md Kafiul Islam
More from Md Kafiul Islam (20)
Recently uploaded
Recently uploaded (20)
Senior Project Students' Presentation on ECG Monitoring
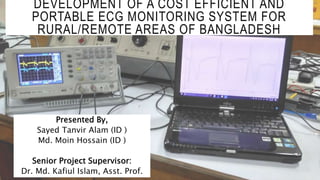
- 1. DEVELOPMENT OF A COST EFFICIENT AND PORTABLE ECG MONITORING SYSTEM FOR RURAL/REMOTE AREAS OF BANGLADESH Presented By, Sayed Tanvir Alam (ID ) Md. Moin Hossain (ID ) Senior Project Supervisor: Dr. Md. Kafiul Islam, Asst. Prof.
- 2. OUTLINE Introduction ECG Basic and its Recording Motivation and Goal/Objectives Challenges Proposed System Development Circuit Simulation in Proteus Hardware Electrode Selection Dual DC Voltage Regulator Instrumentation Amplifier Active Filter (Low-Pass) Circuit for DC Offset Interfacing with PC Arduino UNO + MATLAB Software (MATLAB) Preprocessing in MATLAB (Filtering) QRS Complex Detection Report Generation Results Analysis Effect of Filtering QRS Complex detection HR Detection RR interval Morphological values interpretation ECG Diagnosis Report Conclusion Future Works References & Acknowledgment Q & A 2
- 3. INTRODUCTION Electrocardiography (ECG or EKG) is the process of recording the electrical activity of the heart over a period of time using electrodes placed on the skin. These electrodes detect the tiny electrical changes on the skin that arise from the depolarizing and repolarizing of heart muscle during each heartbeat. 3
- 4. ECG SIGNAL An ECG signal, which is as small as 1 mV, is the heart’s electrical signal that is extracted by an electrocardiograph. The signal is complex in nature. It generally is composed of QRS complexes, P waves and T waves. 4
- 5. FORMATION OF ECG SIGNAL• Electrical signal generates at the Sinoatrial node. • The electrical signal then travels through the right and left atria which is recorded as P wave. • The electrical signal passes through atrioventricular node which is recorded as the flat line between the P wave and the QRS wave. • The electrical signal then passes through the bundle of His and Purkinje fibers. The signal travels then passes into the right and left bundle branches. The signal spreads quickly across heart's ventricles which is recorded as the QRS wave. • The ventricles then recover their normal electrical state which is recorded as the T wave. 5
- 6. ELECTRODE PLACEMENT OF 12 LEAD ECG In a conventional 12 lead electrocardiograph 10 electrodes are placed in various part of the body as shown in the figure. 6
- 7. 12 LEADS OF CONVENTION AL ECG Vertical Leads Horizontal Leads 1. Lead I 7. V1 2. Lead II 8. V2 3. Lead III 9. V3 4. aVF 10. V4 5. aVL 11. V5 6. aVR 12. V6 7
- 8. MOTIVATION AND OBJECTIVES •Electrocardiographs available in the market are very expensive. •Most hospitals and heath care centers at rural and remote areas of Bangladesh cannot afford such expensive devices. •Patients from these area suffer from underdiagnosing. •A low cost portable ECG monitoring device will come in aid to the health care of these underprivileged regions. •As PC/Laptops are now widely available, an ECG monitoring system that can be connected to a PC/Laptop will solve the problem to an extent. 8
- 9. CHALLENGES IN ECG ACQUISITION Very low signal amplitude (1mV – 5 mV) to detect. Often very noisy because of both internal & external sources Selection of low-cost affordable electrodes Available local resources Making it portable is not easy Wires connected to ECG leads or electrodes often fluctuate to produce motion artifacts Subject motion is problematic in reliable ECG acquisition Others 9
- 10. PROPOSED SYSTEM DESIGN The circuit design of the whole device can be broken down in to the following parts: •Dual DC voltage regulator •Instrumentation amplifier •Active low pass filter •Circuit to add DC offset •Circuit to measure heart beat rate and RR interval •Interface with PC/Laptop using Arduino 10
- 11. DUAL DC VOLTAGE REGULATOR• The circuit components require a regulated voltages. Fluctuation in voltage can damage the ICs used in the system. Also, the ICs used in the system require a positive and a negative voltage supply. • 7809 provides a regulated +9V output. • 7909 provides a regulated -9V output. • Diode D1 and D2 provides reverse bias protection to regulators. • Diode D3 and D4 are used for protection against output polarity reversal. • Capacitors are used to filter ripple effect. Schematic Diagram of Dual DC Voltage Regulator 11
- 12. DUAL DC VOLTAGE REGULATOR Hardware Implementation Simulation of the Circuit 12
- 13. INSTRUMENT ATION AMPLIFIER • Eliminates noise interference and extracts ECG signal. • Takes the difference between the two electrodes and amplifies it. • Some noise also gets amplified. • Amplitude of input: 1 mV to 5 mV • Gain = 1 + 49.4 𝑘Ω 47 = 1052.06 • Amplitude of output: 1 V to 5V Schematic Diagram of Instrumentation Amplifier 13
- 14. INSTRUMENT ATION AMPLIFIER Output of Instrumentation Amplifier Hardware Implementation of Instrumentation Amplifier 14
- 15. ELECTRODES Circular pad electrodes with silicon conductor and electrolyte contain potassium chloride were used. These electrodes permit electron conduction from the skin to the wire and to the electrocardiogram. Connectors of these electrodes were made by drilling holes in small pieces of iron sheet. As these electrodes are connected to the chest, these provide a horizontal view of the heart’s electrical activity. Disposable Circular Pad Electrodes 15
- 16. ACTIVE LOW PASS FILTER • Removes high frequency noise interference. • Cutoff Frequency: 1 2π R1R2C1C2 = 79.58 Hz • Order of filter: 2nd order • Gain: Unity • Output: Noninverted Schematic Diagram of Active Low Pass Filter 16
- 17. ACTIVE LOW PASS FILTER Hardware Implementation and Output of Low Pass Filter Simulation of Low Pass Filter with Frequency Response 17
- 18. CIRCUIT TO ADD DC OFFSET A DC offset is added to the ECG signal so that the minimum voltage of the signal is above 0V. Reasons to add DC offset: • Arduino used in the later part can not read negative voltage. • It was observed that adding a DC offset eliminates baseline wandering effect of the ECG signal. Schematic Diagram of Circuit to Add DC Offse 18
- 19. CIRCUIT TO ADD DC OFFSET Hardware Implementation of Circuit to Add DC Offset Output of After DC Offset Addition 19
- 20. CIRCUIT TO MEASURE HEART BEAT RATE AND RR INTERVAL Arduino and LCD are interfaced as shown. ECG signal is given as input to Arduino digital pin D7. The following algorithm is followed of make the measurements: • Reset Arduino timer. • Start measuring time when the first high pulse is detected. • Stop measuring time after 10 high pulse is detected. • Convert the time measured from milliseconds to seconds. • Divide the total time measured by 10. This gives the average RR interval or basically the period of the signal. • Calculate the reciprocal of average RR interval. This gives the number of beats in one second or basically the frequency of the ECG signal. • Multiple the value obtained from the previous step by 60. The gives us the number of beats per minute. • Send the value to the LCD connected to the Arduino. Schematic Diagram of Circuit Used to Measure Heart Beat Rate and RR Interval 20
- 21. CIRCUIT TO MEASURE HEART BEAT RATE AND RR INTERVAL Simulation in ProteusHardware Implementation of Circuit 21
- 22. SCHEMATIC OF THE DEVICE 22
- 23. CIRCUIT TO PC/LAPTOP INTERFACING USING ARDUINO To interface the circuit with PC/Laptop, an Arduino is used. The signal is feed into the analog input port A0 of the Arduino. Arduino is instructed to read the analog signal. Arduino performs ADC on the ECG signal. Arduino is instructed to dump the data in a variable. Arduino is instructed to initiate serial communication with serial plotter with baud rate 115200. Sampling frequency is 785 Hz. ECG signal is view on PC/Laptop screen using serial plotter. 23
- 24. CIRCUIT TO PC/LAPTOP INTERFACING USING ARDUINO 24
- 25. SERIAL COMMUNICATION BETWEEN ARDUINO AND MATLAB Serial communication is established between Arduino and MATLAB using the same communication port and same baud rate so that data from the Arduino can be sent to MATLAB. Number of samples MATLAB should store is specified. Arduino sends one sample per milliseconds. Therefore, for ECG recording of 1 minute, 60000 samples were taken. Received data from the Arduino is dumped in an matrix array by MATLAB. When the specified number of samples are taken, the communication channel is terminated and MATLAB plots the data it received from Arduino. 25
- 26. SERIAL COMMUNICATION BETWEEN ARDUINO AND MATLAB Raw ECG Data Obtained by MATLAB from Arduino 26
- 27. FLOW OF ECG SIGNAL ECG Circuit Arduino MATLAB 27
- 28. SIGNAL PROCESSING IN MATLAB To remove power supply and high frequency noise notch filter and low pass filter were designed in MATLAB. FIR filter was used to design the low pass filter of order 256 and cutoff frequency of 80 Hz to remove high frequency signal. FIR filter is used as they are stable, easy to implement, and have a linear phase response. IIR filter was used to design the notch filter of order 2 and cutoff frequency of 50 Hz to remove interference from power line. IIR filter was used in this case as they have better frequency response than FIR filters with the same order of filter. An immediate attenuation in gain is required at 50 Hz. 28
- 29. EFFECT OF FILTERING IN MATLAB 29
- 30. EFFECT OF NOTCH FILTERING IN MATLAB 30
- 31. QRS DETECTION An open source algorithm ‘cardio24’ from ‘redxlab’ was used to detect QRS complexes of ECG signal. By detecting QRS complexes various morphological values od ECG signal can be determined. The flowchart of the algorithm used is provided. 31
- 32. QRS DETECTION 32
- 33. MORPHOLOGICAL VALUE DETERMINATION Once the QRST complex of ECG signal has been detected various morphological values can be easily determined. The ‘cardio24’ algorithm by ‘redxlab’ can determine 12 morphological values and also determine if the values are normal or not:Maximum heart rate Average heart rate Minimum heart rate Total number of QRS Number of irregular beats Percentage of irregular beats Number of episodes with consecutive irregular beats Average PR interval Average QRS Interval Average QT Interval Number of P wave absences Number of episodes that has more than 4 consecutive P wave absences 33
- 34. ECG DIAGNOSIS REPORT GENERATION The morphological values determined by the algorithm can be extracted and MATLAB can be instructed to create a text file and dump the values on that file. Report Generated using MATLAB34
- 35. TARGET REPORT 35
- 36. CONCLUSION The ECG monitoring system developed is very cheap (around 1500 BDT) and will come in aid of people living in the rural and remote areas of Bangladesh. The system only requires a PC/Laptop as processing terminal which are now even available in these rural or remote areas. The ECG signal obtained after analog and digital filtering is of satisfyingly good quality. The morphological values and the report generated by the algorithm can help doctors make diagnosis more easily. 36
- 37. FUTURE WORK Eliminate the need of an Arduino to interface with PC/Laptop. Interfacing a graphical LCD and eliminate the need of a PC/Laptop for real-time monitoring. Develop a smartphone application and interface the circuit with it so that real-time analysis can be perform using a smartphone. Convert the circuit into PCB and Use two 9V batteries as overall power supply. Packaging of the whole system Generating professional ECG Diagnosis Report (After consultation with clinicians ) 37ECG Traces on Graphical LCD ECG Traces on Smartphone Apps
- 38. REFERENCES AND ACKNOWLEDGMENT Key References: Acknowledgment and Thanks: 1. IUB for Senior Project Funding 2. Dehan Rahman from EEE, IUT for helping with PC interfacing and report generation 3. R&D Officers, Lab Technical Officer, Technician and Housekeeper. 38
- 39. THANK YOU 39