Module 3.1 brainstorming eng fin
•Download as PPTX, PDF•
0 likes•382 views

This is the 12th in a series of 15 webinar modules reference material for Pedagogical Content Knowledge (PCK) for Lao Teacher Training of the Ministry of Education and Sports, Lao PDR, with assistance from the Education for Employment Sector Development Project (EESDP) with the Asian Development Bank. This initiative is a convergence effort of the Department of General Education (DGE), Research Institute for Educational Sciences (RIES), the Dept. of Teacher Training (DTE) and the Institute For Education Administration Development (IFEAD). Packaged by Project Implementation Consultant (PIC) Intem Philippines

Recommended
More Related Content
What's hot
What's hot (20)
Similar to Module 3.1 brainstorming eng fin
Similar to Module 3.1 brainstorming eng fin (20)
More from Joel Wayne Ganibe, MBA
More from Joel Wayne Ganibe, MBA (20)
Recently uploaded
Recently uploaded (20)
Module 3.1 brainstorming eng fin
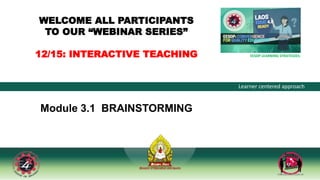
- 1. EESDP LEARNING STRATEGIES: Learner centered approach Module 3.1 BRAINSTORMING WELCOME ALL PARTICIPANTS TO OUR “WEBINAR SERIES” 12/15: INTERACTIVE TEACHING
- 2. Contents • Definition of brainstorming • Reasons for doing brainstorming • Brainstorming tools • Steps of doing brainstorming • Types of brainstorming
- 3. What is brainstorming? • Brainstorming is a method used to generate ideas to solve clearly defined problems. In a classroom environment with controlled conditions and a free-thinking environment , students approach a problem by such means as “how might we” questions. This way, students can produce various ideas and draw links between them to find potential solutions. • Brainstorming combines a relaxed, informal approach to problem solving with lateral thinking. It encourages people to come up with thoughts and ideas that can, at first, seem a bit crazy. Some of these ideas can be crafted into original, creative solutions to a problem, while others can spark even more ideas. This helps to get people unstuck by pushing them out of the box (their normal ways of thinking).
- 4. Why do brainstorming? It… • generates ideas on a given topic • promotes thinking skills of students • eliminates fear of failures • gives all students chance to express their ideas • shows respect for each other • taps into individuality and creativity.
- 5. Brainstorming tools 1. Graphics Organizers 2. Mind Maps 3. Concept Maps 4. Fishbone Diagrams 5. Flowcharts 6. SWOT Analysis 7. Starbursting 8. Affinity Diagrams
- 6. 1. Graphics Organizers A Graphic Organizer graphic organizer is a teaching and learning tool that is used to organize information and ideas in a way that is easy to connect, understand, comprehend and internalize. By integrating text and visuals, graphic organizers show relationships and connections between concepts, terms, and facts as show below showing: • basic outline; • Venn diagram; • hierarchical topical organizer; and • bubble topical organizer. The teacher may start the preparation of any of these graphic organizers and ask students to share their ideas by filling in the blank spaces. For further learning please watch: https://www.youtube.com/watch?v=mNFk9AQhKAA
- 7. 2. Mind Maps A Mind Map is another graphic organizer which can be used as a brainstorming tool to allow free flow of thoughts without worrying about order and structure. It allows students to visually structure their ideas to help with analysis and recall. It represents tasks, words, concepts, or items linked to and arranged around a central concept or subject using a non-linear graphical layout that allows students to build an intuitive framework around a central concept. A Mind Map can turn a long list of monotonous information into a colorful, memorable and highly organized diagram that works in line with your brain's natural way of doing things. In using a mind map, the teacher may create and write a central idea on the board about the topic or a lesson that will be discussed. Then, the teacher will add branches to the map and invite students to share their thoughts using keywords. Once most of the students have shared their ideas, the teacher will process the mind maps by clarifying connections using devices such as color coding of branches or including visual images. For further learning please watch: https://www.youtube.com/watch?v=xCyjFipytRE
- 8. 3. Concept Maps Concept mapping is a brainstorming technique that lets you visualize concepts and ideas. Also known as “mind mapping”, this technique starts with a research question or main idea, then adds branches with synonyms, related topic, keywords, and examples.
- 9. 4. Fishbone Diagrams The fishbone diagram is a cause analysis tool which helps identify many possible causes for an effect or problem. Marking pens, paper or whiteboards are the usual materials needed in doing a fishbone diagram. In using this diagram, the teacher must facilitate: • students’ agreement on a problem statement (effect). Write it at the center right of the flipchart or whiteboard. Draw a box around it and draw a horizontal arrow running to it; • brainstorm the major categories of causes of the problem. These generic headings may be used: Methods; Machines (equipment); People (manpower); Materials; Measurement; Environment. • Write the categories of causes as branches from the main arrow; • Brainstorm all the possible causes of the problem. Ask "Why does this happen?" As each idea is given, the teacher writes it as a branch from the appropriate category. Causes can be written in several places if they relate to several categories; • Again ask "Why does this happen?" about each cause. Write sub-causes branching off the causes. Continue to ask "Why?" and generate deeper levels of causes. Layers of branches indicate causal relationships; • When the group runs out of ideas, focus attention to places on the chart where ideas are few; • summarize ideas or formulate hypothesis. For further learning please watch: https://www.youtube.com/watch?v=JbRx5pw-efg
- 10. 5. Flowcharts A flowchart is a type of diagram that represents a workflow or process. A flowchart can also be defined as a diagrammatic representation of a step-by-step approach to solving a task. The flowchart shows the steps as boxes of various kinds, and their order by connecting the boxes with arrows. Using a flowchart has the following benefits; • It helps to clarify complex processes; • It identifies necessary steps to achieve a purpose; • It helps learners gain a shared understanding of the process and use this knowledge to collect data, identify problems, focus discussions, and identify resources; • It serves as a basis for designing new processes. For further learning please watch: https://www.youtube.com/watch?v=iJmcgQRk048
- 11. 6. SWOT Analysis SWOT analysis is useful in coming up with a strategy to solve a problem. It is a technique for assessing these four aspects in say a Science project. Students can use SWOT Analysis to make the most of what they have got, to their best advantage. Using this can reduce the chances of failure, by understanding what is lacking and eliminating hazards that would otherwise catch you unaware. For teachers facilitating the use of SWOT analysis for learning, they have to: (i) set the objective and decide on a key project or strategy to analyze and give to students. Explain the four quadrants and distinguish meanings of Strengths, Weaknesses, Opportunities, and Threats. (ii) Then, students will: (ii) create a grid. Draw a large square and then divide it into four smaller squares; (iii)Label each box; (iv)Add strengths and weaknesses (v) Draw conclusions. Students will be asked to present their outputs and conclusions with the teacher summarizing core insights and learnings. For further learning please watch: https://www.youtube.com/watch?v=JXXHqM6RzZQ https://www.youtube.com/watch?v=JXXHqM6RzZQ
- 12. 7. Starbursting Starbursting is a form of brainstorming that focuses on generating questions rather than answers. It can be used iteratively, with further layers of questioning about the answers to the initial set of questions. The teacher should assign the problem and on said basis, students will have to start asking questions by connecting to the star, until it burst and burst. Depending on the scope of the exercise, you may want to have further starbursting sessions to explore the answers to these initial questions further. For further learning please watch: https://www.youtube.com/watch?v=11poGPteJdI
- 13. 8. Affinity Diagrams The affinity diagram process lets a group move beyond its habitual thinking and preconceived categories. This technique accesses the great knowledge and understanding residing untapped in our intuition. It is important for teachers to know when to use affinity diagrams. Here are situations when such can be used: (i) When you are confronted with many facts or ideas in apparent chaos; (ii) When issues seem too large and complex to grasp; and (iii) When group consensus is necessary. Typical situations are: (i) After a brainstorming exercise; (ii) When analyzing verbal data, such as survey results; (iii) When collecting and organizing large data sets; (iv) When developing relationships or themes among ideas; (v) When reducing attributes to categories that can be addressed at a higher level. For further learning please watch: https://www.youtube.com/watch?v=f9sfJTp8tzc
- 14. Steps of doing brainstorming 1. Prepare the Group 2. Present the Problem 3. Guide the Discussion
- 15. Step 1. Guide the discussion The teacher must be able to guide the discussion by posting a problem which s/he wants to solve aligning with the learning task.
- 16. Step 2. Prepare the group The teacher must prepare the class by gathering their ideas and aid them in organizing such as ideas. The teacher may suggest any of the different brainstorming tools to draw out ideas from students: • Graphic Organizers • Mind Maps • Fishbone Diagrams • Flowcharts • SWOT Analysis • Starbursting • Affinity Diagrams • Concept Maps and others
- 17. Step 3. Present the Problem Students provide inputs and freely discuss the issue at hand.
- 18. What not to do? • During brainstorming sessions, the teacher should avoid criticizing or rewarding ideas [as] you're trying to open up possibilities and break down incorrect assumptions about the problem's limits. • Judgment and analysis at this stage stunts idea generation and limit creativity.
- 19. Type of Brainstorming Individual Brainstorming Group Brainstorming
- 20. Role of Teacher ● Facilitator ● Promotes and probes by asking questions ● Records these ideas on board, chart etc. ● Encourages students to think critically
- 21. Rule of Brainstorming in teaching ● There are “NO WRONG” answers ● Try to get as many ideas as possible ● Record all ideas ● Set a time limit ● Be prepared to have some simulating ideas for group
- 22. Anything goes – don’t restrict your ideas
- 23. Think of what might work and blurt it out.
- 25. Incubate for a while
- 26. Collect ideas and suggestions from All the participants without evaluating them
- 27. Idea should be broaden the Perception.
- 29. The best ways to spark innovations are by: • Defining the objectives of the session • Defining the rules such as one person speaking at a time, all ideas accepted, no insulting at an idea • Setting priorities for conclusions • The mediator initiates action steeps to be taken by individual members of the group.
- 30. During a brainstorming session, remember to:
- 31. Break down traditional walls to identify innovative ideas and alternatives.
- 32. Ask all participants to respond with “Yes”
- 33. No one can dismiss an idea when the brainstorming starts as it creates an atmosphere of openness and trust
- 34. Allow the participants to say whatever comes to their mind without a filter and fear of they being looked upon as odd.
- 35. Try to get everyone to participate--even the quiet one
- 36. Set the timeframe for the conclusion, development, implementation of idea generated in a brainstorming session.
- 38. Brainstorm on opposites. Try Random association. Associate concepts/ideas with visual pegs/handles: Ex. COLD=ice=ice-cold-beer; moisture on glass/mug COLD WEATHER=moisture outside glass window Ex. On a mindmap/chart: Negative aspects on left side; positive on right side
- 39. Listen carefully to what is being said.
- 40. Brainstorming becomes meaningful once it is put into different contexts, such as: Personal perspective/individual learner Group/community perspective District/province perspective Economic domain Technical/scientific domain Cultural domain
- 41. Started with objects that don’t have an evident/obvious relation with the main subject Remember the first objective was to generate as many ideas/hypotheses as possible before screening/choosing which ones to pursue
- 42. Try to relate the main subject in the web created to put aside odd ideas. Here is the stage when screening/choosing which ones to pursue begins by testing relevance or connection to the main subject/goal/ objective/ problem
- 43. Things to do...
- 44. Be courteous to allow and encourage all other ideas to develop first
- 45. Explorer ideas on the premise that each of them is possible.
- 46. Don’t discuss them as people offer them -- just write them all down first
- 47. Stay positive about the process and all the ideas
- 48. The more people become comfortable participating, the more ideas on hand to choose from.
- 49. Set up Twitter account to collect brainstorming ideas If you have class FB group or Page, ask inputs as “comments” Give each group big sheet of paper and markers Idea for Teachers
- 50. Stress the ability to “listen from nothing” and you will hear what you have never heard before Simply remain open-minded and train your students to do the same
- 52. Activity: Using in business start up course 1. Session plan for conducting a brainstorming https://drive.google.com/file/d/1LIw7_JsoQ0BgeKeP6YA6r6OcG7wf6tDM/view?usp=sharing 2. Handout on “How to Brainstorm?” https://drive.google.com/file/d/16VDDd53S6x5EbM9ZTWI_XzdRpdKIpelL/view?usp=sharing 3. Photo use for each group (25 participants, 5 people per group) https://drive.google.com/file/d/16VDDd53S6x5EbM9ZTWI_XzdRpdKIpelL/view?usp=sharing 4. Exercise Brainstorming on “The Do’s and Don’t during brainstorming” by using online platform Padlet. Join this Brainstorming (a) by scanning QR bellowing; (b) https://padlet.com/bountham2010/brainstorming