More Related Content
Similar to Daily livestock report no.156
Similar to Daily livestock report no.156 (20)
More from joseleorcasita (20)
Daily livestock report no.156
- 1. Vol. 10, No. 156 / July 12, 2012
Market Comments US MONTHLY PORK EXPORTS, METRIC TON, SW
180,000
With plenty of data being released in the last 24 hours, we will do
our best today and tomorrow to cover properly. Below is a brief 160,000
recap: 140,000
China +
H. Kong
- Corn Supply Outlook: USDA surprised trade by lowering 120,000
estimated corn yields for the 2012 harvest by some 20 bushels per
100,000
acre compared to its earlier forecast. This removed 1.8 billion
bushels (12%) of expected production. USDA opted to leave the 80,000
Rest of
the World
harvested acres estimate unchanged, not that unusual for a July
60,000
report. That number has the potential to remove up to half a bil-
lion bushels from the supply/demand table. USDA now estimat- 40,000
ing feed use at 4.8 billion bushels, 12% less than the June fore-
20,000
cast. That number is about the same as in 2010/11 but with a
smaller DDG supply available given lower ethanol production. -
Exports were lowered by 300 million bushels (16%) despite mar- 2010 2011 2012
ket expecting robust Asian demand into next year. In all, a nega-
tive report for livestock production as high prices will need to ra- Y/Y Change in May 2012 US Beef Exports
tion a shrinking feed supply and keep meat output in check. Contribution by Selected Markets to Overall Total
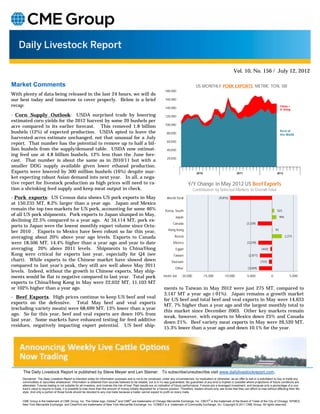
- Pork exports: US Census data shows US pork exports in May World Total (9,815)
at 150,235 MT, 8.2% larger than a year ago. Japan and Mexico
remain the top two markets for US pork, accounting for some 46% Korea, South 523
of all US pork shipments. Pork exports to Japan slumped in May, Japan 994
declining 22.5% compared to a year ago. At 34,114 MT, pork ex-
Canada (3,339)
ports to Japan were the lowest monthly export volume since Octo-
ber 2010 . Exports to Mexico have been robust so far this year, Hong Kong 93
averaging about 20% above year ago levels. Exports to Canada Russia 2,273
were 18,506 MT, 14.4% higher than a year ago and year to date Mexico (3,239)
averaging 20% above 2011 levels. Shipments to China/Hong Egypt (442)
Kong were critical for exports last year, especially for Q4 (see Taiwan (2,871)
chart). While exports to the Chinese market have slowed down Vietnam (737)
compared to last year’s peak, they still are well above May 2011
Other (3,069)
levels. Indeed, without the growth in Chinese exports, May ship-
ments would be flat to negative compared to last year. Total pork metric ton -20,000 -15,000 -10,000 -5,000 0 5,000
exports to China/Hong Kong in May were 22,032 MT, 11,103 MT
or 102% higher than a year ago. ments to Taiwan in May 2012 were just 275 MT, compared to
3,147 MT a year ago (-91%). Japan remains a growth market
- Beef Exports. High prices continue to keep US beef and veal
for US beef and total beef and veal exports in May were 14,633
exports on the defensive. Total May beef and veal exports
MT, 7% higher than a year ago and the largest monthly total to
(excluding variety meats) were 68,699 MT, 13% lower than a year
this market since December 2003. Other key markets remain
ago. So far this year, beef and veal exports are down 10% from
weak, however, with exports to Mexico down 25% and Canada
last year. Some markets have enhanced testing for feed additive
down 21%. Beef variety meat exports in May were 26,520 MT,
residues, negatively impacting export potential. US beef ship-
15.3% lower than a year ago and down 10.1% for the year.
The Daily Livestock Report is published by Steve Meyer and Len Steiner. To subscribe/unsubscribe visit www.dailylivestockreport.com.
Disclaimer: The Daily Livestock Report is intended solely for information purposes and is not to be construed, under any circumstances, by implication or otherwise, as an offer to sell or a solicitation to buy or trade any
commodities or securities whatsoever. Information is obtained from sources believed to be reliable, but is in no way guaranteed. No guarantee of any kind is implied or possible where projections of future conditions are
attempted. Futures trading is not suitable for all investors, and involves the risk of loss. Past results are no indication of future performance. Futures are a leveraged investment, and because only a percentage of a con-
tract’s value is require to trade, it is possible to lose more than the amount of money initially deposited for a futures position. Therefore, traders should only use funds that they can afford to lose without affecting their life-
style. And only a portion of those funds should be devoted to any one trade because a trader cannot expect to profit on every trade.
CME Group is the trademark of CME Group, Inc. The Globe logo, Globex® and CME® are trademarks of Chicago Mercantile Exchange, Inc. CBOT® is the trademark of the Board of Trade of the City of Chicago. NYMEX,
New York Mercantile Exchange, and ClearPort are trademarks of New York Mercantile Exchange. Inc. COMEX is a trademark of Commodity Exchange, Inc. Copyright © 2011 CME Group. All rights reserved.