More Related Content More from joseleorcasita (20) 1. Vol. 10, No. 199 / October 15, 2012
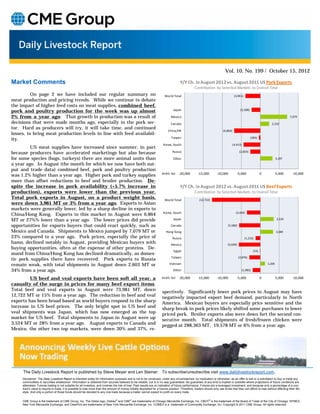
Market Comments Y/Y Ch. in August 2012 vs. August 2011 US Pork Exports
Contribution by Selected Markets to Overall Total
On page 2 we have included our regular summary on World Total (3,961)
meat production and pricing trends. While we continue to debate
the impact of higher feed costs on meat supplies, combined beef,
pork and poultry production for the week was up almost Japan (2,308)
2% from a year ago. That growth in production was a result of Mexico 7,079
decisions that were made months ago, especially in the pork sec- Canada 2,332
tor. Hard as producers will try, it will take time, and continued
China/HK (6,864)
losses, to bring meat production levels in line with feed availabil-
ity. Taiwan (383)
Korea, South (4,413)
US meat supplies have increased since summer, in part
because producers have accelerated marketings but also because Russia (2,603)
for some species (hogs, turkeys) there are more animal units than Other 3,197
a year ago. In August (the month for which we now have both out-
put and trade data) combined beef, pork and poultry production
metric ton ‐20,000 ‐15,000 ‐10,000 ‐5,000 0 5,000 10,000
was 1.2% higher than a year ago. Higher pork and turkey supplies
more than offset reductions in beef and broiler production. De-
spite the increase in pork availability (+5.7% increase in Y/Y Ch. in August 2012 vs. August 2011 US Beef Exports
production), exports were lower than the previous year. Contribution by Selected Markets to Overall Total
Total pork exports in August, on a product weight basis, World Total (12,722)
were down 3,961 MT or 3% from a year ago. Exports to Asian
markets were generally lower, led by a sharp decline in exports to
China/Hong Kong. Exports to this market in August were 6,864 Korea, South (3,492)
MT or 27%% lower than a year ago. The lower prices did provide Japan 3,524
opportunities for exports buyers that could react quickly, such as Canada (5,580)
Mexico and Canada. Shipments to Mexico jumped by 7,079 MT or Hong Kong 3,384
23% compared to a year ago. Pork prices, especially the price of Russia (1,232)
hams, declined notably in August, providing Mexican buyers with Mexico (5,620)
buying opportunities, often at the expense of other proteins. De-
Egypt (53)
mand from China/Hong Kong has declined dramatically, as domes-
Taiwan
tic pork supplies there have recovered. Pork exports to Russia (2,876)
remain weak, with total shipments in August down 2,603 MT or Vietnam 1,205
34% from a year ago. Other (1,983)
US beef and veal exports have been soft all year, a metric ton ‐20,000 ‐15,000 ‐10,000 ‐5,000 0 5,000 10,000
casualty of the surge in prices for many beef export items.
Total beef and veal exports in August were 73,981 MT, down spectively. Significantly lower pork prices in August may have
12,722 MT or 15% from a year ago. The reduction in beef and veal negatively impacted export beef demand, particularly in North
exports has been broad based as world buyers respond to the sharp America. Mexican buyers are especially price sensitive and the
increase in US beef prices. The only bright spot in US beef and sharp break in pork prices likely shifted some purchases to lower
veal shipments was Japan, which has now emerged as the top priced pork. Broiler exports also were down fort the second con-
market for US beef. Total shipments to Japan in August were up secutive month. Total shipments of fresh/frozen chicken were
3,524 MT or 28% from a year ago. August exports to Canada and pegged at 288,363 MT, 19,578 MT or 6% from a year ago.
Mexico, the other two top markets, were down 30% and 37%, re-
The Daily Livestock Report is published by Steve Meyer and Len Steiner. To subscribe/unsubscribe visit www.dailylivestockreport.com.
Disclaimer: The Daily Livestock Report is intended solely for information purposes and is not to be construed, under any circumstances, by implication or otherwise, as an offer to sell or a solicitation to buy or trade any
commodities or securities whatsoever. Information is obtained from sources believed to be reliable, but is in no way guaranteed. No guarantee of any kind is implied or possible where projections of future conditions are
attempted. Futures trading is not suitable for all investors, and involves the risk of loss. Past results are no indication of future performance. Futures are a leveraged investment, and because only a percentage of a con-
tract’s value is require to trade, it is possible to lose more than the amount of money initially deposited for a futures position. Therefore, traders should only use funds that they can afford to lose without affecting their life-
style. And only a portion of those funds should be devoted to any one trade because a trader cannot expect to profit on every trade.
CME Group is the trademark of CME Group, Inc. The Globe logo, Globex® and CME® are trademarks of Chicago Mercantile Exchange, Inc. CBOT® is the trademark of the Board of Trade of the City of Chicago. NYMEX,
New York Mercantile Exchange, and ClearPort are trademarks of New York Mercantile Exchange. Inc. COMEX is a trademark of Commodity Exchange, Inc. Copyright © 2011 CME Group. All rights reserved.
2. Page 2
Vol. 10, No. 199 / October 15, 2012
PRODUCTION & PRICE SUMMARY Week Ending 10/13/2012
Current Pct. Pct. Y/Y %
Item Units Week Last Week Change Last Year Change YTD Change
13-Oct-12 6-Oct-12 15-Oct-11
Total Red Meat & Poultry mil lbs., cwe 1,793 1,772 1.20% 1,760 1.88% 68,565 11.3%
FI Slaughter Thou. Head 628 620 1.29% 650 -3.40% 25,530 -4.2%
C FI Cow Slaughter ** Thou. Head 132 129 2.93% 146 -9.47% 4,679 -4.8%
A Avg. Live Weight Lbs. 1326 1327 -0.08% 1290 2.79% 1,300 1.9%
T Avg. Dressed Weight Lbs. 798 797 0.13% 781 2.18% 788 2.1%
T Beef Production Million Lbs. 500.0 493.3 1.36% 506.5 -1.28% 20,083 -2.0%
L Live Fed Steer Price $ per cwt 123.08 123.47 -0.32% 119.00 3.43%
E Dressed Fed Steer Price $ per cwt 192.06 189.87 1.15% 187.81 2.26%
OKC Feeder Steer, 600-700 $ per cwt 149.58 148.60 0.66% 140.79 6.25%
& Choice Beef Cutout $ per cwt 191.15 190.34 0.43% 185.38 3.11%
Hide/Offal $ per cwt, live wt 13.28 13.34 -0.45% 13.06 1.68%
B Rib, Choice $ per cwt 287.21 287.09 0.04% 296.57 -3.16%
E Round, Choice $ per cwt 170.75 170.23 0.31% 168.79 1.16%
E Chuck, Choice $ per cwt 165.53 164.54 0.60% 154.18 7.36%
F Trimmings, 50% $ per cwt 53.11 51.59 2.95% 90.57 -41.36%
Trimmings, 90% $ per cwt 201.45 201.80 -0.17% 167.40 20.34%
FI Slaughter Thou. Head 2,396 2,355 1.74% 2,319 3.34% 86,822 2.0%
FI Sow Slaughter ** Thou. Head 66.0 66.7 -1.15% 62.8 5.06% 2,227 -0.3%
H Avg. Dressed Weight Lbs. 202.0 202.0 0.00% 205.0 -1.46% 206 0.3%
O Pork Production Million Lbs. 484.5 476.7 1.64% 475.4 1.91% 17,850 2.4%
G Iowa-S. Minn. Direct Wtd. Avg. 80.72 79.04 2.13% 91.06 -11.36%
S Natl. Base Carcass Price Wtd. Avg. 81.06 78.55 3.20% 89.87 -9.80%
Natl. Net Carcass Price Wtd. Avg. 83.41 80.97 3.01% 92.72 -10.04%
Pork Cutout 200 Lbs. 86.27 83.43 3.40% 97.33 -11.36%
Hams $ per cwt 76.48 73.99 3.37% 85.06 -10.09%
Loins $ per cwt 94.35 90.96 3.73% 112.10 -15.83%
Bellies $ per cwt 121.23 118.28 2.49% 123.48 -1.82%
C Young Chicken Slaughter * Million Head 154.4 155.6 -0.75% 153.8 0.40% 6,103 -3.9%
H Avg. Weight (Live) Lbs. 5.97 5.90 1.19% 5.80 2.93% 5.73 0.0%
I Chicken Production (RTC) Million Lbs. 696.1 693.2 0.42% 669.1 4.03% 26,349 -2.8%
C Eggs Set Million 185.1 185.9 -0.41% 186.3 -0.65% 7,801 -2.7%
K Chicks Placed Million Head 153.9 154.5 -0.43% 148.8 3.41% 6,524 -2.3%
E 12-City Broiler Price Composite 82.85 82.56 0.35% 72.29 14.61%
N Georgia Dock Broiler Price 2.5-3 Lbs. 94.98 95 -0.02% 87.14 9.00%
Northeast Breast, B/S $/cwt 132.38 131.73 0.49% 122.01 8.50%
Northeast Legs $/cwt 72.44 71.03 1.99% 72.47 -0.04%
T Young Turkey Slaughter * Million Head 4.700 4.45 5.62% 4.641 1.27% 176.080 -0.3%
U Avg. Live Weight Lbs. 29.95 30.54 -1.93% 29.38 1.94% 30.06 0.9%
R Turkey Production (RTC) Million Lbs. 112.5 108.7 3.54% 109.0 3.21% 4,283 2.0%
K Eastern Region Hen Price 8-16 Lbs. 111.13 111.02 0.10% 114.50 -2.94%
G Corn, Omaha $ per Bushel 7.88 7.65 3.01% 6.28 25.48%
R DDGs, Minnesota $ per Ton 257.50 265.00 -2.83% 186.00 38.44%
A Wheat, Kansas City $ per Bushel 8.60 8.39 2.50% 6.73 27.79%
I Soybeans, S. Iowa $ per Bushel 15.61 15.59 0.13% 12.52 24.68%
N Soybn Meal, 48% Decatur $ per Ton 491.20 485.30 1.22% 309.70 58.61%
* Chicken & turkey slaughter & production are 1 week earlier than the date at the top of this sheet.
** Cow and sow slaughter reflect levels from two weeks ago due to reporting lag.