SlideShare a Scribd company logo
1 of 8
Download to read offline
GMR 467 – 1 July 2016
HIGHLIGHTS
The forecast for total grains (wheat and coarse grains) production in
2016/17 is up by 10m t m/m (month-on-month), to 2,026m, the
second largest ever. Ample rains in recent months have improved
wheat and barley prospects in a number of regions, particularly in
Europe, the CIS and North America, although concerns have arisen
about below average quality. Despite the m/m upgrades, world wheat
and barley harvests are still expected to be smaller y/y (year-on-
year), but this is outweighed by an anticipated recovery in the maize
(corn) crop.
The projection for global consumption in 2016/17 is only fractionally
bigger m/m, at a new record of 2,010m t. Heavy supplies and
attractive prices raise the forecasts for wheat and barley feeding, but
the figure for maize demand in the livestock sector is cut by a broadly
equivalent amount. With little change in projected demand from last
time, but an increase in supply, the forecast for carryover stocks is
boosted by 9m t, to 482m, an expansion of 15m y/y. The trade
projection is 1m t higher than before, at 319m, with an increase for
wheat, but a cut for maize.
Reflecting a further downward adjustment for South America, world
soyabean output in 2015/16 is reduced by 2m t, to 312m, a drop of
3% y/y, but still markedly above average. Projected near-unchanged
from before, 2016/17 global output could recover to 320m t, on area
gains in major producers. However, with consumption anticipated to
expand, aggregate inventories are seen falling by 15%, to 28m t; the
total is lowered by around 1m to reflect a smaller projection for the
US. The forecast for trade is unchanged from May, at a record of
133m t, with the annual increase of 3m tied to China’s growing needs.
The Council’s estimate for rice output in 2015/16 is broadly
unchanged from last month’s report, the y/y decline of 7m t due to
disappointing crop outcomes in Asia. Predictions for 2016/17 are
especially tentative but, assuming improved outturns in that region,
notably in India, output could rise by 3%, to a new peak of 486m t.
However, with total use likely to climb further, stocks could again
tighten. The outlook for trade in calendar 2017 is maintained at about
42m t.
With gains for all the components other than wheat, the IGC Grains
and Oilseeds Index (GOI) rose by 5% m/m.
Figures may not add due to rounding
a) Wheat and coarse grains
b) Argentina, Australia, Canada, EU, Kazakhstan, Russia, Ukraine, US
c) Argentina, Brazil, Ukraine, US
d) Argentina, Brazil, US
e) India, Pakistan, Thailand, US, Vietnam
See: http://www.igc.int/grainsupdate/igc_goi.xlsb
13/14 14/15 15/16
est. f'cast
million tons 26.05 01.07
Production 2008 2046 2001 2015 2026
Trade 310 322 329 318 319
Consumption 1935 2008 1984 2009 2010
Carryover stocks 412 450 467 474 482
year/year change 73 38 17 15
Major exporters b)
121 144 148 158 160
Production 717 730 736 722 729
Trade 157 153 158 154 156
Consumption 699 717 719 717 720
Carryover stocks 188 201 217 223 226
year/year change 19 12 17 9
Major exporters b)
54 63 68 70 72
Production 998 1018 969 1003 1003
Trade 122 125 130 129 128
Consumption 950 993 972 1003 1002
Carryover stocks 182 207 204 205 205
year/year change 48 25 -3 1
Major exporters c)
52 59 52 58 57
Production 284 320 312 320 320
Trade 113 127 130 133 133
Consumption 281 311 317 325 324
Carryover stocks 29 38 33 29 28
year/year change 3 9 -5 -5
Major exporters d)
10 16 16 14 13
million tons (milled basis)
Production 478 479 473 486 486
Trade 42 42 42 42 42
Consumption 478 481 483 488 488
Carryover stocks 114 112 101 99 99
year/year change 0 -2 -11 -2
Major exporters e)
38 32 21 18 18
16/17
proj.
WORLD ESTIMATES
RICE
SOYABEANS
TOTAL GRAINS a)
WHEAT
MAIZE (CORN)
100
150
200
250
300
350
Jan Feb Mar Apr May Jun Jul Aug Sep Oct Nov Dec
Jan 2000 = 100
2011-15 range
2016 2015
IGC GRAINS & OILSEEDS INDEX (GOI)
INTERNATIONAL GRAINS COUNCIL
www.igc.int
Grain
Market
Report
GMR 467 – 1 July 2016 IGC
2
OVERVIEW
 Grains production in 2016/17 is expected to be
the second highest ever and, given record
opening stocks, total supply will be a new peak.
 With increases for food, feed and industrial uses,
consumption will likely be an all-time high.
 Led by accumulations in the major exporters and
China, grains stocks are expected to expand to
their largest ever level. Lower shipments to China
contribute to a predicted drop in world trade.
 Assuming market conditions encourage area
gains in major producers, 2016/17 soyabean
output could match the record of two years
earlier.
 The 2016/17 global rice outturn is seen at a new
peak on improved crops in Asia, notably India.
Total grains: Supply and demand summary
a) Argentina, Australia, Canada, EU, Kazakhstan, Russia, Ukraine, US
Global total grains (wheat and coarse grains)
production in 2016/17 is expected to surpass 2bn t for
the fourth consecutive year. While wheat and barley
harvests may not match the high levels of the year
before, the maize outturn is projected to post a solid
recovery from the three-year low in 2015/16. Although
still placed lower y/y, prospects for wheat production
continue to improve, but the wet finish to the growing
season in several countries will likely have a negative
impact on average quality.
Grains consumption will probably be a new peak, fuelled
by gains for food, feed and industrial uses. Amid heavy
supplies, attractively-priced wheat is capturing some
feed demand from alternatives, including maize,
although use of the latter is still seen at its highest ever.
Despite record consumption, grains carryover stocks will
likely climb again at the end of 2016/17, including
accumulations in the major exporters and China.
World grains trade in 2016/17 is forecast to fall
moderately from the previous season’s record. China, in
particular, is seen being a smaller buyer, as government
measures aimed at encouraging greater use of local
maize will likely cut its imports of barley and sorghum.
The Council’s 2015/16 global soyabean crop estimate is
downgraded by 2m t, to 312m, to reflect a lower figure
for Brazil, linked to smaller than anticipated yields.
Prospects for 2016/17 are highly tentative given that
fieldwork in South America will not begin until
September. But assuming some area expansion in key
producers, output could recover and match the 2014/15
peak of 320m t. Underpinned by demand for soyabean
products, consumption is seen expanding further,
resulting in another season of tightening stocks. At
27.8m t, inventories are projected to contract by 15%
y/y, including a sharp decline in the major exporters.
Trade is expected to reach a new high in 2016/17 on
continued growth in China’s protein meal requirements.
Rapeseed/canola output in 2016/17 is likely to fall for
the third consecutive year and, despite a retreat in total
use, carryovers are expected to decrease by around
one-quarter y/y.
Reflecting a reduced global crop and rising consumption,
2015/16 end-season inventories of rice are set to drop
by 9%, to 101m t, mostly explained by a heavy
contraction in leading exporters. World production in
2016/17 is predicted to reach a new high, but much will
depend on weather conditions in Asia’s main producers,
especially India, where the ongoing monsoon will be
crucial in shaping prospects. However, with uptake seen
at a record, stocks could again fall, to 99m t. The outlook
for trade will, as in all years, hinge on demand from
buyers in sub-Saharan Africa and Asia.
MARKET SUMMARY
Driven almost entirely by a further surge in soyabean
export prices, and with rice quotations slightly firmer, the
IGC GOI increased by a net 5% since late May. Overall
advances were trimmed by seasonal pressure in the
northern hemisphere, where harvesting of large winter
wheat and barley crops is now underway, as well as a
slight m/m weakening in average maize values.
Grains and oilseeds quotations generally retreated from
earlier highs on improved US Midwest weather forecasts
and mostly favourable global production prospects.
Turbulence on world financial and currency markets
following the UK referendum vote also affected prices,
especially wheat, late in the month.
IGC Grains & Oilseeds Prices Index (GOI)*
*Jan 2000=100, **Change vs. GMR 466
m t
13/14 14/15 15/16 16/17 y/y
(est.) (f'cast) (proj.) change
Opening stocks 339 412 450 467 + 3.8%
Production 2,008 2,046 2,001 2,026 + 1.2%
Total supply 2,347 2,457 2,451 2,493 + 1.7%
Total use 1,935 2,008 1,984 2,010 + 1.3%
of which: Food 650 666 661 672 + 1.7%
Feed 841 887 872 881 + 1.0%
Industrial 317 325 328 334 + 2.0%
Closing stocks 412 450 467 482 + 3.3%
major exporters
a)
121 144 148 160 + 8.1%
Trade (Jul/Jun) 310 322 329 319 - 3.2%
y/y
change
IGC GOI 213 + 5.3% + 0.7%
Wheat sub-Index 159 - 2.3% - 20.8%
Maize sub-Index 195 - 0.4% + 0.2%
Barley sub-Index 162 - 4.1% - 20.2%
Rice sub-Index 166 + 2.5% + 5.2%
Soyabeans sub-Index 237 + 12.6% + 14.8%
GMR 467 Change**
IGC GMR 467 – 1 July 2016
3
Wheat: GOI sub-Index
World wheat export prices were mixed during June.
Initial strong gains, linked to worries about quality
damage, were subsequently reversed on overall
favourable production prospects, with the IGC GOI sub-
Index down 2% m/m.
Maize: GOI sub-Index
The IGC GOI maize sub-Index was fractionally lower
compared to late May, as declines in US and South
American markets offset strength in Black Sea quotes.
Earlier advances were tempered by an improved US
weather outlook and stiff competition from low/medium
grade wheat. USDA’s Acreage report was bearish.
Rice: GOI sub-Index
The IGC GOI rice sub-Index posted a net gain of 2%
since the last GMR, with values in South Asia
underpinned by recent sales and prospects for fresh
demand. In Thailand, the release of state reserves was
mildly bearish, while offers in Vietnam were somewhat
mixed, with demand from traditional buyers largely
muted.
Soyabeans: GOI sub-Index
Global soyabean values advanced sharply, the IGC GOI
rising by 13%, as tightening availabilities at South
American origins and firmer demand for US old crop
supplies underpinned. Although beneficial Midwest
weather weighed, sentiment was also buoyed by
USDA’s smaller than expected official 2016/17 area
figure.
© IGC 2016
120
160
200
240
280
320
360
Jan Feb Mar Apr May Jun Jul Aug Sep Oct Nov Dec
Jan 2000 = 100
2011-15 range
2016 2015
120
160
200
240
280
320
360
Jan Feb Mar Apr May Jun Jul Aug Sep Oct Nov Dec
Jan 2000 = 100
2011-15 range
2016 2015
120
140
160
180
200
220
240
Jan Feb Mar Apr May Jun Jul Aug Sep Oct Nov Dec
Jan 2000 = 100
2011-15 range
2016 2015
120
160
200
240
280
320
360
Jan Feb Mar Apr May Jun Jul Aug Sep Oct Nov Dec
Jan 2000 = 100
2011-15 range
2016 2015
Wheat …………………………………………………………………
Durum…………………………………………………………………………
Maize…………………………………………………………………
Barley…………………………………………………………….……
Other coarse grains…………………………………………………………
Rice…………………………………………………………...………
Oilseeds………………………………………………………………
Ocean Freight Market ………………………………………………
National Policy & Other Developments……………...…………
Market Focus / Special Features
UK: Grains trade with the EU ………………………………………………
USDA Acreage report……………………………...………………………
Rice: Update on monsoon progress in India………………………………
Soyabeans: Update on Brazil's 2016/17 crop prospects ………………
Tables…………………………………………………………….……
GMR CONTENTS
SUPPLY & DEMAND: TOTAL GRAINS#
Million tons
Opening Production Imports Total Use Exports Closing
stocks supply Food Industrial Feed Total a) stocks
TOTAL GRAINS
Argentina **
2014/15 est. 7.6 54.3 0.0 62.0 5.0 2.8 14.7 24.2 27.6 10.2
2015/16 f'cast 10.2 51.8 0.0 62.1 5.0 2.8 14.4 23.8 32.3 6.0
2016/17 proj. 6.0 58.1 0.0 64.1 5.0 2.9 14.5 24.1 35.0 5.1
Australia **
2014/15 est. 5.6 35.3 0.0 41.0 2.2 0.8 7.3 11.4 24.4 5.1
2015/16 f'cast 5.1 36.7 0.0 41.9 2.2 0.8 8.2 12.2 23.9 5.8
2016/17 proj. 5.8 38.8 0.0 44.6 2.4 0.8 8.3 12.7 24.4 7.5
(5.9) (37.5) (43.5) (8.1) (12.4) (6.7)
Canada
2014/15 est. 14.9 51.4 2.0 68.3 2.9 6.3 18.2 28.8 29.1 10.4
2015/16 f'cast 10.4 53.2 1.4 65.0 2.8 6.5 18.9 29.6 27.5 7.9
2016/17 proj. 7.9 55.0 1.7 64.6 3.1 6.5 18.5 29.7 26.2 8.8
(54.7) (64.4) (8.6)
EU*
2014/15 est. 25.4 326.7 16.1 368.2 63.6 36.5 171.4 285.6 53.5 29.2
2015/16 f'cast 29.2 310.6 20.3 360.0 63.7 35.7 161.9 275.0 50.0 35.0
2016/17 proj. 35.0 311.0 15.9 361.9 63.9 36.8 162.0 278.0 48.0 35.9
(309.6) (17.8) (362.4) (163.4) (279.4) (47.8) (35.3)
Kazakhstan
2014/15 est. 2.1 16.4 0.4 18.9 2.4 0.1 4.1 9.5 6.4 3.0
2015/16 f'cast 3.0 17.5 0.1 20.6 2.4 0.1 4.3 9.2 7.7 3.6
2016/17 proj. 3.6 17.0 0.1 20.7 2.5 0.2 4.4 9.9 6.9 3.9
Russia
2014/15 est. 7.9 100.5 0.6 109.0 16.3 4.7 35.1 68.6 30.6 9.8
2015/16 f'cast 9.8 99.4 0.9 110.0 16.0 4.4 36.0 68.8 32.7 8.5
2016/17 proj. 8.5 103.3 0.8 112.6 15.8 4.4 36.4 68.8 33.2 10.6
(9.5) (100.5) (110.8) (15.7) (36.2) (68.5) (32.9) (9.5)
Ukraine
2014/15 est. 7.3 64.4 0.0 71.7 7.1 0.9 15.5 27.8 34.8 9.1
2015/16 f'cast 9.1 60.7 0.0 69.9 7.1 0.9 14.9 27.0 37.2 5.7
2016/17 proj. 5.7 58.4 0.0 64.1 7.0 0.7 13.4 25.2 32.9 6.0
(6.6) (56.6) (63.2) (13.3) (25.1) (32.0) (6.1)
USA
2014/15 est. 50.4 432.8 8.1 491.3 32.3 164.7 143.3 343.3 80.4 67.5
2015/16 f'cast 67.5 423.1 7.6 498.3 32.7 168.5 143.4 347.2 75.7 75.4
2016/17 proj. 75.4 428.1 7.2 510.7 32.8 169.6 147.3 352.2 76.6 81.9
(77.8) (425.8) (7.6) (511.2) (148.8) (353.7) (74.9) (82.7)
MAJOR EXPORTERS b)
2014/15 est. 121.2 1,081.9 27.3 1,230.3 131.8 216.9 409.6 799.2 286.8 144.3
2015/16 f'cast 144.4 1,052.9 30.3 1,227.7 131.8 219.7 401.9 792.8 286.9 147.9
2016/17 proj. 147.9 1,069.7 25.7 1,243.4 132.6 222.1 404.8 800.5 283.2 159.8
(152.4) (1059.8) (28.0) (1240.2) (132.4) (407.2) (802.6) (280.0) (157.7)
China
2014/15 est. 147.9 350.2 26.6 524.6 96.9 62.4 178.2 358.4 0.9 165.3
2015/16 f'cast 165.3 363.5 20.6 549.4 97.0 64.2 178.0 360.1 1.0 188.4
2016/17 proj. 188.4 353.7 14.7 556.8 97.3 66.3 175.0 358.5 1.2 197.1
(188.2) (354.9) (13.7) (197.2)
India
2014/15 est. 20.3 138.9 0.3 159.5 102.0 4.8 17.4 134.1 5.0 20.3
2015/16 f'cast 20.3 124.3 0.9 145.4 99.2 5.2 14.9 127.5 1.6 16.3
2016/17 proj. 16.3 131.6 1.0 149.0 102.3 5.4 15.7 133.1 1.4 14.6
WORLD TOTAL c) c)
2014/15 est. 411.7 2,045.7 322.4 2,457.3 665.9 324.7 886.8 2,007.6 322.4 449.7
2015/16 f'cast 449.7 2,001.0 329.2 2,450.7 660.6 327.6 871.9 1,983.7 329.2 467.0
2016/17 proj. 467.0 2,025.6 318.8 2,492.6 671.5 334.2 880.5 2,010.1 318.8 482.5
(467.6) (2015.5) (317.9) (2483.1) (671.0) (334.0) (881.5) (2009.4) (317.9) (473.7)
SUPPLY & DEMAND: ALL WHEAT#
Million tons
Opening Production Imports Total Use Exports Closing
stocks d) supply Food Industrial Feed Total a) d) stocks
WHEAT
Argentina (Dec/Nov)
2014/15 est. 1.7 13.9 0.0 15.6 4.5 0.1 0.4 5.7 5.4 4.5
2015/16 f'cast 4.5 11.3 0.0 15.8 4.5 0.1 1.0 6.3 8.0 1.5
2016/17 proj. 1.5 14.6 0.0 16.1 4.5 0.1 1.0 6.3 8.4 1.4
Australia (Oct/Sep)
2014/15 est. 4.9 23.1 0.0 28.0 1.9 0.5 4.0 7.1 16.6 4.4
2015/16 f'cast 4.4 24.2 0.0 28.6 1.9 0.5 3.7 6.8 17.0 4.9
2016/17 proj. 4.9 25.5 0.0 30.4 2.1 0.5 4.0 7.3 17.8 5.3
(25.0) (29.9) (4.8)
Canada (Aug/Jul)
2014/15 est. 10.4 29.4 0.1 39.8 2.6 0.9 4.4 8.9 23.9 7.1
2015/16 f'cast 7.1 27.6 0.1 34.7 2.5 0.9 4.2 8.7 22.2 3.8
2016/17 proj. 3.8 29.5 0.1 33.4 2.8 1.0 3.8 8.6 20.9 3.8
EU* (Jul/Jun)
2014/15 est. 9.5 156.1 6.2 171.8 54.5 10.8 52.2 123.8 36.2 11.7
2015/16 f'cast 11.7 159.8 6.3 177.8 54.4 10.8 54.9 126.4 34.2 17.3
2016/17 proj. 17.3 154.6 4.9 176.7 54.8 11.0 53.0 126.1 34.6 16.0
(153.6) (175.8) (52.5) (125.6) (34.4) (15.8)
of which common wheat
2014/15 est. 9.1 148.5 3.4 161.0 47.3 10.8 52.2 116.0 34.0 10.9
2015/16 f'cast 10.9 151.3 4.0 166.2 46.8 10.8 54.9 118.2 32.1 15.9
2016/17 proj. 15.9 145.7 3.1 164.6 47.1 11.0 53.0 117.7 32.6 14.4
(144.7) (163.6) (52.5) (117.2) (32.3) (14.2)
Kazakhstan (Jul/Jun)
2014/15 est. 1.7 13.0 0.4 15.1 2.2 0.0 2.0 6.8 5.9 2.4
2015/16 f'cast 2.4 13.7 0.1 16.2 2.2 0.0 2.1 6.4 6.9 2.9
2016/17 proj. 2.9 13.5 0.0 16.5 2.3 0.0 2.0 6.7 6.5 3.2
Russia (Jul/Jun)
2014/15 est. 6.1 59.1 0.4 65.6 12.9 1.5 14.0 36.6 22.2 6.9
2015/16 f'cast 6.9 61.0 0.7 68.5 13.3 1.5 14.6 37.6 24.5 6.4
2016/17 proj. 6.4 63.0 0.5 69.9 13.1 1.5 14.6 37.2 24.8 7.9
(7.4) (61.0) (68.9) (13.0) (14.5) (37.0) (24.5) (7.4)
Ukraine (Jul/Jun)
2014/15 est. 3.9 24.7 0.0 28.6 5.7 0.2 4.0 12.0 11.2 5.5
2015/16 f'cast 5.5 27.3 0.0 32.7 5.8 0.2 4.0 12.2 16.8 3.7
2016/17 proj. 3.7 23.0 0.0 26.7 5.9 0.2 4.0 12.4 10.5 3.9
(4.7) (21.5) (26.2) (9.6) (4.2)
USA (Jun/May)
2014/15 est. 16.1 55.1 4.1 75.3 25.6 0.5 3.3 31.6 23.2 20.5
2015/16 f'cast 20.5 55.8 3.3 79.6 25.7 0.5 3.8 31.8 20.5 27.3
2016/17 proj. 27.3 56.6 3.4 87.3 25.9 0.5 5.5 33.6 23.2 30.5
(54.3) (3.8) (85.4) (5.0) (33.1) (22.5) (29.8)
MAJOR EXPORTERS b)
2014/15 est. 54.2 374.5 11.2 439.9 109.9 14.4 84.4 232.4 144.6 62.8
2015/16 f'cast 62.8 380.8 10.5 454.1 110.4 14.4 88.2 236.2 150.1 67.8
2016/17 proj. 67.8 380.3 8.9 457.0 111.4 14.7 87.9 238.3 146.8 72.0
(69.7) (373.0) (9.3) (452.0) (111.3) (86.8) (237.1) (144.6) (70.4)
China (Jul/Jun)
2014/15 est. 58.7 126.2 2.1 187.1 88.0 3.2 22.0 123.4 0.2 63.4
2015/16 f'cast 63.4 130.2 2.8 196.4 88.0 3.2 18.0 119.5 0.2 76.7
2016/17 proj. 76.7 126.0 3.0 205.7 88.0 3.3 15.0 115.6 0.4 89.6
(127.4) (2.0) (206.1) (90.0)
India (Apr/Mar)
2014/15 est. 17.8 95.9 0.3 113.9 80.5 0.2 5.0 93.3 3.4 17.2
2015/16 f'cast 17.2 86.5 0.6 104.3 79.1 0.2 3.4 88.9 0.9 14.5
2016/17 proj. 14.5 90.0 1.0 105.5 81.0 0.2 4.0 92.4 0.3 12.8
WORLD TOTAL e) e)
2014/15 est. 188.4 729.6 153.4 918.0 480.5 22.0 143.3 717.4 153.4 200.6
2015/16 f'cast 200.6 735.6 158.4 936.2 482.9 21.9 144.8 719.0 158.4 217.2
2016/17 proj. 217.2 728.8 156.1 946.0 488.8 22.4 141.0 719.6 156.1 226.4
(216.8) (722.3) (153.7) (939.1) (488.5) (137.9) (716.5) (153.7) (222.6)
SUPPLY & DEMAND: MAIZE#
Million tons
Opening Production Imports Total Use Exports Closing
stocks supply Food Industrial Feed Total a) stocks
MAIZE
Argentina (Mar/Feb)
2014/15 est. 1.8 33.1 0.0 34.9 0.3 2.0 10.5 13.6 17.1 4.2
2015/16 f'cast 4.2 33.8 0.0 38.0 0.3 2.2 11.5 14.8 18.9 4.3
2016/17 proj. 4.3 31.9 0.0 36.2 0.3 2.3 10.6 13.9 20.0 2.3
2017/18 proj. 2.3 36.7 0.0 39.0 0.4 2.3 11.0 14.4 22.5 2.1
Brazil (Mar/Feb)
2014/15 est. 8.5 80.1 0.8 89.4 4.4 3.1 44.2 54.6 21.0 13.9
2015/16 f'cast 13.9 84.7 0.3 98.9 4.5 3.5 45.2 56.1 34.4 8.3
2016/17 proj. 8.3 76.0 1.5 85.8 4.5 3.6 45.7 56.5 24.3 5.1
2017/18 proj. 5.1 83.7 0.5 89.3 4.6 4.1 47.0 58.7 24.0 6.6
(3.9) (46.6) (58.1) (25.0) (6.2)
EU* (Oct/Sep)
2014/15 est. 6.6 76.2 9.4 92.2 4.2 14.1 60.1 80.9 3.9 7.3
2015/16 f'cast 7.3 58.2 13.3 78.8 4.2 13.3 49.9 69.7 1.8 7.3
2016/17 proj. 7.3 63.0 10.5 80.8 4.2 14.3 51.9 72.9 2.0 5.9
(63.7) (12.4) (83.4) (53.9) (74.9) (6.5)
South Africa (May/Apr)
2014/15 est. 0.9 15.0 0.0 15.8 5.7 0.1 5.3 11.6 2.0 2.2
2015/16 f'cast 2.2 10.6 2.0 14.8 5.4 0.1 5.8 11.8 0.7 2.3
2016/17 proj. 2.3 7.0 3.0 12.3 5.1 0.1 5.1 10.7 0.3 1.3
2017/18 proj. 1.3 12.9 0.4 14.6 5.6 0.1 5.4 11.7 1.0 1.9
Ukraine (Oct/Sep)
2014/15 est. 2.6 28.5 0.0 31.1 0.5 0.3 8.0 9.9 18.9 2.3
2015/16 f'cast 2.3 23.3 0.0 25.5 0.5 0.3 7.0 8.6 16.0 0.9
2016/17 proj. 0.9 25.5 0.0 26.4 0.3 0.2 5.9 7.0 18.5 0.9
USA (Sep/Aug) f)
2014/15 est. 31.3 361.1 0.8 393.2 5.1 160.9 135.2 301.9 47.3 44.0
2015/16 f'cast 44.0 345.5 1.5 391.0 5.2 162.1 133.4 301.2 46.4 43.4
2016/17 proj. 43.4 355.3 1.0 399.7 5.2 163.7 136.0 305.4 47.0 47.2
(45.8) (402.1) (138.0) (307.4) (46.0) (48.6)
China (Oct/Sep)
2014/15 est. 86.1 215.6 5.5 307.2 7.6 53.0 138.0 208.6 0.2 98.4
2015/16 f'cast 98.4 224.6 2.7 325.7 7.8 55.0 144.5 217.3 0.2 108.2
2016/17 proj. 108.2 219.0 1.5 328.7 8.0 57.0 149.5 224.5 0.2 104.1
(108.0) (328.5) (103.9)
Japan (Oct/Sep)
2014/15 est. 0.8 0.0 14.7 15.4 1.1 3.4 10.1 14.9 0.0 0.5
2015/16 f'cast 0.5 0.0 14.7 15.2 1.1 3.2 10.1 14.7 0.0 0.5
2016/17 proj. 0.5 0.0 14.5 15.0 1.1 3.2 9.9 14.5 0.0 0.5
WORLD TOTAL g) g)
2014/15 est. 182.1 1,018.2 125.1 1,200.3 114.2 264.5 575.7 993.4 125.1 206.8
2015/16 f'cast 206.8 969.0 129.5 1,175.8 110.6 265.9 562.4 972.2 129.5 203.6
2016/17 proj. 203.6 1,003.1 127.5 1,206.7 111.7 272.5 580.3 1,002.1 127.5 204.6
(205.1) (129.0) (1208.2) (272.3) (583.4) (1002.9) (129.0) (205.3)
#
IGC estimates. May differ from official estimates shown elsewhere in this report.
** Years shown for southern hemisphere countries include following marketing years for maize and sorghum. For example, for Argentina, the
"2013/14" year includes the 2013/14 (Dec/Nov) local marketing year for wheat and the 2014/15 (Mar/Feb) marketing year for maize.
a) Including seed and waste. f) Includes residual.
b) Argentina, Australia, Canada, EU, Kazakhstan, g) IGC July/June trade
Russia, Ukraine, United States h) Excludes trade in malt
c) Includes trade in malt. Totals may not sum due to rounding.
d) Including estimated trade in secondary products Figures in brackets represent the previous estimate.
e) IGC July/June trade: excluding trade in secondary products
SUPPLY & DEMAND: ALL RICE#
Million tons (milled basis)
Opening Production Imports Total Total Exports Closing
stocks supply use a) stocks
India (Oct/Sep)
2014/15 est. 22.0 105.5 0.1 127.6 98.7 11.8 17.1
2015/16 f'cast 17.1 103.6 0.1 120.8 100.0 9.0 11.9
2016/17 proj. 11.9 107.5 0.1 119.5 100.9 7.5 11.1
Pakistan (Nov/Oct)
2014/15 est. 0.8 6.9 0.1 7.8 2.8 3.9 1.0
2015/16 f'cast 1.0 6.7 0.1 7.8 2.9 3.9 1.0
2016/17 proj. 1.0 6.9 0.1 8.0 3.0 4.0 1.0
Thailand (Jan/Dec)
2014/15 est. 11.8 18.7 0.2 30.7 11.3 9.8 9.6
2015/16 f'cast 9.6 16.6 0.2 26.4 11.2 10.3 4.9
2016/17 proj. 4.9 20.2 0.4 25.5 11.2 11.2 3.1
USA (Aug/Jul)
2014/15 est. 1.0 7.1 0.8 8.9 4.2 3.2 1.6
2015/16 f'cast 1.6 6.1 0.8 8.4 3.9 3.5 1.1
2016/17 proj. 1.1 7.3 0.7 9.1 4.1 3.8 1.2
Vietnam (Jan/Dec)
2014/15 est. 2.1 28.8 0.4 31.3 22.1 7.0 2.2
2015/16 f'cast 2.2 28.4 0.4 31.0 21.9 7.2 1.9
2016/17 proj. 1.9 28.9 0.2 30.9 21.4 7.8 1.7
Total 5 leading exporters b)
2014/15 est. 37.8 167.0 1.5 206.3 139.0 35.7 31.5
2015/16 f'cast 31.5 161.4 1.5 194.4 139.8 33.8 20.8
2016/17 proj. 20.8 170.8 1.5 193.1 140.7 34.2 18.1
Bangladesh (Jul/Jun)
2014/15 est. 0.9 34.5 0.6 36.0 35.2 0.0 0.8
2015/16 f'cast 0.8 34.5 0.7 36.0 35.2 0.0 0.8
2016/17 proj. 0.8 34.5 1.1 36.4 35.6 0.0 0.8
China (Jan/Dec)
2014/15 est. 50.7 144.6 4.9 200.1 146.0 0.3 53.9
2015/16 f'cast 53.9 145.7 4.9 204.5 147.5 0.6 56.3
2016/17 proj. 56.3 146.3 5.0 207.6 149.3 0.6 58.1
Indonesia (Jan/Dec)
2014/15 est. 2.3 36.3 1.4 40.0 38.2 0.0 1.8
2015/16 f'cast 1.8 36.3 1.8 39.9 38.5 0.0 1.4
2016/17 proj. 1.4 37.5 1.5 40.4 39.0 0.0 1.4
Philippines (Jul/Jun)
2014/15 est. 1.8 11.9 1.8 15.5 13.2 0.0 2.3
2015/16 f'cast 2.3 11.3 1.9 15.5 13.3 0.0 2.2
2016/17 proj. 2.2 11.5 1.8 15.5 13.3 0.0 2.2
WORLD TOTAL
2014/15 est. 113.6 479.3 42.5 592.9 481.3 42.5 111.5
2015/16 f'cast 111.5 472.5 42.2 584.3 482.8 42.2 101.3
2016/17 proj. 101.3 485.6 41.8 587.0 487.6 41.8 99.3
#
IGC estimates. May differ from official estimates shown elsewhere in the report.
a) Including seed and waste. b) India, Pakistan, Thailand, United States, Vietnam.
Totals may not sum due to rounding. Figures in brackets represent the previous estimate.
SUPPLY & DEMAND: SOYABEANS#
Million tons
Opening Production Imports Total Use Exports Closing
stocks supply Food Feed Crush Total a) stocks
SOYABEANS
Argentina (Apr/Mar)
2015/16 est. 5.4 61.4 0.0 66.9 0.0 1.7 44.2 46.4 11.7 8.8
2016/17 f'cast 8.8 55.0 0.0 63.8 0.0 2.1 44.8 47.5 10.8 5.6
2017/18 proj. 5.6 56.0 0.0 61.6 0.0 2.2 45.1 47.9 8.7 5.0
Brazil (Feb/Jan)
2015/16 est. 2.2 96.2 0.3 98.7 0.1 2.7 39.5 42.5 54.6 1.6
2016/17 f'cast 1.6 95.6 0.1 97.3 0.1 3.0 38.4 41.7 55.0 0.6
2017/18 proj. 0.6 101.0 0.1 101.7 0.1 3.1 41.7 45.1 56.0 0.6
(102.0) (102.7) (3.3) (41.5) (57.0)
USA (Sep/Aug)
2014/15 est. 2.5 106.9 0.9 110.3 0.0 3.7 50.9 54.6 50.5 5.2
2015/16 f'cast 5.2 106.9 0.8 112.9 0.0 3.5 51.4 54.9 47.9 10.1
2016/17 proj. 10.1 103.5 0.8 114.4 0.0 3.5 52.1 55.6 51.7 7.1
(10.9) (115.2) (51.3) (8.3)
Total 3 major exporters b)
2014/15 est. 10.1 264.5 1.2 275.9 0.1 8.1 134.6 143.5 116.8 15.6
2015/16 f'cast 15.6 257.5 0.9 273.9 0.1 8.6 134.5 144.0 113.7 16.3
2016/17 proj. 16.3 260.5 0.9 277.7 0.1 8.7 138.9 148.5 116.4 12.7
(17.1) (261.5) (279.5) (9.0) (138.6) (148.6) (117.0) (13.9)
Canada (Sep/Aug)
2014/15 est. 0.2 6.0 0.3 6.6 0.0 0.3 1.8 2.3 3.9 0.5
2015/16 f'cast 0.5 6.2 0.3 7.0 0.0 0.3 1.9 2.4 4.2 0.4
2016/17 proj. 0.4 5.4 0.3 6.1 0.0 0.3 1.7 2.2 3.5 0.4
(6.0) (0.3)
Ukraine (Sep/Aug)
2014/15 est. 0.3 3.9 0.0 4.1 0.0 0.2 1.3 1.5 2.4 0.2
2015/16 f'cast 0.2 3.8 0.0 4.0 0.0 0.1 1.5 1.6 2.2 0.1
2016/17 proj. 0.1 4.4 0.0 4.5 0.0 0.1 1.9 2.0 2.4 0.1
(4.5) (4.6) (0.2)
Paraguay (Mar/Feb)
2015/16 est. 0.4 8.1 0.0 8.5 0.0 0.2 3.3 3.7 4.5 0.4
2016/17 f'cast 0.4 8.8 0.0 9.2 0.0 0.2 4.0 4.3 4.6 0.3
2017/18 proj. 0.3 8.9 0.0 9.2 0.0 0.2 4.0 4.3 4.6 0.4
China (Oct/Sep)
2014/15 est. 12.0 12.2 80.1 104.3 10.3 2.5 77.0 90.3 0.0 14.0
2015/16 f'cast 14.0 11.6 84.0 109.6 11.3 2.4 82.8 96.9 0.2 12.4
2016/17 proj. 12.4 12.6 87.5 112.5 11.7 2.7 87.5 102.3 0.2 10.0
(12.0) (111.9) (11.5) (102.2) (9.5)
EU* (Oct/Sep)
2014/15 est. 0.6 1.9 13.5 16.0 0.2 0.9 13.7 14.8 0.1 1.0
2015/16 f'cast 1.0 2.2 13.3 16.5 0.2 0.8 14.5 15.5 0.1 0.9
2016/17 proj. 0.9 2.1 13.0 16.0 0.2 0.9 13.8 14.8 0.1 1.0
India (Oct/Sep)
2014/15 est. 0.7 10.4 0.0 11.1 0.3 0.7 9.6 10.5 0.2 0.3
2015/16 f'cast 0.3 9.1 0.0 9.5 0.2 0.4 8.7 9.2 0.1 0.2
2016/17 proj. 0.2 11.2 0.0 11.4 0.4 0.6 10.1 11.1 0.2 0.2
Japan (Oct/Sep)
2014/15 est. 0.2 0.2 3.1 3.5 0.8 0.2 2.3 3.3 0.0 0.2
2015/16 f'cast 0.2 0.2 3.1 3.5 0.8 0.2 2.3 3.3 0.0 0.2
2016/17 proj. 0.2 0.2 3.1 3.6 0.8 0.2 2.4 3.3 0.0 0.2
WORLD TOTAL c) c)
2014/15 est. 28.6 320.4 126.8 349.0 16.3 16.7 276.6 311.2 126.8 37.8
2015/16 f'cast 37.8 312.3 130.2 350.1 17.4 16.5 281.7 317.4 130.2 32.7
2016/17 proj. 32.7 319.6 133.2 352.3 18.0 17.0 287.8 324.5 133.2 27.8
(33.5) (320.0) (353.5) (17.8) (17.2) (288.2) (324.9) (28.6)
#
IGC estimates. May differ from official estimates shown elsewhere in the report.
a) Including seed and waste.
b) Argentina, Brazil, USA
c) IGC October/September trade
Totals may not sum due to rounding Figures in brackets represent the previous estimate.

More Related Content

Similar to Marketing-Report-Template

Sugar: World Markets and Trade
Sugar: World Markets and Trade Sugar: World Markets and Trade
Sugar: World Markets and Trade André Oliveira
 
14th july (tuesday), 2015 daily exclusive oryza rice e newsletter by riceplus...
14th july (tuesday), 2015 daily exclusive oryza rice e newsletter by riceplus...14th july (tuesday), 2015 daily exclusive oryza rice e newsletter by riceplus...
14th july (tuesday), 2015 daily exclusive oryza rice e newsletter by riceplus...Riceplus Magazine
 
Epic research daily agri report 07th may 2015
Epic research daily agri report  07th may  2015Epic research daily agri report  07th may  2015
Epic research daily agri report 07th may 2015Epic Research Limited
 
Daily livestock report mar 26 2013
Daily livestock report mar 26 2013Daily livestock report mar 26 2013
Daily livestock report mar 26 2013joseleorcasita
 
Relatório USDA - setembro de 2014
Relatório USDA - setembro de 2014Relatório USDA - setembro de 2014
Relatório USDA - setembro de 2014Portal Canal Rural
 
Usda report march 2013
Usda report march 2013Usda report march 2013
Usda report march 2013joseleorcasita
 
1st september,2015 daily global regional local rice e newsletter by riceplus ...
1st september,2015 daily global regional local rice e newsletter by riceplus ...1st september,2015 daily global regional local rice e newsletter by riceplus ...
1st september,2015 daily global regional local rice e newsletter by riceplus ...Riceplus Magazine
 

Similar to Marketing-Report-Template (20)

Sugar: World Markets and Trade
Sugar: World Markets and Trade Sugar: World Markets and Trade
Sugar: World Markets and Trade
 
Commodities - MARKETS OUTLOOK
Commodities - MARKETS OUTLOOKCommodities - MARKETS OUTLOOK
Commodities - MARKETS OUTLOOK
 
Commodities - MARKETS OUTLOOK
Commodities - MARKETS OUTLOOKCommodities - MARKETS OUTLOOK
Commodities - MARKETS OUTLOOK
 
USDA update Dec 2016
USDA update Dec 2016USDA update Dec 2016
USDA update Dec 2016
 
14th july (tuesday), 2015 daily exclusive oryza rice e newsletter by riceplus...
14th july (tuesday), 2015 daily exclusive oryza rice e newsletter by riceplus...14th july (tuesday), 2015 daily exclusive oryza rice e newsletter by riceplus...
14th july (tuesday), 2015 daily exclusive oryza rice e newsletter by riceplus...
 
2009 07 Usda Wasde
2009 07 Usda Wasde2009 07 Usda Wasde
2009 07 Usda Wasde
 
Soybean update sep2016
Soybean update sep2016Soybean update sep2016
Soybean update sep2016
 
9. Ontario Commodity Market Situation and Outlook
9. Ontario Commodity Market Situation and Outlook9. Ontario Commodity Market Situation and Outlook
9. Ontario Commodity Market Situation and Outlook
 
Commodities - MARKETS OUTLOOK
Commodities - MARKETS OUTLOOKCommodities - MARKETS OUTLOOK
Commodities - MARKETS OUTLOOK
 
Soyoil update Dec2016
Soyoil update Dec2016Soyoil update Dec2016
Soyoil update Dec2016
 
Cotton update oct2016
Cotton update oct2016Cotton update oct2016
Cotton update oct2016
 
Epic research daily agri report 07th may 2015
Epic research daily agri report  07th may  2015Epic research daily agri report  07th may  2015
Epic research daily agri report 07th may 2015
 
Mustard update nov2016
Mustard update nov2016Mustard update nov2016
Mustard update nov2016
 
USDA Report May 2012
USDA Report May 2012USDA Report May 2012
USDA Report May 2012
 
Daily livestock report mar 26 2013
Daily livestock report mar 26 2013Daily livestock report mar 26 2013
Daily livestock report mar 26 2013
 
Relatório USDA - setembro de 2014
Relatório USDA - setembro de 2014Relatório USDA - setembro de 2014
Relatório USDA - setembro de 2014
 
Usda report march 2013
Usda report march 2013Usda report march 2013
Usda report march 2013
 
1st september,2015 daily global regional local rice e newsletter by riceplus ...
1st september,2015 daily global regional local rice e newsletter by riceplus ...1st september,2015 daily global regional local rice e newsletter by riceplus ...
1st september,2015 daily global regional local rice e newsletter by riceplus ...
 
1st september,2015 daily global regional local rice e newsletter by riceplus ...
1st september,2015 daily global regional local rice e newsletter by riceplus ...1st september,2015 daily global regional local rice e newsletter by riceplus ...
1st september,2015 daily global regional local rice e newsletter by riceplus ...
 
USDA - Novembro 2014
USDA - Novembro 2014USDA - Novembro 2014
USDA - Novembro 2014
 

Recently uploaded

ASO Process: What is App Store Optimization
ASO Process: What is App Store OptimizationASO Process: What is App Store Optimization
ASO Process: What is App Store OptimizationAli Raza
 
The Pitfalls of Keyword Stuffing in SEO Copywriting
The Pitfalls of Keyword Stuffing in SEO CopywritingThe Pitfalls of Keyword Stuffing in SEO Copywriting
The Pitfalls of Keyword Stuffing in SEO CopywritingJuan Pineda
 
pptx.marketing strategy of tanishq. pptx
pptx.marketing strategy of tanishq. pptxpptx.marketing strategy of tanishq. pptx
pptx.marketing strategy of tanishq. pptxarsathsahil
 
VIP Call Girls In Green Park 9654467111 Escorts Service
VIP Call Girls In Green Park 9654467111 Escorts ServiceVIP Call Girls In Green Park 9654467111 Escorts Service
VIP Call Girls In Green Park 9654467111 Escorts ServiceSapana Sha
 
DGR_Digital Advertising Strategies for a Cookieless World_Presentation.pdf
DGR_Digital Advertising Strategies for a Cookieless World_Presentation.pdfDGR_Digital Advertising Strategies for a Cookieless World_Presentation.pdf
DGR_Digital Advertising Strategies for a Cookieless World_Presentation.pdfDemandbase
 
Best Persuasive selling skills presentation.pptx
Best Persuasive selling skills  presentation.pptxBest Persuasive selling skills  presentation.pptx
Best Persuasive selling skills presentation.pptxMasterPhil1
 
Omnichannel Marketing: Defining Omnichannel Marketing
Omnichannel Marketing: Defining Omnichannel MarketingOmnichannel Marketing: Defining Omnichannel Marketing
Omnichannel Marketing: Defining Omnichannel MarketingDove Soft Ltd
 
Influencer Marketing Power point presentation
Influencer Marketing  Power point presentationInfluencer Marketing  Power point presentation
Influencer Marketing Power point presentationdgtivemarketingagenc
 
Digital Marketing Spotlight: Lifecycle Advertising Strategies.pdf
Digital Marketing Spotlight: Lifecycle Advertising Strategies.pdfDigital Marketing Spotlight: Lifecycle Advertising Strategies.pdf
Digital Marketing Spotlight: Lifecycle Advertising Strategies.pdfDemandbase
 
The Impact of Digital Technologies
The Impact of Digital Technologies The Impact of Digital Technologies
The Impact of Digital Technologies bruguardarib
 
Forecast of Content Marketing through AI
Forecast of Content Marketing through AIForecast of Content Marketing through AI
Forecast of Content Marketing through AIRinky
 
What are the 4 characteristics of CTAs that convert?
What are the 4 characteristics of CTAs that convert?What are the 4 characteristics of CTAs that convert?
What are the 4 characteristics of CTAs that convert?Juan Pineda
 
DIGITAL MARKETING COURSE IN BTM -Influencer Marketing Strategy
DIGITAL MARKETING COURSE IN BTM -Influencer Marketing StrategyDIGITAL MARKETING COURSE IN BTM -Influencer Marketing Strategy
DIGITAL MARKETING COURSE IN BTM -Influencer Marketing StrategySouvikRay24
 
Red bull marketing presentation pptxxxxx
Red bull marketing presentation pptxxxxxRed bull marketing presentation pptxxxxx
Red bull marketing presentation pptxxxxx216310017
 
Cost-effective tactics for navigating CPC surges
Cost-effective tactics for navigating CPC surgesCost-effective tactics for navigating CPC surges
Cost-effective tactics for navigating CPC surgesPushON Ltd
 
BrightonSEO - Addressing SEO & CX - CMDL - Apr 24 .pptx
BrightonSEO -  Addressing SEO & CX - CMDL - Apr 24 .pptxBrightonSEO -  Addressing SEO & CX - CMDL - Apr 24 .pptx
BrightonSEO - Addressing SEO & CX - CMDL - Apr 24 .pptxcollette15
 
Snapshot of Consumer Behaviors of March 2024-EOLiSurvey (EN).pdf
Snapshot of Consumer Behaviors of March 2024-EOLiSurvey (EN).pdfSnapshot of Consumer Behaviors of March 2024-EOLiSurvey (EN).pdf
Snapshot of Consumer Behaviors of March 2024-EOLiSurvey (EN).pdfEastern Online-iSURVEY
 
定制(ULV毕业证书)拉文大学毕业证成绩单原版一比一
定制(ULV毕业证书)拉文大学毕业证成绩单原版一比一定制(ULV毕业证书)拉文大学毕业证成绩单原版一比一
定制(ULV毕业证书)拉文大学毕业证成绩单原版一比一s SS
 
Local SEO Domination: Put your business at the forefront of local searches!
Local SEO Domination:  Put your business at the forefront of local searches!Local SEO Domination:  Put your business at the forefront of local searches!
Local SEO Domination: Put your business at the forefront of local searches!dstvtechnician
 
TAM AdEx 2023 Cross Media Advertising Recap - Auto Sector
TAM AdEx 2023 Cross Media Advertising Recap - Auto SectorTAM AdEx 2023 Cross Media Advertising Recap - Auto Sector
TAM AdEx 2023 Cross Media Advertising Recap - Auto SectorSocial Samosa
 

Recently uploaded (20)

ASO Process: What is App Store Optimization
ASO Process: What is App Store OptimizationASO Process: What is App Store Optimization
ASO Process: What is App Store Optimization
 
The Pitfalls of Keyword Stuffing in SEO Copywriting
The Pitfalls of Keyword Stuffing in SEO CopywritingThe Pitfalls of Keyword Stuffing in SEO Copywriting
The Pitfalls of Keyword Stuffing in SEO Copywriting
 
pptx.marketing strategy of tanishq. pptx
pptx.marketing strategy of tanishq. pptxpptx.marketing strategy of tanishq. pptx
pptx.marketing strategy of tanishq. pptx
 
VIP Call Girls In Green Park 9654467111 Escorts Service
VIP Call Girls In Green Park 9654467111 Escorts ServiceVIP Call Girls In Green Park 9654467111 Escorts Service
VIP Call Girls In Green Park 9654467111 Escorts Service
 
DGR_Digital Advertising Strategies for a Cookieless World_Presentation.pdf
DGR_Digital Advertising Strategies for a Cookieless World_Presentation.pdfDGR_Digital Advertising Strategies for a Cookieless World_Presentation.pdf
DGR_Digital Advertising Strategies for a Cookieless World_Presentation.pdf
 
Best Persuasive selling skills presentation.pptx
Best Persuasive selling skills  presentation.pptxBest Persuasive selling skills  presentation.pptx
Best Persuasive selling skills presentation.pptx
 
Omnichannel Marketing: Defining Omnichannel Marketing
Omnichannel Marketing: Defining Omnichannel MarketingOmnichannel Marketing: Defining Omnichannel Marketing
Omnichannel Marketing: Defining Omnichannel Marketing
 
Influencer Marketing Power point presentation
Influencer Marketing  Power point presentationInfluencer Marketing  Power point presentation
Influencer Marketing Power point presentation
 
Digital Marketing Spotlight: Lifecycle Advertising Strategies.pdf
Digital Marketing Spotlight: Lifecycle Advertising Strategies.pdfDigital Marketing Spotlight: Lifecycle Advertising Strategies.pdf
Digital Marketing Spotlight: Lifecycle Advertising Strategies.pdf
 
The Impact of Digital Technologies
The Impact of Digital Technologies The Impact of Digital Technologies
The Impact of Digital Technologies
 
Forecast of Content Marketing through AI
Forecast of Content Marketing through AIForecast of Content Marketing through AI
Forecast of Content Marketing through AI
 
What are the 4 characteristics of CTAs that convert?
What are the 4 characteristics of CTAs that convert?What are the 4 characteristics of CTAs that convert?
What are the 4 characteristics of CTAs that convert?
 
DIGITAL MARKETING COURSE IN BTM -Influencer Marketing Strategy
DIGITAL MARKETING COURSE IN BTM -Influencer Marketing StrategyDIGITAL MARKETING COURSE IN BTM -Influencer Marketing Strategy
DIGITAL MARKETING COURSE IN BTM -Influencer Marketing Strategy
 
Red bull marketing presentation pptxxxxx
Red bull marketing presentation pptxxxxxRed bull marketing presentation pptxxxxx
Red bull marketing presentation pptxxxxx
 
Cost-effective tactics for navigating CPC surges
Cost-effective tactics for navigating CPC surgesCost-effective tactics for navigating CPC surges
Cost-effective tactics for navigating CPC surges
 
BrightonSEO - Addressing SEO & CX - CMDL - Apr 24 .pptx
BrightonSEO -  Addressing SEO & CX - CMDL - Apr 24 .pptxBrightonSEO -  Addressing SEO & CX - CMDL - Apr 24 .pptx
BrightonSEO - Addressing SEO & CX - CMDL - Apr 24 .pptx
 
Snapshot of Consumer Behaviors of March 2024-EOLiSurvey (EN).pdf
Snapshot of Consumer Behaviors of March 2024-EOLiSurvey (EN).pdfSnapshot of Consumer Behaviors of March 2024-EOLiSurvey (EN).pdf
Snapshot of Consumer Behaviors of March 2024-EOLiSurvey (EN).pdf
 
定制(ULV毕业证书)拉文大学毕业证成绩单原版一比一
定制(ULV毕业证书)拉文大学毕业证成绩单原版一比一定制(ULV毕业证书)拉文大学毕业证成绩单原版一比一
定制(ULV毕业证书)拉文大学毕业证成绩单原版一比一
 
Local SEO Domination: Put your business at the forefront of local searches!
Local SEO Domination:  Put your business at the forefront of local searches!Local SEO Domination:  Put your business at the forefront of local searches!
Local SEO Domination: Put your business at the forefront of local searches!
 
TAM AdEx 2023 Cross Media Advertising Recap - Auto Sector
TAM AdEx 2023 Cross Media Advertising Recap - Auto SectorTAM AdEx 2023 Cross Media Advertising Recap - Auto Sector
TAM AdEx 2023 Cross Media Advertising Recap - Auto Sector
 

Marketing-Report-Template

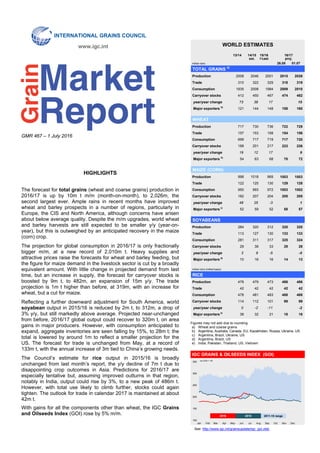
  • 1. GMR 467 – 1 July 2016 HIGHLIGHTS The forecast for total grains (wheat and coarse grains) production in 2016/17 is up by 10m t m/m (month-on-month), to 2,026m, the second largest ever. Ample rains in recent months have improved wheat and barley prospects in a number of regions, particularly in Europe, the CIS and North America, although concerns have arisen about below average quality. Despite the m/m upgrades, world wheat and barley harvests are still expected to be smaller y/y (year-on- year), but this is outweighed by an anticipated recovery in the maize (corn) crop. The projection for global consumption in 2016/17 is only fractionally bigger m/m, at a new record of 2,010m t. Heavy supplies and attractive prices raise the forecasts for wheat and barley feeding, but the figure for maize demand in the livestock sector is cut by a broadly equivalent amount. With little change in projected demand from last time, but an increase in supply, the forecast for carryover stocks is boosted by 9m t, to 482m, an expansion of 15m y/y. The trade projection is 1m t higher than before, at 319m, with an increase for wheat, but a cut for maize. Reflecting a further downward adjustment for South America, world soyabean output in 2015/16 is reduced by 2m t, to 312m, a drop of 3% y/y, but still markedly above average. Projected near-unchanged from before, 2016/17 global output could recover to 320m t, on area gains in major producers. However, with consumption anticipated to expand, aggregate inventories are seen falling by 15%, to 28m t; the total is lowered by around 1m to reflect a smaller projection for the US. The forecast for trade is unchanged from May, at a record of 133m t, with the annual increase of 3m tied to China’s growing needs. The Council’s estimate for rice output in 2015/16 is broadly unchanged from last month’s report, the y/y decline of 7m t due to disappointing crop outcomes in Asia. Predictions for 2016/17 are especially tentative but, assuming improved outturns in that region, notably in India, output could rise by 3%, to a new peak of 486m t. However, with total use likely to climb further, stocks could again tighten. The outlook for trade in calendar 2017 is maintained at about 42m t. With gains for all the components other than wheat, the IGC Grains and Oilseeds Index (GOI) rose by 5% m/m. Figures may not add due to rounding a) Wheat and coarse grains b) Argentina, Australia, Canada, EU, Kazakhstan, Russia, Ukraine, US c) Argentina, Brazil, Ukraine, US d) Argentina, Brazil, US e) India, Pakistan, Thailand, US, Vietnam See: http://www.igc.int/grainsupdate/igc_goi.xlsb 13/14 14/15 15/16 est. f'cast million tons 26.05 01.07 Production 2008 2046 2001 2015 2026 Trade 310 322 329 318 319 Consumption 1935 2008 1984 2009 2010 Carryover stocks 412 450 467 474 482 year/year change 73 38 17 15 Major exporters b) 121 144 148 158 160 Production 717 730 736 722 729 Trade 157 153 158 154 156 Consumption 699 717 719 717 720 Carryover stocks 188 201 217 223 226 year/year change 19 12 17 9 Major exporters b) 54 63 68 70 72 Production 998 1018 969 1003 1003 Trade 122 125 130 129 128 Consumption 950 993 972 1003 1002 Carryover stocks 182 207 204 205 205 year/year change 48 25 -3 1 Major exporters c) 52 59 52 58 57 Production 284 320 312 320 320 Trade 113 127 130 133 133 Consumption 281 311 317 325 324 Carryover stocks 29 38 33 29 28 year/year change 3 9 -5 -5 Major exporters d) 10 16 16 14 13 million tons (milled basis) Production 478 479 473 486 486 Trade 42 42 42 42 42 Consumption 478 481 483 488 488 Carryover stocks 114 112 101 99 99 year/year change 0 -2 -11 -2 Major exporters e) 38 32 21 18 18 16/17 proj. WORLD ESTIMATES RICE SOYABEANS TOTAL GRAINS a) WHEAT MAIZE (CORN) 100 150 200 250 300 350 Jan Feb Mar Apr May Jun Jul Aug Sep Oct Nov Dec Jan 2000 = 100 2011-15 range 2016 2015 IGC GRAINS & OILSEEDS INDEX (GOI) INTERNATIONAL GRAINS COUNCIL www.igc.int Grain Market Report
  • 2. GMR 467 – 1 July 2016 IGC 2 OVERVIEW  Grains production in 2016/17 is expected to be the second highest ever and, given record opening stocks, total supply will be a new peak.  With increases for food, feed and industrial uses, consumption will likely be an all-time high.  Led by accumulations in the major exporters and China, grains stocks are expected to expand to their largest ever level. Lower shipments to China contribute to a predicted drop in world trade.  Assuming market conditions encourage area gains in major producers, 2016/17 soyabean output could match the record of two years earlier.  The 2016/17 global rice outturn is seen at a new peak on improved crops in Asia, notably India. Total grains: Supply and demand summary a) Argentina, Australia, Canada, EU, Kazakhstan, Russia, Ukraine, US Global total grains (wheat and coarse grains) production in 2016/17 is expected to surpass 2bn t for the fourth consecutive year. While wheat and barley harvests may not match the high levels of the year before, the maize outturn is projected to post a solid recovery from the three-year low in 2015/16. Although still placed lower y/y, prospects for wheat production continue to improve, but the wet finish to the growing season in several countries will likely have a negative impact on average quality. Grains consumption will probably be a new peak, fuelled by gains for food, feed and industrial uses. Amid heavy supplies, attractively-priced wheat is capturing some feed demand from alternatives, including maize, although use of the latter is still seen at its highest ever. Despite record consumption, grains carryover stocks will likely climb again at the end of 2016/17, including accumulations in the major exporters and China. World grains trade in 2016/17 is forecast to fall moderately from the previous season’s record. China, in particular, is seen being a smaller buyer, as government measures aimed at encouraging greater use of local maize will likely cut its imports of barley and sorghum. The Council’s 2015/16 global soyabean crop estimate is downgraded by 2m t, to 312m, to reflect a lower figure for Brazil, linked to smaller than anticipated yields. Prospects for 2016/17 are highly tentative given that fieldwork in South America will not begin until September. But assuming some area expansion in key producers, output could recover and match the 2014/15 peak of 320m t. Underpinned by demand for soyabean products, consumption is seen expanding further, resulting in another season of tightening stocks. At 27.8m t, inventories are projected to contract by 15% y/y, including a sharp decline in the major exporters. Trade is expected to reach a new high in 2016/17 on continued growth in China’s protein meal requirements. Rapeseed/canola output in 2016/17 is likely to fall for the third consecutive year and, despite a retreat in total use, carryovers are expected to decrease by around one-quarter y/y. Reflecting a reduced global crop and rising consumption, 2015/16 end-season inventories of rice are set to drop by 9%, to 101m t, mostly explained by a heavy contraction in leading exporters. World production in 2016/17 is predicted to reach a new high, but much will depend on weather conditions in Asia’s main producers, especially India, where the ongoing monsoon will be crucial in shaping prospects. However, with uptake seen at a record, stocks could again fall, to 99m t. The outlook for trade will, as in all years, hinge on demand from buyers in sub-Saharan Africa and Asia. MARKET SUMMARY Driven almost entirely by a further surge in soyabean export prices, and with rice quotations slightly firmer, the IGC GOI increased by a net 5% since late May. Overall advances were trimmed by seasonal pressure in the northern hemisphere, where harvesting of large winter wheat and barley crops is now underway, as well as a slight m/m weakening in average maize values. Grains and oilseeds quotations generally retreated from earlier highs on improved US Midwest weather forecasts and mostly favourable global production prospects. Turbulence on world financial and currency markets following the UK referendum vote also affected prices, especially wheat, late in the month. IGC Grains & Oilseeds Prices Index (GOI)* *Jan 2000=100, **Change vs. GMR 466 m t 13/14 14/15 15/16 16/17 y/y (est.) (f'cast) (proj.) change Opening stocks 339 412 450 467 + 3.8% Production 2,008 2,046 2,001 2,026 + 1.2% Total supply 2,347 2,457 2,451 2,493 + 1.7% Total use 1,935 2,008 1,984 2,010 + 1.3% of which: Food 650 666 661 672 + 1.7% Feed 841 887 872 881 + 1.0% Industrial 317 325 328 334 + 2.0% Closing stocks 412 450 467 482 + 3.3% major exporters a) 121 144 148 160 + 8.1% Trade (Jul/Jun) 310 322 329 319 - 3.2% y/y change IGC GOI 213 + 5.3% + 0.7% Wheat sub-Index 159 - 2.3% - 20.8% Maize sub-Index 195 - 0.4% + 0.2% Barley sub-Index 162 - 4.1% - 20.2% Rice sub-Index 166 + 2.5% + 5.2% Soyabeans sub-Index 237 + 12.6% + 14.8% GMR 467 Change**
  • 3. IGC GMR 467 – 1 July 2016 3 Wheat: GOI sub-Index World wheat export prices were mixed during June. Initial strong gains, linked to worries about quality damage, were subsequently reversed on overall favourable production prospects, with the IGC GOI sub- Index down 2% m/m. Maize: GOI sub-Index The IGC GOI maize sub-Index was fractionally lower compared to late May, as declines in US and South American markets offset strength in Black Sea quotes. Earlier advances were tempered by an improved US weather outlook and stiff competition from low/medium grade wheat. USDA’s Acreage report was bearish. Rice: GOI sub-Index The IGC GOI rice sub-Index posted a net gain of 2% since the last GMR, with values in South Asia underpinned by recent sales and prospects for fresh demand. In Thailand, the release of state reserves was mildly bearish, while offers in Vietnam were somewhat mixed, with demand from traditional buyers largely muted. Soyabeans: GOI sub-Index Global soyabean values advanced sharply, the IGC GOI rising by 13%, as tightening availabilities at South American origins and firmer demand for US old crop supplies underpinned. Although beneficial Midwest weather weighed, sentiment was also buoyed by USDA’s smaller than expected official 2016/17 area figure. © IGC 2016 120 160 200 240 280 320 360 Jan Feb Mar Apr May Jun Jul Aug Sep Oct Nov Dec Jan 2000 = 100 2011-15 range 2016 2015 120 160 200 240 280 320 360 Jan Feb Mar Apr May Jun Jul Aug Sep Oct Nov Dec Jan 2000 = 100 2011-15 range 2016 2015 120 140 160 180 200 220 240 Jan Feb Mar Apr May Jun Jul Aug Sep Oct Nov Dec Jan 2000 = 100 2011-15 range 2016 2015 120 160 200 240 280 320 360 Jan Feb Mar Apr May Jun Jul Aug Sep Oct Nov Dec Jan 2000 = 100 2011-15 range 2016 2015 Wheat ………………………………………………………………… Durum………………………………………………………………………… Maize………………………………………………………………… Barley…………………………………………………………….…… Other coarse grains………………………………………………………… Rice…………………………………………………………...……… Oilseeds……………………………………………………………… Ocean Freight Market ……………………………………………… National Policy & Other Developments……………...………… Market Focus / Special Features UK: Grains trade with the EU ……………………………………………… USDA Acreage report……………………………...……………………… Rice: Update on monsoon progress in India……………………………… Soyabeans: Update on Brazil's 2016/17 crop prospects ……………… Tables…………………………………………………………….…… GMR CONTENTS
  • 4. SUPPLY & DEMAND: TOTAL GRAINS# Million tons Opening Production Imports Total Use Exports Closing stocks supply Food Industrial Feed Total a) stocks TOTAL GRAINS Argentina ** 2014/15 est. 7.6 54.3 0.0 62.0 5.0 2.8 14.7 24.2 27.6 10.2 2015/16 f'cast 10.2 51.8 0.0 62.1 5.0 2.8 14.4 23.8 32.3 6.0 2016/17 proj. 6.0 58.1 0.0 64.1 5.0 2.9 14.5 24.1 35.0 5.1 Australia ** 2014/15 est. 5.6 35.3 0.0 41.0 2.2 0.8 7.3 11.4 24.4 5.1 2015/16 f'cast 5.1 36.7 0.0 41.9 2.2 0.8 8.2 12.2 23.9 5.8 2016/17 proj. 5.8 38.8 0.0 44.6 2.4 0.8 8.3 12.7 24.4 7.5 (5.9) (37.5) (43.5) (8.1) (12.4) (6.7) Canada 2014/15 est. 14.9 51.4 2.0 68.3 2.9 6.3 18.2 28.8 29.1 10.4 2015/16 f'cast 10.4 53.2 1.4 65.0 2.8 6.5 18.9 29.6 27.5 7.9 2016/17 proj. 7.9 55.0 1.7 64.6 3.1 6.5 18.5 29.7 26.2 8.8 (54.7) (64.4) (8.6) EU* 2014/15 est. 25.4 326.7 16.1 368.2 63.6 36.5 171.4 285.6 53.5 29.2 2015/16 f'cast 29.2 310.6 20.3 360.0 63.7 35.7 161.9 275.0 50.0 35.0 2016/17 proj. 35.0 311.0 15.9 361.9 63.9 36.8 162.0 278.0 48.0 35.9 (309.6) (17.8) (362.4) (163.4) (279.4) (47.8) (35.3) Kazakhstan 2014/15 est. 2.1 16.4 0.4 18.9 2.4 0.1 4.1 9.5 6.4 3.0 2015/16 f'cast 3.0 17.5 0.1 20.6 2.4 0.1 4.3 9.2 7.7 3.6 2016/17 proj. 3.6 17.0 0.1 20.7 2.5 0.2 4.4 9.9 6.9 3.9 Russia 2014/15 est. 7.9 100.5 0.6 109.0 16.3 4.7 35.1 68.6 30.6 9.8 2015/16 f'cast 9.8 99.4 0.9 110.0 16.0 4.4 36.0 68.8 32.7 8.5 2016/17 proj. 8.5 103.3 0.8 112.6 15.8 4.4 36.4 68.8 33.2 10.6 (9.5) (100.5) (110.8) (15.7) (36.2) (68.5) (32.9) (9.5) Ukraine 2014/15 est. 7.3 64.4 0.0 71.7 7.1 0.9 15.5 27.8 34.8 9.1 2015/16 f'cast 9.1 60.7 0.0 69.9 7.1 0.9 14.9 27.0 37.2 5.7 2016/17 proj. 5.7 58.4 0.0 64.1 7.0 0.7 13.4 25.2 32.9 6.0 (6.6) (56.6) (63.2) (13.3) (25.1) (32.0) (6.1) USA 2014/15 est. 50.4 432.8 8.1 491.3 32.3 164.7 143.3 343.3 80.4 67.5 2015/16 f'cast 67.5 423.1 7.6 498.3 32.7 168.5 143.4 347.2 75.7 75.4 2016/17 proj. 75.4 428.1 7.2 510.7 32.8 169.6 147.3 352.2 76.6 81.9 (77.8) (425.8) (7.6) (511.2) (148.8) (353.7) (74.9) (82.7) MAJOR EXPORTERS b) 2014/15 est. 121.2 1,081.9 27.3 1,230.3 131.8 216.9 409.6 799.2 286.8 144.3 2015/16 f'cast 144.4 1,052.9 30.3 1,227.7 131.8 219.7 401.9 792.8 286.9 147.9 2016/17 proj. 147.9 1,069.7 25.7 1,243.4 132.6 222.1 404.8 800.5 283.2 159.8 (152.4) (1059.8) (28.0) (1240.2) (132.4) (407.2) (802.6) (280.0) (157.7) China 2014/15 est. 147.9 350.2 26.6 524.6 96.9 62.4 178.2 358.4 0.9 165.3 2015/16 f'cast 165.3 363.5 20.6 549.4 97.0 64.2 178.0 360.1 1.0 188.4 2016/17 proj. 188.4 353.7 14.7 556.8 97.3 66.3 175.0 358.5 1.2 197.1 (188.2) (354.9) (13.7) (197.2) India 2014/15 est. 20.3 138.9 0.3 159.5 102.0 4.8 17.4 134.1 5.0 20.3 2015/16 f'cast 20.3 124.3 0.9 145.4 99.2 5.2 14.9 127.5 1.6 16.3 2016/17 proj. 16.3 131.6 1.0 149.0 102.3 5.4 15.7 133.1 1.4 14.6 WORLD TOTAL c) c) 2014/15 est. 411.7 2,045.7 322.4 2,457.3 665.9 324.7 886.8 2,007.6 322.4 449.7 2015/16 f'cast 449.7 2,001.0 329.2 2,450.7 660.6 327.6 871.9 1,983.7 329.2 467.0 2016/17 proj. 467.0 2,025.6 318.8 2,492.6 671.5 334.2 880.5 2,010.1 318.8 482.5 (467.6) (2015.5) (317.9) (2483.1) (671.0) (334.0) (881.5) (2009.4) (317.9) (473.7)
  • 5. SUPPLY & DEMAND: ALL WHEAT# Million tons Opening Production Imports Total Use Exports Closing stocks d) supply Food Industrial Feed Total a) d) stocks WHEAT Argentina (Dec/Nov) 2014/15 est. 1.7 13.9 0.0 15.6 4.5 0.1 0.4 5.7 5.4 4.5 2015/16 f'cast 4.5 11.3 0.0 15.8 4.5 0.1 1.0 6.3 8.0 1.5 2016/17 proj. 1.5 14.6 0.0 16.1 4.5 0.1 1.0 6.3 8.4 1.4 Australia (Oct/Sep) 2014/15 est. 4.9 23.1 0.0 28.0 1.9 0.5 4.0 7.1 16.6 4.4 2015/16 f'cast 4.4 24.2 0.0 28.6 1.9 0.5 3.7 6.8 17.0 4.9 2016/17 proj. 4.9 25.5 0.0 30.4 2.1 0.5 4.0 7.3 17.8 5.3 (25.0) (29.9) (4.8) Canada (Aug/Jul) 2014/15 est. 10.4 29.4 0.1 39.8 2.6 0.9 4.4 8.9 23.9 7.1 2015/16 f'cast 7.1 27.6 0.1 34.7 2.5 0.9 4.2 8.7 22.2 3.8 2016/17 proj. 3.8 29.5 0.1 33.4 2.8 1.0 3.8 8.6 20.9 3.8 EU* (Jul/Jun) 2014/15 est. 9.5 156.1 6.2 171.8 54.5 10.8 52.2 123.8 36.2 11.7 2015/16 f'cast 11.7 159.8 6.3 177.8 54.4 10.8 54.9 126.4 34.2 17.3 2016/17 proj. 17.3 154.6 4.9 176.7 54.8 11.0 53.0 126.1 34.6 16.0 (153.6) (175.8) (52.5) (125.6) (34.4) (15.8) of which common wheat 2014/15 est. 9.1 148.5 3.4 161.0 47.3 10.8 52.2 116.0 34.0 10.9 2015/16 f'cast 10.9 151.3 4.0 166.2 46.8 10.8 54.9 118.2 32.1 15.9 2016/17 proj. 15.9 145.7 3.1 164.6 47.1 11.0 53.0 117.7 32.6 14.4 (144.7) (163.6) (52.5) (117.2) (32.3) (14.2) Kazakhstan (Jul/Jun) 2014/15 est. 1.7 13.0 0.4 15.1 2.2 0.0 2.0 6.8 5.9 2.4 2015/16 f'cast 2.4 13.7 0.1 16.2 2.2 0.0 2.1 6.4 6.9 2.9 2016/17 proj. 2.9 13.5 0.0 16.5 2.3 0.0 2.0 6.7 6.5 3.2 Russia (Jul/Jun) 2014/15 est. 6.1 59.1 0.4 65.6 12.9 1.5 14.0 36.6 22.2 6.9 2015/16 f'cast 6.9 61.0 0.7 68.5 13.3 1.5 14.6 37.6 24.5 6.4 2016/17 proj. 6.4 63.0 0.5 69.9 13.1 1.5 14.6 37.2 24.8 7.9 (7.4) (61.0) (68.9) (13.0) (14.5) (37.0) (24.5) (7.4) Ukraine (Jul/Jun) 2014/15 est. 3.9 24.7 0.0 28.6 5.7 0.2 4.0 12.0 11.2 5.5 2015/16 f'cast 5.5 27.3 0.0 32.7 5.8 0.2 4.0 12.2 16.8 3.7 2016/17 proj. 3.7 23.0 0.0 26.7 5.9 0.2 4.0 12.4 10.5 3.9 (4.7) (21.5) (26.2) (9.6) (4.2) USA (Jun/May) 2014/15 est. 16.1 55.1 4.1 75.3 25.6 0.5 3.3 31.6 23.2 20.5 2015/16 f'cast 20.5 55.8 3.3 79.6 25.7 0.5 3.8 31.8 20.5 27.3 2016/17 proj. 27.3 56.6 3.4 87.3 25.9 0.5 5.5 33.6 23.2 30.5 (54.3) (3.8) (85.4) (5.0) (33.1) (22.5) (29.8) MAJOR EXPORTERS b) 2014/15 est. 54.2 374.5 11.2 439.9 109.9 14.4 84.4 232.4 144.6 62.8 2015/16 f'cast 62.8 380.8 10.5 454.1 110.4 14.4 88.2 236.2 150.1 67.8 2016/17 proj. 67.8 380.3 8.9 457.0 111.4 14.7 87.9 238.3 146.8 72.0 (69.7) (373.0) (9.3) (452.0) (111.3) (86.8) (237.1) (144.6) (70.4) China (Jul/Jun) 2014/15 est. 58.7 126.2 2.1 187.1 88.0 3.2 22.0 123.4 0.2 63.4 2015/16 f'cast 63.4 130.2 2.8 196.4 88.0 3.2 18.0 119.5 0.2 76.7 2016/17 proj. 76.7 126.0 3.0 205.7 88.0 3.3 15.0 115.6 0.4 89.6 (127.4) (2.0) (206.1) (90.0) India (Apr/Mar) 2014/15 est. 17.8 95.9 0.3 113.9 80.5 0.2 5.0 93.3 3.4 17.2 2015/16 f'cast 17.2 86.5 0.6 104.3 79.1 0.2 3.4 88.9 0.9 14.5 2016/17 proj. 14.5 90.0 1.0 105.5 81.0 0.2 4.0 92.4 0.3 12.8 WORLD TOTAL e) e) 2014/15 est. 188.4 729.6 153.4 918.0 480.5 22.0 143.3 717.4 153.4 200.6 2015/16 f'cast 200.6 735.6 158.4 936.2 482.9 21.9 144.8 719.0 158.4 217.2 2016/17 proj. 217.2 728.8 156.1 946.0 488.8 22.4 141.0 719.6 156.1 226.4 (216.8) (722.3) (153.7) (939.1) (488.5) (137.9) (716.5) (153.7) (222.6)
  • 6. SUPPLY & DEMAND: MAIZE# Million tons Opening Production Imports Total Use Exports Closing stocks supply Food Industrial Feed Total a) stocks MAIZE Argentina (Mar/Feb) 2014/15 est. 1.8 33.1 0.0 34.9 0.3 2.0 10.5 13.6 17.1 4.2 2015/16 f'cast 4.2 33.8 0.0 38.0 0.3 2.2 11.5 14.8 18.9 4.3 2016/17 proj. 4.3 31.9 0.0 36.2 0.3 2.3 10.6 13.9 20.0 2.3 2017/18 proj. 2.3 36.7 0.0 39.0 0.4 2.3 11.0 14.4 22.5 2.1 Brazil (Mar/Feb) 2014/15 est. 8.5 80.1 0.8 89.4 4.4 3.1 44.2 54.6 21.0 13.9 2015/16 f'cast 13.9 84.7 0.3 98.9 4.5 3.5 45.2 56.1 34.4 8.3 2016/17 proj. 8.3 76.0 1.5 85.8 4.5 3.6 45.7 56.5 24.3 5.1 2017/18 proj. 5.1 83.7 0.5 89.3 4.6 4.1 47.0 58.7 24.0 6.6 (3.9) (46.6) (58.1) (25.0) (6.2) EU* (Oct/Sep) 2014/15 est. 6.6 76.2 9.4 92.2 4.2 14.1 60.1 80.9 3.9 7.3 2015/16 f'cast 7.3 58.2 13.3 78.8 4.2 13.3 49.9 69.7 1.8 7.3 2016/17 proj. 7.3 63.0 10.5 80.8 4.2 14.3 51.9 72.9 2.0 5.9 (63.7) (12.4) (83.4) (53.9) (74.9) (6.5) South Africa (May/Apr) 2014/15 est. 0.9 15.0 0.0 15.8 5.7 0.1 5.3 11.6 2.0 2.2 2015/16 f'cast 2.2 10.6 2.0 14.8 5.4 0.1 5.8 11.8 0.7 2.3 2016/17 proj. 2.3 7.0 3.0 12.3 5.1 0.1 5.1 10.7 0.3 1.3 2017/18 proj. 1.3 12.9 0.4 14.6 5.6 0.1 5.4 11.7 1.0 1.9 Ukraine (Oct/Sep) 2014/15 est. 2.6 28.5 0.0 31.1 0.5 0.3 8.0 9.9 18.9 2.3 2015/16 f'cast 2.3 23.3 0.0 25.5 0.5 0.3 7.0 8.6 16.0 0.9 2016/17 proj. 0.9 25.5 0.0 26.4 0.3 0.2 5.9 7.0 18.5 0.9 USA (Sep/Aug) f) 2014/15 est. 31.3 361.1 0.8 393.2 5.1 160.9 135.2 301.9 47.3 44.0 2015/16 f'cast 44.0 345.5 1.5 391.0 5.2 162.1 133.4 301.2 46.4 43.4 2016/17 proj. 43.4 355.3 1.0 399.7 5.2 163.7 136.0 305.4 47.0 47.2 (45.8) (402.1) (138.0) (307.4) (46.0) (48.6) China (Oct/Sep) 2014/15 est. 86.1 215.6 5.5 307.2 7.6 53.0 138.0 208.6 0.2 98.4 2015/16 f'cast 98.4 224.6 2.7 325.7 7.8 55.0 144.5 217.3 0.2 108.2 2016/17 proj. 108.2 219.0 1.5 328.7 8.0 57.0 149.5 224.5 0.2 104.1 (108.0) (328.5) (103.9) Japan (Oct/Sep) 2014/15 est. 0.8 0.0 14.7 15.4 1.1 3.4 10.1 14.9 0.0 0.5 2015/16 f'cast 0.5 0.0 14.7 15.2 1.1 3.2 10.1 14.7 0.0 0.5 2016/17 proj. 0.5 0.0 14.5 15.0 1.1 3.2 9.9 14.5 0.0 0.5 WORLD TOTAL g) g) 2014/15 est. 182.1 1,018.2 125.1 1,200.3 114.2 264.5 575.7 993.4 125.1 206.8 2015/16 f'cast 206.8 969.0 129.5 1,175.8 110.6 265.9 562.4 972.2 129.5 203.6 2016/17 proj. 203.6 1,003.1 127.5 1,206.7 111.7 272.5 580.3 1,002.1 127.5 204.6 (205.1) (129.0) (1208.2) (272.3) (583.4) (1002.9) (129.0) (205.3) # IGC estimates. May differ from official estimates shown elsewhere in this report. ** Years shown for southern hemisphere countries include following marketing years for maize and sorghum. For example, for Argentina, the "2013/14" year includes the 2013/14 (Dec/Nov) local marketing year for wheat and the 2014/15 (Mar/Feb) marketing year for maize. a) Including seed and waste. f) Includes residual. b) Argentina, Australia, Canada, EU, Kazakhstan, g) IGC July/June trade Russia, Ukraine, United States h) Excludes trade in malt c) Includes trade in malt. Totals may not sum due to rounding. d) Including estimated trade in secondary products Figures in brackets represent the previous estimate. e) IGC July/June trade: excluding trade in secondary products
  • 7. SUPPLY & DEMAND: ALL RICE# Million tons (milled basis) Opening Production Imports Total Total Exports Closing stocks supply use a) stocks India (Oct/Sep) 2014/15 est. 22.0 105.5 0.1 127.6 98.7 11.8 17.1 2015/16 f'cast 17.1 103.6 0.1 120.8 100.0 9.0 11.9 2016/17 proj. 11.9 107.5 0.1 119.5 100.9 7.5 11.1 Pakistan (Nov/Oct) 2014/15 est. 0.8 6.9 0.1 7.8 2.8 3.9 1.0 2015/16 f'cast 1.0 6.7 0.1 7.8 2.9 3.9 1.0 2016/17 proj. 1.0 6.9 0.1 8.0 3.0 4.0 1.0 Thailand (Jan/Dec) 2014/15 est. 11.8 18.7 0.2 30.7 11.3 9.8 9.6 2015/16 f'cast 9.6 16.6 0.2 26.4 11.2 10.3 4.9 2016/17 proj. 4.9 20.2 0.4 25.5 11.2 11.2 3.1 USA (Aug/Jul) 2014/15 est. 1.0 7.1 0.8 8.9 4.2 3.2 1.6 2015/16 f'cast 1.6 6.1 0.8 8.4 3.9 3.5 1.1 2016/17 proj. 1.1 7.3 0.7 9.1 4.1 3.8 1.2 Vietnam (Jan/Dec) 2014/15 est. 2.1 28.8 0.4 31.3 22.1 7.0 2.2 2015/16 f'cast 2.2 28.4 0.4 31.0 21.9 7.2 1.9 2016/17 proj. 1.9 28.9 0.2 30.9 21.4 7.8 1.7 Total 5 leading exporters b) 2014/15 est. 37.8 167.0 1.5 206.3 139.0 35.7 31.5 2015/16 f'cast 31.5 161.4 1.5 194.4 139.8 33.8 20.8 2016/17 proj. 20.8 170.8 1.5 193.1 140.7 34.2 18.1 Bangladesh (Jul/Jun) 2014/15 est. 0.9 34.5 0.6 36.0 35.2 0.0 0.8 2015/16 f'cast 0.8 34.5 0.7 36.0 35.2 0.0 0.8 2016/17 proj. 0.8 34.5 1.1 36.4 35.6 0.0 0.8 China (Jan/Dec) 2014/15 est. 50.7 144.6 4.9 200.1 146.0 0.3 53.9 2015/16 f'cast 53.9 145.7 4.9 204.5 147.5 0.6 56.3 2016/17 proj. 56.3 146.3 5.0 207.6 149.3 0.6 58.1 Indonesia (Jan/Dec) 2014/15 est. 2.3 36.3 1.4 40.0 38.2 0.0 1.8 2015/16 f'cast 1.8 36.3 1.8 39.9 38.5 0.0 1.4 2016/17 proj. 1.4 37.5 1.5 40.4 39.0 0.0 1.4 Philippines (Jul/Jun) 2014/15 est. 1.8 11.9 1.8 15.5 13.2 0.0 2.3 2015/16 f'cast 2.3 11.3 1.9 15.5 13.3 0.0 2.2 2016/17 proj. 2.2 11.5 1.8 15.5 13.3 0.0 2.2 WORLD TOTAL 2014/15 est. 113.6 479.3 42.5 592.9 481.3 42.5 111.5 2015/16 f'cast 111.5 472.5 42.2 584.3 482.8 42.2 101.3 2016/17 proj. 101.3 485.6 41.8 587.0 487.6 41.8 99.3 # IGC estimates. May differ from official estimates shown elsewhere in the report. a) Including seed and waste. b) India, Pakistan, Thailand, United States, Vietnam. Totals may not sum due to rounding. Figures in brackets represent the previous estimate.
  • 8. SUPPLY & DEMAND: SOYABEANS# Million tons Opening Production Imports Total Use Exports Closing stocks supply Food Feed Crush Total a) stocks SOYABEANS Argentina (Apr/Mar) 2015/16 est. 5.4 61.4 0.0 66.9 0.0 1.7 44.2 46.4 11.7 8.8 2016/17 f'cast 8.8 55.0 0.0 63.8 0.0 2.1 44.8 47.5 10.8 5.6 2017/18 proj. 5.6 56.0 0.0 61.6 0.0 2.2 45.1 47.9 8.7 5.0 Brazil (Feb/Jan) 2015/16 est. 2.2 96.2 0.3 98.7 0.1 2.7 39.5 42.5 54.6 1.6 2016/17 f'cast 1.6 95.6 0.1 97.3 0.1 3.0 38.4 41.7 55.0 0.6 2017/18 proj. 0.6 101.0 0.1 101.7 0.1 3.1 41.7 45.1 56.0 0.6 (102.0) (102.7) (3.3) (41.5) (57.0) USA (Sep/Aug) 2014/15 est. 2.5 106.9 0.9 110.3 0.0 3.7 50.9 54.6 50.5 5.2 2015/16 f'cast 5.2 106.9 0.8 112.9 0.0 3.5 51.4 54.9 47.9 10.1 2016/17 proj. 10.1 103.5 0.8 114.4 0.0 3.5 52.1 55.6 51.7 7.1 (10.9) (115.2) (51.3) (8.3) Total 3 major exporters b) 2014/15 est. 10.1 264.5 1.2 275.9 0.1 8.1 134.6 143.5 116.8 15.6 2015/16 f'cast 15.6 257.5 0.9 273.9 0.1 8.6 134.5 144.0 113.7 16.3 2016/17 proj. 16.3 260.5 0.9 277.7 0.1 8.7 138.9 148.5 116.4 12.7 (17.1) (261.5) (279.5) (9.0) (138.6) (148.6) (117.0) (13.9) Canada (Sep/Aug) 2014/15 est. 0.2 6.0 0.3 6.6 0.0 0.3 1.8 2.3 3.9 0.5 2015/16 f'cast 0.5 6.2 0.3 7.0 0.0 0.3 1.9 2.4 4.2 0.4 2016/17 proj. 0.4 5.4 0.3 6.1 0.0 0.3 1.7 2.2 3.5 0.4 (6.0) (0.3) Ukraine (Sep/Aug) 2014/15 est. 0.3 3.9 0.0 4.1 0.0 0.2 1.3 1.5 2.4 0.2 2015/16 f'cast 0.2 3.8 0.0 4.0 0.0 0.1 1.5 1.6 2.2 0.1 2016/17 proj. 0.1 4.4 0.0 4.5 0.0 0.1 1.9 2.0 2.4 0.1 (4.5) (4.6) (0.2) Paraguay (Mar/Feb) 2015/16 est. 0.4 8.1 0.0 8.5 0.0 0.2 3.3 3.7 4.5 0.4 2016/17 f'cast 0.4 8.8 0.0 9.2 0.0 0.2 4.0 4.3 4.6 0.3 2017/18 proj. 0.3 8.9 0.0 9.2 0.0 0.2 4.0 4.3 4.6 0.4 China (Oct/Sep) 2014/15 est. 12.0 12.2 80.1 104.3 10.3 2.5 77.0 90.3 0.0 14.0 2015/16 f'cast 14.0 11.6 84.0 109.6 11.3 2.4 82.8 96.9 0.2 12.4 2016/17 proj. 12.4 12.6 87.5 112.5 11.7 2.7 87.5 102.3 0.2 10.0 (12.0) (111.9) (11.5) (102.2) (9.5) EU* (Oct/Sep) 2014/15 est. 0.6 1.9 13.5 16.0 0.2 0.9 13.7 14.8 0.1 1.0 2015/16 f'cast 1.0 2.2 13.3 16.5 0.2 0.8 14.5 15.5 0.1 0.9 2016/17 proj. 0.9 2.1 13.0 16.0 0.2 0.9 13.8 14.8 0.1 1.0 India (Oct/Sep) 2014/15 est. 0.7 10.4 0.0 11.1 0.3 0.7 9.6 10.5 0.2 0.3 2015/16 f'cast 0.3 9.1 0.0 9.5 0.2 0.4 8.7 9.2 0.1 0.2 2016/17 proj. 0.2 11.2 0.0 11.4 0.4 0.6 10.1 11.1 0.2 0.2 Japan (Oct/Sep) 2014/15 est. 0.2 0.2 3.1 3.5 0.8 0.2 2.3 3.3 0.0 0.2 2015/16 f'cast 0.2 0.2 3.1 3.5 0.8 0.2 2.3 3.3 0.0 0.2 2016/17 proj. 0.2 0.2 3.1 3.6 0.8 0.2 2.4 3.3 0.0 0.2 WORLD TOTAL c) c) 2014/15 est. 28.6 320.4 126.8 349.0 16.3 16.7 276.6 311.2 126.8 37.8 2015/16 f'cast 37.8 312.3 130.2 350.1 17.4 16.5 281.7 317.4 130.2 32.7 2016/17 proj. 32.7 319.6 133.2 352.3 18.0 17.0 287.8 324.5 133.2 27.8 (33.5) (320.0) (353.5) (17.8) (17.2) (288.2) (324.9) (28.6) # IGC estimates. May differ from official estimates shown elsewhere in the report. a) Including seed and waste. b) Argentina, Brazil, USA c) IGC October/September trade Totals may not sum due to rounding Figures in brackets represent the previous estimate.