More Related Content
Similar to Daily livestock report dec 12 2012
Similar to Daily livestock report dec 12 2012 (11)
More from joseleorcasita (20)
Daily livestock report dec 12 2012
- 1. Vol. 10, No. 240 / December 12, 2012
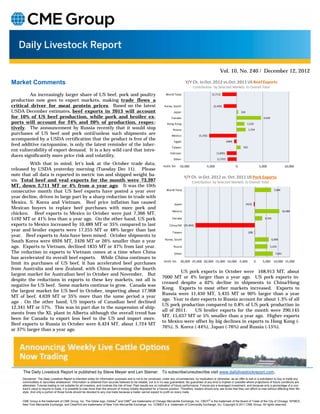
Market Comments Y/Y Ch. in Oct. 2012 vs.Oct. 2011 US Beef Exports
Contribution by Selected Markets to Overall Total
An increasingly larger share of US beef, pork and poultry World Total (2,711)
production now goes to export markets, making trade flows a
critical driver for meat protein prices. Based on the latest Korea, South (2,426)
USDA December estimates, beef exports in 2013 will account Japan 324
for 10% of US beef production, while pork and broiler ex- Canada 4,639
ports will account for 24% and 20% of production, respec- Hong Kong 1,510
tively. The announcement by Russia recently that it would stop Russia 1,724
purchases of US beef and pork until/unless such shipments are Mexico (5,192)
accompanied by a USDA certification that the product is free of the Egypt (480)
feed additive ractopamine, is only the latest reminder of the inher-
Taiwan 763
ent vulnerability of export demand. It is a key wild card that intro-
Vietnam (1,835)
duces significantly more price risk and volatility.
Other (1,737)
With that in mind, let’s look at the October trade data, metric ton ‐10,000 ‐5,000 0 5,000 10,000
released by USDA yesterday morning (Tuesday Dec 11). Please
note that all data is reported in metric ton and shipped weight ba-
Y/Y Ch. in Oct. 2012 vs. Oct. 2011 US Pork Exports
sis. Total beef and veal exports for the month were 73,397 Contribution by Selected Markets to Overall Total
MT, down 2,711 MT or 4% from a year ago. It was the 10th
consecutive month that US beef exports have posted a year over World Total 7,004
year decline, driven in large part by a sharp reduction in trade with
Mexico, S. Korea and Vietnam. Beef price inflation has caused Japan (422)
Mexican buyers to replace beef purchases with more pork and
Mexico 10,489
chicken. Beef exports to Mexico in October were just 7,366 MT,
5192 MT or 41% less than a year ago. On the other hand, US pork Canada 3,193
exports to Mexico increased by 10,489 MT or 35% compared to last China/HK (25,363)
year and broiler exports were 17,255 MT or 48% larger than last Taiwan (28)
year. Beef exports to Asia have been mixed. October shipments to
South Korea were 6926 MT, 2426 MT or 26% smaller than a year Korea, South 6,009
ago. Exports to Vietnam, declined 1835 MT or 47% from last year. Russia 5,435
The reduction in exports to Vietnam comes at a time when China Other 7,691
has accelerated its overall beef exports. While China continues to
metric ton ‐30,000 ‐25,000 ‐20,000 ‐15,000 ‐10,000 ‐5,000 0 5,000 10,000 15,000
limit its purchases of US beef, it has accelerated beef purchases
from Australia and new Zealand, with China becoming the fourth
US pork exports in October were 168,913 MT, about
largest market for Australian beef in October and November. But
7000 MT or 4% larger than a year ago. US pork exports in-
despite the reductions in exports to these key markets, not all is
creased despite a 62% decline in shipments to China/Hong
negative for US beef. Some markets continue to grow. Canada was
Kong. Exports to most other markets increased. Exports to
the largest market for US beef in October, importing about 17,968
Russia were 11,450 MT, 5,435 MT or 90% larger than a year
MT of beef, 4,639 MT or 35% more than the same period a year
ago. Year to date exports to Russia account for about 1.3% of all
ago . On the other hand, US imports of Canadian beef declined
US pork production compared to 0.8% of US pork production in
12,341 MT or 57%. This was in part due to the suspension of ship-
all of 2011. US broiler exports for the month were 290,145
ments from the XL plant in Alberta although the overall trend has
MT, 15,637 MT or 5% smaller than a year ago. Higher exports
been for Canada to export less beef to the US and import more.
to Mexico were offset by big declines in exports to Hong Kong (-
Beef exports to Russia in October were 6,424 MT, about 1,724 MT
76%), S. Korea (-44%), Japan (-76%) and Russia (-15%).
or 37% larger than a year ago.
The Daily Livestock Report is published by Steve Meyer and Len Steiner. To subscribe/unsubscribe visit www.dailylivestockreport.com.
Disclaimer: The Daily Livestock Report is intended solely for information purposes and is not to be construed, under any circumstances, by implication or otherwise, as an offer to sell or a solicitation to buy or trade any
commodities or securities whatsoever. Information is obtained from sources believed to be reliable, but is in no way guaranteed. No guarantee of any kind is implied or possible where projections of future conditions are
attempted. Futures trading is not suitable for all investors, and involves the risk of loss. Past results are no indication of future performance. Futures are a leveraged investment, and because only a percentage of a con-
tract’s value is require to trade, it is possible to lose more than the amount of money initially deposited for a futures position. Therefore, traders should only use funds that they can afford to lose without affecting their life-
style. And only a portion of those funds should be devoted to any one trade because a trader cannot expect to profit on every trade.
CME Group is the trademark of CME Group, Inc. The Globe logo, Globex® and CME® are trademarks of Chicago Mercantile Exchange, Inc. CBOT® is the trademark of the Board of Trade of the City of Chicago. NYMEX,
New York Mercantile Exchange, and ClearPort are trademarks of New York Mercantile Exchange. Inc. COMEX is a trademark of Commodity Exchange, Inc. Copyright © 2011 CME Group. All rights reserved.