Fed actions stabilize markets but risks remain in private mortgage sector
•
0 likes•117 views

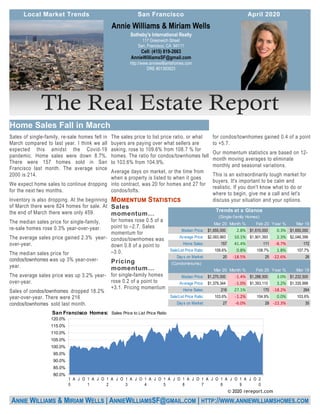
Sales of single-family, re-sale homes fell in March compared to last year. I think we all expected this amidst the Covid-19 pandemic. Home sales were down 8.7%. There were 157 homes sold in San Francisco last month. The average since 2000 is 214.

Recommended
Recommended
More Related Content
What's hot
What's hot (20)
Similar to Fed actions stabilize markets but risks remain in private mortgage sector
Similar to Fed actions stabilize markets but risks remain in private mortgage sector (20)
Recently uploaded
Recently uploaded (20)
Fed actions stabilize markets but risks remain in private mortgage sector
- 1. for condos/townhomes gained 0.4 of a point to +5.7. Our momentum statistics are based on 12- month moving averages to eliminate monthly and seasonal variations. This is an extraordinarily tough market for buyers. It's important to be calm and realistic. If you don't know what to do or where to begin, give me a call and let's discuss your situation and your options. Sales of single-family, re-sale homes fell in March compared to last year. I think we all expected this amidst the Covid-19 pandemic. Home sales were down 8.7%. There were 157 homes sold in San Francisco last month. The average since 2000 is 214. We expect home sales to continue dropping for the next two months. Inventory is also dropping. At the beginning of March there were 824 homes for sale. At the end of March there were only 459. The median sales price for single-family, re-sale homes rose 0.3% year-over-year. The average sales price gained 2.3% year- over-year. The median sales price for condos/townhomes was up 3% year-over- year. The average sales price was up 3.2% year- over-year. Sales of condos/townhomes dropped 18.2% year-over-year. There were 216 condos/townhomes sold last month. The sales price to list price ratio, or what buyers are paying over what sellers are asking, rose to 109.6% from 108.7 % for homes. The ratio for condos/townhomes fell to 103.6% from 104.9%. Average days on market, or the time from when a property is listed to when it goes into contract, was 20 for homes and 27 for condos/lofts. for homes rose 0.5 of a point to –2.7. Sales momentum for condos/townhomes was down 0.8 of a point to –3.0. for single-family homes rose 0.2 of a point to +3.1. Pricing momentum Sotheby's International Realty 117 Greenwich Street San, Francisco, CA 94111 Cell: (415) 819-2663 AnnieWilliamsSF@gmail.com http://www.anniewilliamshomes.com DRE #01393923 Annie Williams & Miriam Wells ANNIE WILLIAMS & MIRIAM WELLS | ANNIEWILLIAMSSF@GMAIL.COM | HTTP://WWW.ANNIEWILLIAMSHOMES.COM Mar 20 Month % Feb 20 Year % Mar 19 Median Price: 1,655,000$ 2.8% 1,610,000$ 0.3% 1,650,000$ Average Price: 2,093,993$ 10.1% 1,901,393$ 2.3% 2,046,399$ Home Sales: 157 41.4% 111 -8.7% 172 Sale/List Price Ratio: 109.6% 0.8% 108.7% 1.8% 107.7% Days on Market: 20 -18.5% 25 -22.6% 26 (Condominiums) Mar 20 Month % Feb 20 Year % Mar 19 Median Price: 1,270,000$ -1.4% 1,288,500$ 3.0% 1,232,500$ Average Price: 1,379,344$ -1.0% 1,393,110$ 3.2% 1,335,998$ Home Sales: 216 27.1% 170 -18.2% 264 Sale/List Price Ratio: 103.6% -1.2% 104.9% 0.0% 103.6% Days on Market: 27 -6.0% 29 -22.3% 35 Trends at a Glance (Single-family Homes) 80.0% 85.0% 90.0% 95.0% 100.0% 105.0% 110.0% 115.0% 120.0% 1 0 A J O 1 1 A J O 1 2 A J O 1 3 A J O 1 4 A J O 1 5 A J O 1 6 A J O 1 7 A J O 1 8 A J O 1 9 A J O 2 0 San Francisco Homes: Sales Price to List Price Ratio © 2020 rereport.com
- 2. Mar. 27, 2020 -- The first signs of the effects of the shutdown of broad regions and wide swaths of the economy showed this week, even as the Federal Reserve and federal government moved to improve the functioning of financial markets and try to amelio- rate the damage of a hard stop for most economic activity. Last week, the Federal Reserve announced a re-start of QE programs to buy up Treasuries and MBS -- $500 billion and $200 billion, respectively. After the Fed ran through much of that cash in just the fire few days of the program, markets began to seize up again as investors continued a mad dash to sell hold- ings and rush to cash. Likely fearing another terrible opening for the financial markets on Monday morn- ing, the Fed announced it would have no limits on how many Treasuries or MBS it would purchase, saying "The Federal Reserve will continue to pur- chase Treasury securities and agency mortgage- backed securities in the amounts needed to support smooth market functioning and effective transmission of monetary policy to broader financial conditions." This reassured investors that there would be a pur- chaser in the markets for these instruments regard- less of price or yield, and did finally seem to have the desired effect. Interest rates began to settle; the yield on the 10-year Treasury was as high as 1.26% last Thursday, but closed on Friday at about 0.68%. Stock markets rallied starting Tuesday as the shape of the $2 trillion stimulus bill began to show, but fad- ed on Friday. The selloff did show that markets were functioning more normally -- stocks selling off led to bond buys, driving yields down. In recent weeks, both stocks and bonds were being liquidated, so stock prices were falling and bond yields were rising. Suffice it to say that the Fed actions are a virtual firehose of liquidity aimed at as many facets of the financial markets as the Fed can reach. It seems very likely that if stress shows someplace else, the Fed will look to quickly address it. One such place might be seen in our own backyard, so to speak, for while government-engineered or -backed mortgage mar- kets remain functional, private mortgage markets for non-QM loans remain largely closed and jumbo mort- gages somewhat more difficult to come by. In recent weeks, investors have shunned risk, and there certainly can be plenty of risk in making money available to mortgage lenders who are making loans without government backing to borrowers. As such, funding for these kinds of loans has dried up; at the (Continued on page 4) ANNIE WILLIAMS & MIRIAM WELLS SOTHEBY'S INTERNATIONAL REALTY ANNIEWILLIAMSSF@GMAIL.COM DRE #01393923 The chart above shows the National month- ly average for 30-year fixed rate mortgages as compiled by http:// 3.0% 4.0% 5.0% 6.0% 01-10 07-10 01-11 07-11 01-12 07-12 01-13 07-13 01-14 07-14 01-15 07-15 01-16 07-16 01-17 07-17 01-18 07-18 01-19 07-19 01-20 30-Year Fixed Mortgage Rates Unit Median Average Sales DOM SP/LP Median Average Sales Median Average Sales San Francisco $1,655,000 $2,093,993 157 20 109.6% 0.3% 2.3% -8.7% 2.8% 10.1% 41.4% D1: Northwest $2,350,000 $2,450,892 12 13 108.8% 9.3% -9.8% -20.0% 11.9% 3.5% -47.8% D2: Central West $1,500,000 $1,483,750 16 24 123.6% -6.4% -11.5% -50.0% 1.7% -4.0% -5.9% D3: Southwest $1,150,000 $1,250,132 9 21 113.5% 0.0% 8.6% 50.0% -25.8% -9.2% 28.6% D4: Twin Peaks $1,940,000 $2,098,990 25 15 112.5% 20.9% 25.0% 0.0% -4.8% 10.2% 78.6% D5: Central $2,687,000 $2,670,560 24 21 110.0% 21.7% 9.5% -20.0% 13.1% 0.4% 140.0% D6: Central North $2,190,000 $2,556,250 4 6 105.6% -38.7% -28.2% -20.0% -0.5% 0.1% 0.0% D7: North $4,412,500 $5,050,900 10 34 95.5% -15.1% 0.4% 25.0% 0.9% 15.4% 400.0% D8: Northeast $3,850,000 $3,850,000 1 44 102.7% n/a n/a n/a 281.2% 281.2% 0.0% D9: Central East $1,550,000 $1,704,876 19 25 112.7% -9.0% -9.8% 35.7% -8.4% -11.5% 58.3% D10: Southeast $1,207,500 $1,230,318 22 20 114.9% 5.5% 8.6% -31.3% 3.6% 6.3% 4.8% March Sales Statistics (Single-family Homes) Prices Yearly Change Monthly Change 0 50 100 150 200 250 300 350 $300 $800 $1,300 $1,800 $2,300 1 0 MM J S N 1 1 MM J S N 1 2 MM J S N 1 3 MM J S N 1 4 MM J S N 1 5 MM J S N 1 6 MM J S N 1 7 MM J S N 1 8 MM J S N 1 9 MM J S N 2 0 M San Francisco Homes: Sold Prices & Unit Sales (3-month moving average — $000's) Ave Med Units © 2020 rereport.com
- 3. ANNIE WILLIAMS & MIRIAM WELLS SOTHEBY'S INTERNATIONAL REALTY ANNIEWILLIAMSSF@GMAIL.COM DRE #01393923 Unit Median Average Sales DOM SP/LP Median Average Sales Median Average Sales San Francisco $1,270,000 $1,379,344 216 27 103.6% 3.0% 3.2% -18.2% -1.4% -1.0% 27.1% D1: Northwest $1,602,500 $1,624,400 10 32 103.7% 23.3% 12.9% -28.6% 23.3% 28.1% 42.9% D2: Central West $1,070,000 $1,049,000 5 19 101.3% -24.9% -25.5% 66.7% -20.7% -25.1% 25.0% D3: Southwest $875,000 $875,000 1 88 97.2% -14.4% -14.4% -50.0% -34.0% -34.0% 0.0% D4: Twin Peaks $625,000 $517,556 5 63 102.6% -16.8% -34.1% 25.0% 30.7% 8.2% 150.0% D5: Central $1,425,000 $1,382,471 34 22 109.7% 0.0% -6.1% 6.3% 3.6% 0.4% 54.5% D6: Central North $1,365,000 $1,362,518 17 18 109.0% 30.2% 23.4% -34.6% -3.4% -7.3% 6.3% D7: North $1,640,000 $1,890,333 15 26 101.6% 6.4% 9.3% -63.4% -18.4% -1.9% -37.5% D8: Northeast $1,212,500 $1,441,397 34 24 100.9% 12.8% -0.4% -2.9% -3.8% -0.6% 17.2% D9: Central East $1,250,000 $1,341,749 91 29 102.1% 5.5% 9.2% 8.3% 5.5% 6.9% 59.6% D10: Southeast $860,000 $839,500 4 49 102.8% 27.3% 19.0% -50.0% 13.9% 4.7% -50.0% March Sales Statistics (Condos/TICs/Co-ops/Lofts) Prices Yearly Change Monthly Change 80.0% 85.0% 90.0% 95.0% 100.0% 105.0% 110.0% 115.0% 120.0% 1 0 A J O 1 1 A J O 1 2 A J O 1 3 A J O 1 4 A J O 1 5 A J O 1 6 A J O 1 7 A J O 1 8 A J O 1 9 A J O 2 0 San Francisco Homes: Sales Price to List Price Ratio © 2020 rereport.com -50.0 -40.0 -30.0 -20.0 -10.0 0.0 10.0 20.0 30.0 40.0 0 6 MM J SN 0 7 MM J SN 0 8 MM J SN 0 9 MM J SN 1 0 MM J SN 1 1 MM J SN 1 2 MM J SN 1 3 MM J SN 1 4 MM J SN 1 5 MM J SN 1 6 MM J SN 1 7 MM J SN 1 8 MM J SN 1 9 MM J SN 2 0 M San Francisco Condos/Lofts: SalesMomentum Sales Pricing © 2020 rereport.com 0 50 100 150 200 250 300 350 $300 $500 $700 $900 $1,100 $1,300 $1,500 1 0 MM J S N 1 1 MM J S N 1 2 MM J S N 1 3 MM J S N 1 4 MM J S N 1 5 MM J S N 1 6 MM J S N 1 7 MM J S N 1 8 MM J S N 1 9 MM J S N 2 0 M San Francisco Condos: Sold Prices & Unit Sales (3-month moving average — $000's) Ave Med Units © 2020 rereport.com
- 4. Annie Williams & Miriam Wells Sotheby's International Realty 117 Greenwich Street San, Francisco, CA 94111 same time, there are few investors at the moment who might be interested in buying up any loans or MBS comprised of non-guaranteed mortgages. Jumbo markets are still supported in both direct and indirect ways; Fannie and Freddie will buy loans with amounts of up to $765,600 in "high-cost" areas, and depository institutions are almost always interested in making high-dollar loans to customers with the best possible credentials, if probably less so at the moment. It is good that the Fed has pledged unlimited amounts of MBS purchases, because selling them to investors might prove difficult for a while. Risks of investing in mortgages are on the rise, not only from consumers losing their incomes due to shut- downs creating payment risk but also from various government forbearance programs that may allow mortgage holders to skip making payments for up to a full year. Couple this with the surge in prepay- ment risk from able homeowners refinancing (something that will likely cool due to job loss in the near term, but may re-fire as mortgage rates will probably test "all-time" lows again in the coming weeks or months), and keeping in mind that new MBS will likely be issued at or near record low (Continued from page 2) yields, it's not hard to see why investors might not want them... and why the Fed may need to buy up a huge number of them. Of course, risks in mortgages are likely to persist long after the coronavirus pandemic has been quelled as the effects of the government mandated recession. This will probably result in at least some future need for measures beyond temporary for- bearance for some borrowers, and while it's too soon to tell, we may again be looking at the need for loan modifications for some borrowers at some point. Sales of new homes were still solid in February, running at a 765,000 annual clip, down a little from an upwardly-revised 800K figure for January. There were 5 months of available supply of new homes at the February sales pace, with 319,000 actual units built and ready to be sold. That was the lowest figure since August 2018, and suggested that we would see a faster pace of building heading into the spring. Again, this is no longer likely. -20.0% -10.0% 0.0% 10.0% 20.0% 30.0% 40.0% 50.0% 1 0 MM J SN 1 1 MM J SN 1 2 MM J SN 1 3 MM J SN 1 4 MM J SN 1 5 MM J SN 1 6 MM J SN 1 7 MM J SN 1 8 MM J SN 1 9 MM J SN 2 0 M San Francisco Homes: Year-Over-Year Median Sales Price Change © 2020 rereport.com