SlideShare a Scribd company logo
1 of 4
Download to read offline
averages to eliminate monthly and
seasonal variations.
If you are planning on selling your property,
call me for a free comparative market
analysis.
Sales of single-family, re-sale homes
rose again in December, gaining 52.6%
year-over-year. They were up 3.5% from
November. There were 267 homes sold in
San Francisco last month. The average
since 2000 is 214.
For the year, home sales were up 2.8%.
Condo sales were down 3.3%.
The average sales price for homes rose
7.3% year-over-year.
The median sales price for single-family,
re-sale homes rose 9.1% year-over-year.
The median sales price for condos/lofts
was down 8.2% year-over-year.
The average sales price was up 1.9%
year-over-year.
Sales of condos/lofts rose 59.7% year-
over-year. There were 345 condos/lofts
sold last month.
The sales price to list price ratio, or what
buyers are paying over what sellers are
asking, fell from 103.4% to 102.3 % for
homes. The ratio for condos/townhomes
fell from 99.9% to 98.9%.
Average days on market, or the time from
when a property is listed to when it goes
into contract, was 29 for homes and 54
for condos/lofts.
for homes rose 3.5 points to +2.6. Sales
momentum for condos/lofts was up 4.3
points to
–3.9.
for single-family homes
rose 0.9 of a point to
+3.5. Pricing
momentum for
condos/lofts fell 0.9 of a
point to –1.5.
Our momentum
statistics are based on
12-month moving
Sotheby's International Realty
117 Greenwich Street
San, Francisco, CA 94111
Cell: (415) 819-2663
AnnieWilliamsSF@gmail.com
http://www.anniewilliamshomes.com
Annie Williams & Miriam Wells
ANNIE WILLIAMS & MIRIAM WELLS | ANNIEWILLIAMSSF@GMAIL.COM | HTTP://WWW.ANNIEWILLIAMSHOMES.COM
Dec 20 Month % Nov 20 Year % Dec 19
Median Price: 1,582,000$ -6.5% 1,691,500$ 9.1% 1,450,000$
Average Price: 2,090,948$ -0.1% 2,092,465$ 7.3% 1,948,749$
Home Sales: 267 3.5% 258 52.6% 175
Sale/List Price Ratio: 102.3% -1.0% 103.4% -2.8% 105.2%
Days on Market: 29 -9.4% 32 -5.2% 31
(Condominiums)
Dec 20 Month % Nov 20 Year % Dec 19
Median Price: 1,100,000$ -8.3% 1,200,000$ -8.2% 1,198,283$
Average Price: 1,285,705$ -1.5% 1,305,881$ 1.9% 1,261,689$
Home Sales: 345 4.2% 331 59.7% 216
Sale/List Price Ratio: 98.9% -1.0% 99.9% -4.1% 103.0%
Days on Market: 54 10.0% 49 10.1% 49
Trends at a Glance
(Single-family Homes)
-25.0
-20.0
-15.0
-10.0
-5.0
0.0
5.0
10.0
15.0
20.0
25.0
0
6
A J O 0
7
A J O 0
8
A J O 0
9
A J O 1
0
A J O 1
1
A J O 1
2
A J O 1
3
A J O 1
4
A J O 1
5
A J O 1
6
A J O 1
7
A J O 1
8
A J O 1
9
A J O 2
0
A J O
San Francisco Homes: Sales Momentum
Sales Pricing © 2021 rereport.com
December 31, 2020 -- A year ago, when the calendar
first turned to 2020, it's a fair bet that no one could
see what was coming, or know how profoundly one
little germ could change our lives. The coronavirus
outbreak, epidemic and then pandemic upended
everything across the globe, and even as we strive
for a semblance of normalcy, it's not done yet just
yet. You'll be able to witness the latest effects this
evening, as normally-packed live celebrations of the
change of year in cities around the world will be thin-
ner, remotely generated and socially-distanced. "On
January 1, 2021, for the first time every, hindsight will
actually be 2020", according to a popular internet
meme, and there's little doubt that many people will
be happy to see it go.
With one country after another closing, and uncer-
tainty and risks skyrocketing, investors got spooked
and came to a point of selling everything to move to
cash; interest rates spiked, financial markets became
unhinged and central banks across the world moved
into emergency positions, slashing rates, buying
bonds and opening up new lending and market-
support facilities, moving to liquefy every market and
be the buyer of last resort for a range of assets if
need be. The market panic was quelled, and a de-
pression likely averted. Lockdowns ensured that the
economies of many countries would fall into record-
setting recession for a time, only to quickly (if partial-
ly) emerge.
As they did, unprecedented opportunities arose for
homeowners. For those in difficult straits, and with
the experience of at least some lessons learned in
the last housing bust, a nearly instant forbearance
program for homeowners was released, and without
even the burden of proof of hardship. Millions signed
up; a core of the most troubled homeowners
(numbering about 2.8 million) yet remain in forbear-
ance. For others who experienced no payment trou-
bles, opportunities to refinance at record low rates --
multiple times -- appeared. Freddie Mac's formal all-
time low for a conforming 30-year (3.31%) FRM was
touched in mid-April, broken by the end of the of the
month a new record low was set in 17 weeks since
then, falling to as low 2.66% near the end of the year.
Potential homebuyers took notice, too. The year
began with an early start on the spring homebuying
season with a solid winter showing for sales, but that
came to a relative standstill in March through May,
only to revive with vigor and then some as the econo-
(Continued on page 4)
ANNIE WILLIAMS & MIRIAM WELLS
SOTHEBY'S INTERNATIONAL REALTY
ANNIEWILLIAMSSF@GMAIL.COM
The chart above shows the National month-
ly average for 30-year fixed rate mortgages
as compiled by http://
1.0% 2.0% 3.0% 4.0% 5.0% 6.0%
01-10
07-10
01-11
07-11
01-12
07-12
01-13
07-13
01-14
07-14
01-15
07-15
01-16
07-16
01-17
07-17
01-18
07-18
01-19
07-19
01-20
07-20
30-Year Fixed Mortgage Rates
Unit
Median Average Sales DOM SP/LP Median Average Sales Median Average Sales
San Francisco $1,582,000 $2,090,948 267 29 102.3% 9.1% 7.3% 52.6% -6.5% -0.1% 3.5%
D1: Northwest $2,050,000 $2,380,244 20 43 102.4% 17.1% 24.4% 25.0% -7.3% -33.8% -16.7%
D2: Central West $1,534,500 $1,617,456 44 23 112.7% 10.8% 10.0% 69.2% -1.6% -0.1% 0.0%
D3: Southwest $1,305,000 $1,210,964 17 28 105.1% 16.0% 0.9% 6.3% -9.2% -25.1% 70.0%
D4: Twin Peaks $1,700,000 $1,770,724 33 22 104.4% 4.6% -3.7% 57.1% 0.0% -0.5% -31.3%
D5: Central $2,225,000 $2,392,533 42 32 101.8% -13.6% -8.5% 90.9% -10.1% -13.4% 0.0%
D6: Central North $2,250,000 $2,568,000 7 23 102.8% -24.5% -8.7% 16.7% -1.1% 12.9% 250.0%
D7: North $5,247,500 $6,226,770 20 60 93.4% 14.1% -3.6% 185.7% 7.1% 10.6% 122.2%
D8: Northeast $2,520,000 $2,520,000 1 137 100.9% -59.4% -62.5% -66.7% 38.6% 38.3% -66.7%
D9: Central East $1,627,500 $1,749,837 32 21 105.2% 11.3% 11.7% 100.0% -4.8% -5.2% 6.7%
D10: Southeast $1,100,000 $1,156,418 51 24 106.8% 3.5% 4.3% 27.5% 10.6% 9.2% 10.9%
December Sales Statistics
(Single-family Homes)
Prices Yearly Change Monthly Change
0
50
100
150
200
250
300
350
$300
$800
$1,300
$1,800
$2,300
1
0
A J O 1
1
A J O 1
2
A J O 1
3
A J O 1
4
A J O 1
5
A J O 1
6
A J O 1
7
A J O 1
8
A J O 1
9
A J O 2
0
A J O
San Francisco Homes: Sold Prices & Unit Sales
(3-month moving average — $000's)
Ave Med Units © 2021 rereport.com
ANNIE WILLIAMS & MIRIAM WELLS
SOTHEBY'S INTERNATIONAL REALTY
ANNIEWILLIAMSSF@GMAIL.COM
Unit
Median Average Sales DOM SP/LP Median Average Sales Median Average Sales
San Francisco $1,100,000 $1,285,705 345 54 98.9% -8.2% 1.9% 59.7% -8.3% -1.5% 4.2%
D1: Northwest $1,160,000 $1,167,421 19 46 101.7% 0.9% 0.4% 72.7% -22.0% -31.2% -20.8%
D2: Central West $1,020,000 $1,075,417 7 54 99.3% -25.8% -17.6% 75.0% -25.1% -17.1% 16.7%
D3: Southwest $738,000 $891,000 3 27 98.6% -10.4% 7.0% -25.0% -36.4% -14.9% -40.0%
D4: Twin Peaks $700,000 $699,800 5 61 100.7% -11.7% -12.9% -58.3% -13.9% -19.0% -58.3%
D5: Central $1,350,000 $1,341,713 59 47 101.7% -10.0% -15.7% 78.8% 7.4% 1.8% 3.5%
D6: Central North $1,130,000 $1,117,937 43 48 100.8% 10.5% -3.6% 138.9% -8.0% -3.7% -14.0%
D7: North $1,507,500 $1,782,229 38 54 97.9% -3.5% 1.6% 72.7% -6.7% -1.1% -9.5%
D8: Northeast $962,500 $1,308,324 43 60 97.4% -12.5% 14.2% 13.2% -19.0% -3.4% 22.9%
D9: Central East $1,050,000 $1,286,481 115 57 97.4% -4.5% 7.1% 79.7% 2.4% 12.1% 26.4%
D10: Southeast $700,000 $607,807 6 82 98.1% 1.7% -7.9% 20.0% -23.9% -33.9% 200.0%
December Sales Statistics
(Condos/TICs/Co-ops/Lofts)
Prices Yearly Change Monthly Change
80.0%
85.0%
90.0%
95.0%
100.0%
105.0%
110.0%
115.0%
120.0%
1
0
A J O 1
1
A J O 1
2
A J O 1
3
A J O 1
4
A J O 1
5
A J O 1
6
A J O 1
7
A J O 1
8
A J O 1
9
A J O 2
0
A J O
San Francisco Homes: Sales Price to List Price Ratio
© 2020 rereport.com
-50.0
-40.0
-30.0
-20.0
-10.0
0.0
10.0
20.0
30.0
40.0
0
6
A J O 0
7
A J O 0
8
A J O 0
9
A J O 1
0
A J O 1
1
A J O 1
2
A J O 1
3
A J O 1
4
A J O 1
5
A J O 1
6
A J O 1
7
A J O 1
8
A J O 1
9
A J O 2
0
A J O
San Francisco Condos/Lofts: SalesMomentum
Sales Pricing © 2020 rereport.com
0
50
100
150
200
250
300
350
$300
$500
$700
$900
$1,100
$1,300
$1,500
1
0
A J O 1
1
A J O 1
2
A J O 1
3
A J O 1
4
A J O 1
5
A J O 1
6
A J O 1
7
A J O 1
8
A J O 1
9
A J O 2
0
A J O
San Francisco Condos: Sold Prices & Unit Sales
(3-month moving average — $000's)
Ave Med Units © 2020 rereport.com
Annie Williams & Miriam Wells
Sotheby's International Realty
117 Greenwich Street
San, Francisco, CA 94111
my re-opened through the summer. The delayed
action of the spring market was joined by additional
demand from second home buyers looking to es-
cape to remote locations, away from virus and
strife, and by buyers who could now work remotely
and so no longer felt constricted by proximity to
center-city workspaces. With competition for hous-
es fierce and existing home prices rising sharply,
it's also likely that some demand has been
"advanced" from the coming year in order to grab a
home before costs increased further.
With the existing home market tight and expensive,
and possibly with commuting to work far less of a
concern, sales of new homes also enjoyed a strong
period during the mid-part of 2020, but sales are
settling back to a very solid (if less frenetic) trend
as the year turns. Before a pandemic dip last
spring, sales of new homes had been in a 10-year
uptrend, and seem poised to return to that kind of
steady, solid (if unspectacular) improvement now
that the pandemic distortion in sales has cycled
through.
Existing home sales have started to cool a bit from
heady annualized levels too, although that's to be
expected as the winter months kick in. The spring-
bumped-into-summer housing season has passed,
and while there is still plenty of demand there is
(Continued from page 2) little supply to be had, and even fewer homes are
put up for sale once the onset of the extended holi-
day (and then winter) season begins. The National
Association of Realtors Pending Home Sales Index
contracted again in November, declining by 2.6%, a
third consecutive decline. Compared to a year ago,
though, contract signings are still some 16.4% high-
er, and if we weigh this change against sales levels
last December/January, it looks like this will trans-
late into a 6.25 million (or so) annualized rate of
sale. October's 6.86 million (annual) was the recent
peak, and sales are likely to continue to cool some-
what until the next spring cycle kicks up again.
-20.0%
-10.0%
0.0%
10.0%
20.0%
30.0%
40.0%
50.0%
1
0
A J O 1
1
A J O 1
2
A J O 1
3
A J O 1
4
A J O 1
5
A J O 1
6
A J O 1
7
A J O 1
8
A J O 1
9
A J O 2
0
A J O
San Francisco Homes: Year-Over-Year Median Sales Price Change
© 2020 rereport.com

More Related Content

What's hot

AnnieWilliams Market Trends Oct-Nov 2014
AnnieWilliams Market Trends Oct-Nov 2014AnnieWilliams Market Trends Oct-Nov 2014
AnnieWilliams Market Trends Oct-Nov 2014Jon Weaver
 
Annie Williams Real Estate Report - February 2020
Annie Williams Real Estate Report - February 2020Annie Williams Real Estate Report - February 2020
Annie Williams Real Estate Report - February 2020Jon Weaver
 
Annie Williams Real Estate Report - August 2021
Annie Williams Real Estate Report - August 2021Annie Williams Real Estate Report - August 2021
Annie Williams Real Estate Report - August 2021Annie Williams
 
Annie Williams Market Trends Sept-Oct 2014
Annie Williams Market Trends Sept-Oct 2014Annie Williams Market Trends Sept-Oct 2014
Annie Williams Market Trends Sept-Oct 2014Jon Weaver
 
Annie Williams Real Estate Report - November 2019
Annie Williams Real Estate Report - November 2019Annie Williams Real Estate Report - November 2019
Annie Williams Real Estate Report - November 2019Jon Weaver
 
Annie Williams Real Estate Report - March 2021
Annie Williams Real Estate Report - March 2021Annie Williams Real Estate Report - March 2021
Annie Williams Real Estate Report - March 2021Annie Williams
 
Annie Williams Real Estate Report - March 2018
Annie Williams Real Estate Report - March 2018Annie Williams Real Estate Report - March 2018
Annie Williams Real Estate Report - March 2018Annie Williams
 
Annie Williams Real Estate Report - December 2021
Annie Williams Real Estate Report - December 2021Annie Williams Real Estate Report - December 2021
Annie Williams Real Estate Report - December 2021Annie Williams
 
Annie Williams Real Estate Report - November 2021
Annie Williams Real Estate Report - November 2021Annie Williams Real Estate Report - November 2021
Annie Williams Real Estate Report - November 2021Annie Williams
 
Annie Williams Market Trends June-July 2015
Annie Williams Market Trends June-July 2015Annie Williams Market Trends June-July 2015
Annie Williams Market Trends June-July 2015Jon Weaver
 
Annie Williams Real Estate Report - February 2021
Annie Williams Real Estate Report - February 2021Annie Williams Real Estate Report - February 2021
Annie Williams Real Estate Report - February 2021Annie Williams
 
Annie Williams Real Estate Report - December 2020
Annie Williams Real Estate Report - December 2020Annie Williams Real Estate Report - December 2020
Annie Williams Real Estate Report - December 2020Jon Weaver
 
Annie Williams Market Trends Aug-Sept 2014
Annie Williams Market Trends Aug-Sept 2014Annie Williams Market Trends Aug-Sept 2014
Annie Williams Market Trends Aug-Sept 2014Jon Weaver
 
Annie Williams Real Estate Report - April 2020
Annie Williams Real Estate Report - April 2020Annie Williams Real Estate Report - April 2020
Annie Williams Real Estate Report - April 2020Jon Weaver
 
Annie Williams Market Report April-May 2016
Annie Williams Market Report April-May 2016Annie Williams Market Report April-May 2016
Annie Williams Market Report April-May 2016Jon Weaver
 
Annie Williams Real Estate Report - October 2019
Annie Williams Real Estate Report - October 2019Annie Williams Real Estate Report - October 2019
Annie Williams Real Estate Report - October 2019Jon Weaver
 
Annie Williams Real Estate Report Mar-Apr 2017
Annie Williams Real Estate Report Mar-Apr 2017Annie Williams Real Estate Report Mar-Apr 2017
Annie Williams Real Estate Report Mar-Apr 2017Jon Weaver
 
Annie Williams Market Report March-April 2016
Annie Williams Market Report March-April 2016Annie Williams Market Report March-April 2016
Annie Williams Market Report March-April 2016Jon Weaver
 
Annie Williams Market Trends June-July 2016
Annie Williams Market Trends June-July 2016Annie Williams Market Trends June-July 2016
Annie Williams Market Trends June-July 2016Jon Weaver
 

What's hot (20)

AnnieWilliams Market Trends Oct-Nov 2014
AnnieWilliams Market Trends Oct-Nov 2014AnnieWilliams Market Trends Oct-Nov 2014
AnnieWilliams Market Trends Oct-Nov 2014
 
Annie Williams Real Estate Report - February 2020
Annie Williams Real Estate Report - February 2020Annie Williams Real Estate Report - February 2020
Annie Williams Real Estate Report - February 2020
 
Annie Williams Real Estate Report - August 2021
Annie Williams Real Estate Report - August 2021Annie Williams Real Estate Report - August 2021
Annie Williams Real Estate Report - August 2021
 
Annie Williams Market Trends Sept-Oct 2014
Annie Williams Market Trends Sept-Oct 2014Annie Williams Market Trends Sept-Oct 2014
Annie Williams Market Trends Sept-Oct 2014
 
Annie Williams Real Estate Report - November 2019
Annie Williams Real Estate Report - November 2019Annie Williams Real Estate Report - November 2019
Annie Williams Real Estate Report - November 2019
 
Annie Williams Real Estate Report - March 2021
Annie Williams Real Estate Report - March 2021Annie Williams Real Estate Report - March 2021
Annie Williams Real Estate Report - March 2021
 
Annie Williams Real Estate Report - March 2018
Annie Williams Real Estate Report - March 2018Annie Williams Real Estate Report - March 2018
Annie Williams Real Estate Report - March 2018
 
Annie Williams Real Estate Report - December 2021
Annie Williams Real Estate Report - December 2021Annie Williams Real Estate Report - December 2021
Annie Williams Real Estate Report - December 2021
 
Annie Williams Real Estate Report - November 2021
Annie Williams Real Estate Report - November 2021Annie Williams Real Estate Report - November 2021
Annie Williams Real Estate Report - November 2021
 
Annie Williams Market Trends June-July 2015
Annie Williams Market Trends June-July 2015Annie Williams Market Trends June-July 2015
Annie Williams Market Trends June-July 2015
 
Annie Williams Real Estate Report - February 2021
Annie Williams Real Estate Report - February 2021Annie Williams Real Estate Report - February 2021
Annie Williams Real Estate Report - February 2021
 
Annie Williams Real Estate Report - December 2020
Annie Williams Real Estate Report - December 2020Annie Williams Real Estate Report - December 2020
Annie Williams Real Estate Report - December 2020
 
Annie Williams Market Trends Aug-Sept 2014
Annie Williams Market Trends Aug-Sept 2014Annie Williams Market Trends Aug-Sept 2014
Annie Williams Market Trends Aug-Sept 2014
 
Annie Williams Real Estate Report - April 2020
Annie Williams Real Estate Report - April 2020Annie Williams Real Estate Report - April 2020
Annie Williams Real Estate Report - April 2020
 
Annie Williams Market Report April-May 2016
Annie Williams Market Report April-May 2016Annie Williams Market Report April-May 2016
Annie Williams Market Report April-May 2016
 
Annie Williams Real Estate Report - October 2019
Annie Williams Real Estate Report - October 2019Annie Williams Real Estate Report - October 2019
Annie Williams Real Estate Report - October 2019
 
Annie Williams Real Estate Report Mar-Apr 2017
Annie Williams Real Estate Report Mar-Apr 2017Annie Williams Real Estate Report Mar-Apr 2017
Annie Williams Real Estate Report Mar-Apr 2017
 
Annie Williams Market Report March-April 2016
Annie Williams Market Report March-April 2016Annie Williams Market Report March-April 2016
Annie Williams Market Report March-April 2016
 
November 2018 Realtor Report
November 2018 Realtor ReportNovember 2018 Realtor Report
November 2018 Realtor Report
 
Annie Williams Market Trends June-July 2016
Annie Williams Market Trends June-July 2016Annie Williams Market Trends June-July 2016
Annie Williams Market Trends June-July 2016
 

Similar to SF Home Market Report: Sales Rise Despite Pandemic Challenges

Annie Williams Real Estate Report-July 2023
Annie Williams Real Estate Report-July 2023Annie Williams Real Estate Report-July 2023
Annie Williams Real Estate Report-July 2023Annie Williams
 
Annie Williams Real Estate Report - April 2023
Annie Williams Real Estate Report - April 2023Annie Williams Real Estate Report - April 2023
Annie Williams Real Estate Report - April 2023Annie Williams
 
Annie Williams Real Estate Report-June 2023
Annie Williams Real Estate Report-June 2023Annie Williams Real Estate Report-June 2023
Annie Williams Real Estate Report-June 2023Annie Williams
 
Annie Williams Real Estate Report - Feb 2023
Annie Williams Real Estate Report - Feb 2023Annie Williams Real Estate Report - Feb 2023
Annie Williams Real Estate Report - Feb 2023Annie Williams
 
Annie Williams Real Estate Report-September 2023-9.pdf
Annie Williams Real Estate Report-September 2023-9.pdfAnnie Williams Real Estate Report-September 2023-9.pdf
Annie Williams Real Estate Report-September 2023-9.pdfAnnie Williams
 
Annie Williams Real Estate Report, Nov 2022
Annie Williams Real Estate Report, Nov 2022Annie Williams Real Estate Report, Nov 2022
Annie Williams Real Estate Report, Nov 2022Annie Williams
 
Real Estate’s New Normal - April/May Real Estate Report
Real Estate’s New Normal  - April/May Real Estate ReportReal Estate’s New Normal  - April/May Real Estate Report
Real Estate’s New Normal - April/May Real Estate ReportAMSI, San Francisco
 
Annie Williams Real Estate Report - August 2023
Annie Williams Real Estate Report - August 2023Annie Williams Real Estate Report - August 2023
Annie Williams Real Estate Report - August 2023Annie Williams
 
Annie Williams Real Estate Report Nov-Dec 2017
Annie Williams Real Estate Report Nov-Dec 2017Annie Williams Real Estate Report Nov-Dec 2017
Annie Williams Real Estate Report Nov-Dec 2017Jon Weaver
 
Annie Williams Real Estate Report - December 2023
Annie Williams Real Estate Report - December 2023Annie Williams Real Estate Report - December 2023
Annie Williams Real Estate Report - December 2023Annie Williams
 
Annie Williams Real Estate Report - October 2022
Annie Williams Real Estate Report - October 2022Annie Williams Real Estate Report - October 2022
Annie Williams Real Estate Report - October 2022Annie Williams
 
Annie Williams Real Estate Report - May 2020
Annie Williams Real Estate Report - May 2020Annie Williams Real Estate Report - May 2020
Annie Williams Real Estate Report - May 2020Jon Weaver
 
Annie Williams Real Estate Report December 2017
Annie Williams Real Estate Report December 2017Annie Williams Real Estate Report December 2017
Annie Williams Real Estate Report December 2017Jon Weaver
 
Annie Williams Real Estate Report-May 2023
Annie Williams Real Estate Report-May 2023Annie Williams Real Estate Report-May 2023
Annie Williams Real Estate Report-May 2023Annie Williams
 
Annie Williams Real Estate Report - April 2019
Annie Williams Real Estate Report - April 2019Annie Williams Real Estate Report - April 2019
Annie Williams Real Estate Report - April 2019Jon Weaver
 
Lack of Inventory Plagues Market - Real Estate Report August/September
Lack of Inventory Plagues Market - Real Estate Report August/SeptemberLack of Inventory Plagues Market - Real Estate Report August/September
Lack of Inventory Plagues Market - Real Estate Report August/SeptemberAMSI, San Francisco
 
Case-Shiller Report Slowing Price Increases - Real Estate Report October/Nove...
Case-Shiller Report Slowing Price Increases - Real Estate Report October/Nove...Case-Shiller Report Slowing Price Increases - Real Estate Report October/Nove...
Case-Shiller Report Slowing Price Increases - Real Estate Report October/Nove...AMSI, San Francisco
 
Zillow Sued Over Zestimates - June/July Real Estate Report
Zillow Sued Over Zestimates - June/July Real Estate ReportZillow Sued Over Zestimates - June/July Real Estate Report
Zillow Sued Over Zestimates - June/July Real Estate ReportAMSI, San Francisco
 
Prices Reach All-Time Highs, Again - Real Estate Report July/August
Prices Reach All-Time Highs, Again - Real Estate Report July/AugustPrices Reach All-Time Highs, Again - Real Estate Report July/August
Prices Reach All-Time Highs, Again - Real Estate Report July/AugustAMSI, San Francisco
 

Similar to SF Home Market Report: Sales Rise Despite Pandemic Challenges (20)

Annie Williams Real Estate Report-July 2023
Annie Williams Real Estate Report-July 2023Annie Williams Real Estate Report-July 2023
Annie Williams Real Estate Report-July 2023
 
Annie Williams Real Estate Report - April 2023
Annie Williams Real Estate Report - April 2023Annie Williams Real Estate Report - April 2023
Annie Williams Real Estate Report - April 2023
 
Annie Williams Real Estate Report-June 2023
Annie Williams Real Estate Report-June 2023Annie Williams Real Estate Report-June 2023
Annie Williams Real Estate Report-June 2023
 
Annie Williams Real Estate Report - Feb 2023
Annie Williams Real Estate Report - Feb 2023Annie Williams Real Estate Report - Feb 2023
Annie Williams Real Estate Report - Feb 2023
 
Annie Williams Real Estate Report-September 2023-9.pdf
Annie Williams Real Estate Report-September 2023-9.pdfAnnie Williams Real Estate Report-September 2023-9.pdf
Annie Williams Real Estate Report-September 2023-9.pdf
 
Annie Williams Real Estate Report, Nov 2022
Annie Williams Real Estate Report, Nov 2022Annie Williams Real Estate Report, Nov 2022
Annie Williams Real Estate Report, Nov 2022
 
2018 January Real Estate Report
2018 January Real Estate Report2018 January Real Estate Report
2018 January Real Estate Report
 
Real Estate’s New Normal - April/May Real Estate Report
Real Estate’s New Normal  - April/May Real Estate ReportReal Estate’s New Normal  - April/May Real Estate Report
Real Estate’s New Normal - April/May Real Estate Report
 
Annie Williams Real Estate Report - August 2023
Annie Williams Real Estate Report - August 2023Annie Williams Real Estate Report - August 2023
Annie Williams Real Estate Report - August 2023
 
Annie Williams Real Estate Report Nov-Dec 2017
Annie Williams Real Estate Report Nov-Dec 2017Annie Williams Real Estate Report Nov-Dec 2017
Annie Williams Real Estate Report Nov-Dec 2017
 
Annie Williams Real Estate Report - December 2023
Annie Williams Real Estate Report - December 2023Annie Williams Real Estate Report - December 2023
Annie Williams Real Estate Report - December 2023
 
Annie Williams Real Estate Report - October 2022
Annie Williams Real Estate Report - October 2022Annie Williams Real Estate Report - October 2022
Annie Williams Real Estate Report - October 2022
 
Annie Williams Real Estate Report - May 2020
Annie Williams Real Estate Report - May 2020Annie Williams Real Estate Report - May 2020
Annie Williams Real Estate Report - May 2020
 
Annie Williams Real Estate Report December 2017
Annie Williams Real Estate Report December 2017Annie Williams Real Estate Report December 2017
Annie Williams Real Estate Report December 2017
 
Annie Williams Real Estate Report-May 2023
Annie Williams Real Estate Report-May 2023Annie Williams Real Estate Report-May 2023
Annie Williams Real Estate Report-May 2023
 
Annie Williams Real Estate Report - April 2019
Annie Williams Real Estate Report - April 2019Annie Williams Real Estate Report - April 2019
Annie Williams Real Estate Report - April 2019
 
Lack of Inventory Plagues Market - Real Estate Report August/September
Lack of Inventory Plagues Market - Real Estate Report August/SeptemberLack of Inventory Plagues Market - Real Estate Report August/September
Lack of Inventory Plagues Market - Real Estate Report August/September
 
Case-Shiller Report Slowing Price Increases - Real Estate Report October/Nove...
Case-Shiller Report Slowing Price Increases - Real Estate Report October/Nove...Case-Shiller Report Slowing Price Increases - Real Estate Report October/Nove...
Case-Shiller Report Slowing Price Increases - Real Estate Report October/Nove...
 
Zillow Sued Over Zestimates - June/July Real Estate Report
Zillow Sued Over Zestimates - June/July Real Estate ReportZillow Sued Over Zestimates - June/July Real Estate Report
Zillow Sued Over Zestimates - June/July Real Estate Report
 
Prices Reach All-Time Highs, Again - Real Estate Report July/August
Prices Reach All-Time Highs, Again - Real Estate Report July/AugustPrices Reach All-Time Highs, Again - Real Estate Report July/August
Prices Reach All-Time Highs, Again - Real Estate Report July/August
 

Recently uploaded

)_Call Girls In Radisson Blu Plaza Hotel, Delhi Airport ❤️8860477959 _Indepen...
)_Call Girls In Radisson Blu Plaza Hotel, Delhi Airport ❤️8860477959 _Indepen...)_Call Girls In Radisson Blu Plaza Hotel, Delhi Airport ❤️8860477959 _Indepen...
)_Call Girls In Radisson Blu Plaza Hotel, Delhi Airport ❤️8860477959 _Indepen...lizamodels9
 
83770-87607 ۞Call Girls In Near The Park Hotel (Cp) Delhi
83770-87607 ۞Call Girls In Near The Park Hotel (Cp) Delhi83770-87607 ۞Call Girls In Near The Park Hotel (Cp) Delhi
83770-87607 ۞Call Girls In Near The Park Hotel (Cp) Delhidollysharma2066
 
Call Girls In Mundka Industrial Metro@꧂8447779280 ↬Enjoy ꧂Escort Service in ...
Call Girls In Mundka Industrial Metro@꧂8447779280 ↬Enjoy ꧂Escort Service in  ...Call Girls In Mundka Industrial Metro@꧂8447779280 ↬Enjoy ꧂Escort Service in  ...
Call Girls In Mundka Industrial Metro@꧂8447779280 ↬Enjoy ꧂Escort Service in ...asmaqueen5
 
Rustomjee The Panorama At Pali Hill, Bandra West, Mumbai - Brochure.pdf
Rustomjee The Panorama At Pali Hill, Bandra West, Mumbai - Brochure.pdfRustomjee The Panorama At Pali Hill, Bandra West, Mumbai - Brochure.pdf
Rustomjee The Panorama At Pali Hill, Bandra West, Mumbai - Brochure.pdfmonikasharma630
 
Low Rate Call Girls in Triveni Complex Delhi Call 9990771857
Low Rate Call Girls in Triveni Complex Delhi Call 9990771857Low Rate Call Girls in Triveni Complex Delhi Call 9990771857
Low Rate Call Girls in Triveni Complex Delhi Call 9990771857delhimodel235
 
Call Girls in Khan Market 9654467111 ESCORTS SERVICE
Call Girls in Khan Market 9654467111 ESCORTS SERVICECall Girls in Khan Market 9654467111 ESCORTS SERVICE
Call Girls in Khan Market 9654467111 ESCORTS SERVICESapana Sha
 
Call Girls In Mayur Vihar-1 Delhi ❤️8860477959 Good Looking Escorts In 24/7 D...
Call Girls In Mayur Vihar-1 Delhi ❤️8860477959 Good Looking Escorts In 24/7 D...Call Girls In Mayur Vihar-1 Delhi ❤️8860477959 Good Looking Escorts In 24/7 D...
Call Girls In Mayur Vihar-1 Delhi ❤️8860477959 Good Looking Escorts In 24/7 D...lizamodels9
 
9990771857 Call Girls in Noida Sector 10 Noida (Call Girls) Delhi
9990771857 Call Girls in Noida Sector 10 Noida (Call Girls) Delhi9990771857 Call Girls in Noida Sector 10 Noida (Call Girls) Delhi
9990771857 Call Girls in Noida Sector 10 Noida (Call Girls) Delhidelhimodel235
 
9711199012 Call {Girls Delhi} Very Low rate Vaishali DownLoad PDF
9711199012 Call {Girls Delhi} Very Low rate Vaishali DownLoad PDF9711199012 Call {Girls Delhi} Very Low rate Vaishali DownLoad PDF
9711199012 Call {Girls Delhi} Very Low rate Vaishali DownLoad PDFMs Riya
 
9990771857 Call Girls in Noida Sector 1 Noida (Call Girls) Delhi
9990771857 Call Girls in Noida Sector 1 Noida (Call Girls) Delhi9990771857 Call Girls in Noida Sector 1 Noida (Call Girls) Delhi
9990771857 Call Girls in Noida Sector 1 Noida (Call Girls) Delhidelhimodel235
 
Call Girls in Model Town Delhi 💯Call Us 🔝8264348440🔝
Call Girls in Model Town Delhi 💯Call Us 🔝8264348440🔝Call Girls in Model Town Delhi 💯Call Us 🔝8264348440🔝
Call Girls in Model Town Delhi 💯Call Us 🔝8264348440🔝soniya singh
 
SVN Live 4.22.24 Weekly Property Broadcast
SVN Live 4.22.24 Weekly Property BroadcastSVN Live 4.22.24 Weekly Property Broadcast
SVN Live 4.22.24 Weekly Property BroadcastSVN International Corp.
 
Call Girls in Nehru Place Delhi 💯Call Us 🔝8264348440🔝
Call Girls in Nehru Place Delhi 💯Call Us 🔝8264348440🔝Call Girls in Nehru Place Delhi 💯Call Us 🔝8264348440🔝
Call Girls in Nehru Place Delhi 💯Call Us 🔝8264348440🔝soniya singh
 
Shapoorji Pallonji Parkwest Sequoia Tower Bangalore.pdf
Shapoorji Pallonji Parkwest Sequoia Tower Bangalore.pdfShapoorji Pallonji Parkwest Sequoia Tower Bangalore.pdf
Shapoorji Pallonji Parkwest Sequoia Tower Bangalore.pdfashiyadav24
 
The Omaxe State Dwarka Delhi-broucher.pdf.pdf
The Omaxe State Dwarka Delhi-broucher.pdf.pdfThe Omaxe State Dwarka Delhi-broucher.pdf.pdf
The Omaxe State Dwarka Delhi-broucher.pdf.pdfkratirudram
 
Call Girls in Sarai Kale Khan Delhi 💯Call Us 🔝8264348440🔝
Call Girls in Sarai Kale Khan Delhi 💯Call Us 🔝8264348440🔝Call Girls in Sarai Kale Khan Delhi 💯Call Us 🔝8264348440🔝
Call Girls in Sarai Kale Khan Delhi 💯Call Us 🔝8264348440🔝soniya singh
 
Eco-Efficient Living: Redefining Sustainability through Leech's Green Design ...
Eco-Efficient Living: Redefining Sustainability through Leech's Green Design ...Eco-Efficient Living: Redefining Sustainability through Leech's Green Design ...
Eco-Efficient Living: Redefining Sustainability through Leech's Green Design ...Newman George Leech
 

Recently uploaded (20)

)_Call Girls In Radisson Blu Plaza Hotel, Delhi Airport ❤️8860477959 _Indepen...
)_Call Girls In Radisson Blu Plaza Hotel, Delhi Airport ❤️8860477959 _Indepen...)_Call Girls In Radisson Blu Plaza Hotel, Delhi Airport ❤️8860477959 _Indepen...
)_Call Girls In Radisson Blu Plaza Hotel, Delhi Airport ❤️8860477959 _Indepen...
 
83770-87607 ۞Call Girls In Near The Park Hotel (Cp) Delhi
83770-87607 ۞Call Girls In Near The Park Hotel (Cp) Delhi83770-87607 ۞Call Girls In Near The Park Hotel (Cp) Delhi
83770-87607 ۞Call Girls In Near The Park Hotel (Cp) Delhi
 
Call Girls In Mundka Industrial Metro@꧂8447779280 ↬Enjoy ꧂Escort Service in ...
Call Girls In Mundka Industrial Metro@꧂8447779280 ↬Enjoy ꧂Escort Service in  ...Call Girls In Mundka Industrial Metro@꧂8447779280 ↬Enjoy ꧂Escort Service in  ...
Call Girls In Mundka Industrial Metro@꧂8447779280 ↬Enjoy ꧂Escort Service in ...
 
Rustomjee The Panorama At Pali Hill, Bandra West, Mumbai - Brochure.pdf
Rustomjee The Panorama At Pali Hill, Bandra West, Mumbai - Brochure.pdfRustomjee The Panorama At Pali Hill, Bandra West, Mumbai - Brochure.pdf
Rustomjee The Panorama At Pali Hill, Bandra West, Mumbai - Brochure.pdf
 
Low Rate Call Girls in Triveni Complex Delhi Call 9990771857
Low Rate Call Girls in Triveni Complex Delhi Call 9990771857Low Rate Call Girls in Triveni Complex Delhi Call 9990771857
Low Rate Call Girls in Triveni Complex Delhi Call 9990771857
 
Call Girls in Khan Market 9654467111 ESCORTS SERVICE
Call Girls in Khan Market 9654467111 ESCORTS SERVICECall Girls in Khan Market 9654467111 ESCORTS SERVICE
Call Girls in Khan Market 9654467111 ESCORTS SERVICE
 
Call Girls in Mahavir Nagar whatsaap call US +919953056974
Call Girls in Mahavir Nagar  whatsaap call US  +919953056974Call Girls in Mahavir Nagar  whatsaap call US  +919953056974
Call Girls in Mahavir Nagar whatsaap call US +919953056974
 
Call Girls In Mayur Vihar-1 Delhi ❤️8860477959 Good Looking Escorts In 24/7 D...
Call Girls In Mayur Vihar-1 Delhi ❤️8860477959 Good Looking Escorts In 24/7 D...Call Girls In Mayur Vihar-1 Delhi ❤️8860477959 Good Looking Escorts In 24/7 D...
Call Girls In Mayur Vihar-1 Delhi ❤️8860477959 Good Looking Escorts In 24/7 D...
 
9990771857 Call Girls in Noida Sector 10 Noida (Call Girls) Delhi
9990771857 Call Girls in Noida Sector 10 Noida (Call Girls) Delhi9990771857 Call Girls in Noida Sector 10 Noida (Call Girls) Delhi
9990771857 Call Girls in Noida Sector 10 Noida (Call Girls) Delhi
 
Low Rate Call Girls in Triveni Complex Delhi Call 9873940964
Low Rate Call Girls in Triveni Complex Delhi Call 9873940964Low Rate Call Girls in Triveni Complex Delhi Call 9873940964
Low Rate Call Girls in Triveni Complex Delhi Call 9873940964
 
9711199012 Call {Girls Delhi} Very Low rate Vaishali DownLoad PDF
9711199012 Call {Girls Delhi} Very Low rate Vaishali DownLoad PDF9711199012 Call {Girls Delhi} Very Low rate Vaishali DownLoad PDF
9711199012 Call {Girls Delhi} Very Low rate Vaishali DownLoad PDF
 
9990771857 Call Girls in Noida Sector 1 Noida (Call Girls) Delhi
9990771857 Call Girls in Noida Sector 1 Noida (Call Girls) Delhi9990771857 Call Girls in Noida Sector 1 Noida (Call Girls) Delhi
9990771857 Call Girls in Noida Sector 1 Noida (Call Girls) Delhi
 
Call Girls in Model Town Delhi 💯Call Us 🔝8264348440🔝
Call Girls in Model Town Delhi 💯Call Us 🔝8264348440🔝Call Girls in Model Town Delhi 💯Call Us 🔝8264348440🔝
Call Girls in Model Town Delhi 💯Call Us 🔝8264348440🔝
 
SVN Live 4.22.24 Weekly Property Broadcast
SVN Live 4.22.24 Weekly Property BroadcastSVN Live 4.22.24 Weekly Property Broadcast
SVN Live 4.22.24 Weekly Property Broadcast
 
Hot call girls in Moti Bagh🔝 9953056974 🔝 escort Service
Hot call girls in Moti Bagh🔝 9953056974 🔝 escort ServiceHot call girls in Moti Bagh🔝 9953056974 🔝 escort Service
Hot call girls in Moti Bagh🔝 9953056974 🔝 escort Service
 
Call Girls in Nehru Place Delhi 💯Call Us 🔝8264348440🔝
Call Girls in Nehru Place Delhi 💯Call Us 🔝8264348440🔝Call Girls in Nehru Place Delhi 💯Call Us 🔝8264348440🔝
Call Girls in Nehru Place Delhi 💯Call Us 🔝8264348440🔝
 
Shapoorji Pallonji Parkwest Sequoia Tower Bangalore.pdf
Shapoorji Pallonji Parkwest Sequoia Tower Bangalore.pdfShapoorji Pallonji Parkwest Sequoia Tower Bangalore.pdf
Shapoorji Pallonji Parkwest Sequoia Tower Bangalore.pdf
 
The Omaxe State Dwarka Delhi-broucher.pdf.pdf
The Omaxe State Dwarka Delhi-broucher.pdf.pdfThe Omaxe State Dwarka Delhi-broucher.pdf.pdf
The Omaxe State Dwarka Delhi-broucher.pdf.pdf
 
Call Girls in Sarai Kale Khan Delhi 💯Call Us 🔝8264348440🔝
Call Girls in Sarai Kale Khan Delhi 💯Call Us 🔝8264348440🔝Call Girls in Sarai Kale Khan Delhi 💯Call Us 🔝8264348440🔝
Call Girls in Sarai Kale Khan Delhi 💯Call Us 🔝8264348440🔝
 
Eco-Efficient Living: Redefining Sustainability through Leech's Green Design ...
Eco-Efficient Living: Redefining Sustainability through Leech's Green Design ...Eco-Efficient Living: Redefining Sustainability through Leech's Green Design ...
Eco-Efficient Living: Redefining Sustainability through Leech's Green Design ...
 

SF Home Market Report: Sales Rise Despite Pandemic Challenges

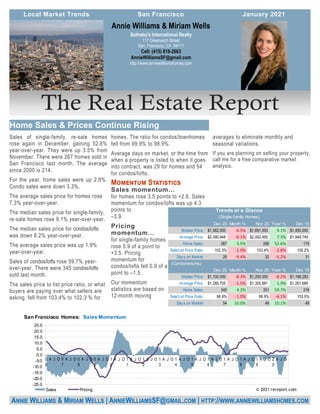
  • 1. averages to eliminate monthly and seasonal variations. If you are planning on selling your property, call me for a free comparative market analysis. Sales of single-family, re-sale homes rose again in December, gaining 52.6% year-over-year. They were up 3.5% from November. There were 267 homes sold in San Francisco last month. The average since 2000 is 214. For the year, home sales were up 2.8%. Condo sales were down 3.3%. The average sales price for homes rose 7.3% year-over-year. The median sales price for single-family, re-sale homes rose 9.1% year-over-year. The median sales price for condos/lofts was down 8.2% year-over-year. The average sales price was up 1.9% year-over-year. Sales of condos/lofts rose 59.7% year- over-year. There were 345 condos/lofts sold last month. The sales price to list price ratio, or what buyers are paying over what sellers are asking, fell from 103.4% to 102.3 % for homes. The ratio for condos/townhomes fell from 99.9% to 98.9%. Average days on market, or the time from when a property is listed to when it goes into contract, was 29 for homes and 54 for condos/lofts. for homes rose 3.5 points to +2.6. Sales momentum for condos/lofts was up 4.3 points to –3.9. for single-family homes rose 0.9 of a point to +3.5. Pricing momentum for condos/lofts fell 0.9 of a point to –1.5. Our momentum statistics are based on 12-month moving Sotheby's International Realty 117 Greenwich Street San, Francisco, CA 94111 Cell: (415) 819-2663 AnnieWilliamsSF@gmail.com http://www.anniewilliamshomes.com Annie Williams & Miriam Wells ANNIE WILLIAMS & MIRIAM WELLS | ANNIEWILLIAMSSF@GMAIL.COM | HTTP://WWW.ANNIEWILLIAMSHOMES.COM Dec 20 Month % Nov 20 Year % Dec 19 Median Price: 1,582,000$ -6.5% 1,691,500$ 9.1% 1,450,000$ Average Price: 2,090,948$ -0.1% 2,092,465$ 7.3% 1,948,749$ Home Sales: 267 3.5% 258 52.6% 175 Sale/List Price Ratio: 102.3% -1.0% 103.4% -2.8% 105.2% Days on Market: 29 -9.4% 32 -5.2% 31 (Condominiums) Dec 20 Month % Nov 20 Year % Dec 19 Median Price: 1,100,000$ -8.3% 1,200,000$ -8.2% 1,198,283$ Average Price: 1,285,705$ -1.5% 1,305,881$ 1.9% 1,261,689$ Home Sales: 345 4.2% 331 59.7% 216 Sale/List Price Ratio: 98.9% -1.0% 99.9% -4.1% 103.0% Days on Market: 54 10.0% 49 10.1% 49 Trends at a Glance (Single-family Homes) -25.0 -20.0 -15.0 -10.0 -5.0 0.0 5.0 10.0 15.0 20.0 25.0 0 6 A J O 0 7 A J O 0 8 A J O 0 9 A J O 1 0 A J O 1 1 A J O 1 2 A J O 1 3 A J O 1 4 A J O 1 5 A J O 1 6 A J O 1 7 A J O 1 8 A J O 1 9 A J O 2 0 A J O San Francisco Homes: Sales Momentum Sales Pricing © 2021 rereport.com
  • 2. December 31, 2020 -- A year ago, when the calendar first turned to 2020, it's a fair bet that no one could see what was coming, or know how profoundly one little germ could change our lives. The coronavirus outbreak, epidemic and then pandemic upended everything across the globe, and even as we strive for a semblance of normalcy, it's not done yet just yet. You'll be able to witness the latest effects this evening, as normally-packed live celebrations of the change of year in cities around the world will be thin- ner, remotely generated and socially-distanced. "On January 1, 2021, for the first time every, hindsight will actually be 2020", according to a popular internet meme, and there's little doubt that many people will be happy to see it go. With one country after another closing, and uncer- tainty and risks skyrocketing, investors got spooked and came to a point of selling everything to move to cash; interest rates spiked, financial markets became unhinged and central banks across the world moved into emergency positions, slashing rates, buying bonds and opening up new lending and market- support facilities, moving to liquefy every market and be the buyer of last resort for a range of assets if need be. The market panic was quelled, and a de- pression likely averted. Lockdowns ensured that the economies of many countries would fall into record- setting recession for a time, only to quickly (if partial- ly) emerge. As they did, unprecedented opportunities arose for homeowners. For those in difficult straits, and with the experience of at least some lessons learned in the last housing bust, a nearly instant forbearance program for homeowners was released, and without even the burden of proof of hardship. Millions signed up; a core of the most troubled homeowners (numbering about 2.8 million) yet remain in forbear- ance. For others who experienced no payment trou- bles, opportunities to refinance at record low rates -- multiple times -- appeared. Freddie Mac's formal all- time low for a conforming 30-year (3.31%) FRM was touched in mid-April, broken by the end of the of the month a new record low was set in 17 weeks since then, falling to as low 2.66% near the end of the year. Potential homebuyers took notice, too. The year began with an early start on the spring homebuying season with a solid winter showing for sales, but that came to a relative standstill in March through May, only to revive with vigor and then some as the econo- (Continued on page 4) ANNIE WILLIAMS & MIRIAM WELLS SOTHEBY'S INTERNATIONAL REALTY ANNIEWILLIAMSSF@GMAIL.COM The chart above shows the National month- ly average for 30-year fixed rate mortgages as compiled by http:// 1.0% 2.0% 3.0% 4.0% 5.0% 6.0% 01-10 07-10 01-11 07-11 01-12 07-12 01-13 07-13 01-14 07-14 01-15 07-15 01-16 07-16 01-17 07-17 01-18 07-18 01-19 07-19 01-20 07-20 30-Year Fixed Mortgage Rates Unit Median Average Sales DOM SP/LP Median Average Sales Median Average Sales San Francisco $1,582,000 $2,090,948 267 29 102.3% 9.1% 7.3% 52.6% -6.5% -0.1% 3.5% D1: Northwest $2,050,000 $2,380,244 20 43 102.4% 17.1% 24.4% 25.0% -7.3% -33.8% -16.7% D2: Central West $1,534,500 $1,617,456 44 23 112.7% 10.8% 10.0% 69.2% -1.6% -0.1% 0.0% D3: Southwest $1,305,000 $1,210,964 17 28 105.1% 16.0% 0.9% 6.3% -9.2% -25.1% 70.0% D4: Twin Peaks $1,700,000 $1,770,724 33 22 104.4% 4.6% -3.7% 57.1% 0.0% -0.5% -31.3% D5: Central $2,225,000 $2,392,533 42 32 101.8% -13.6% -8.5% 90.9% -10.1% -13.4% 0.0% D6: Central North $2,250,000 $2,568,000 7 23 102.8% -24.5% -8.7% 16.7% -1.1% 12.9% 250.0% D7: North $5,247,500 $6,226,770 20 60 93.4% 14.1% -3.6% 185.7% 7.1% 10.6% 122.2% D8: Northeast $2,520,000 $2,520,000 1 137 100.9% -59.4% -62.5% -66.7% 38.6% 38.3% -66.7% D9: Central East $1,627,500 $1,749,837 32 21 105.2% 11.3% 11.7% 100.0% -4.8% -5.2% 6.7% D10: Southeast $1,100,000 $1,156,418 51 24 106.8% 3.5% 4.3% 27.5% 10.6% 9.2% 10.9% December Sales Statistics (Single-family Homes) Prices Yearly Change Monthly Change 0 50 100 150 200 250 300 350 $300 $800 $1,300 $1,800 $2,300 1 0 A J O 1 1 A J O 1 2 A J O 1 3 A J O 1 4 A J O 1 5 A J O 1 6 A J O 1 7 A J O 1 8 A J O 1 9 A J O 2 0 A J O San Francisco Homes: Sold Prices & Unit Sales (3-month moving average — $000's) Ave Med Units © 2021 rereport.com
  • 3. ANNIE WILLIAMS & MIRIAM WELLS SOTHEBY'S INTERNATIONAL REALTY ANNIEWILLIAMSSF@GMAIL.COM Unit Median Average Sales DOM SP/LP Median Average Sales Median Average Sales San Francisco $1,100,000 $1,285,705 345 54 98.9% -8.2% 1.9% 59.7% -8.3% -1.5% 4.2% D1: Northwest $1,160,000 $1,167,421 19 46 101.7% 0.9% 0.4% 72.7% -22.0% -31.2% -20.8% D2: Central West $1,020,000 $1,075,417 7 54 99.3% -25.8% -17.6% 75.0% -25.1% -17.1% 16.7% D3: Southwest $738,000 $891,000 3 27 98.6% -10.4% 7.0% -25.0% -36.4% -14.9% -40.0% D4: Twin Peaks $700,000 $699,800 5 61 100.7% -11.7% -12.9% -58.3% -13.9% -19.0% -58.3% D5: Central $1,350,000 $1,341,713 59 47 101.7% -10.0% -15.7% 78.8% 7.4% 1.8% 3.5% D6: Central North $1,130,000 $1,117,937 43 48 100.8% 10.5% -3.6% 138.9% -8.0% -3.7% -14.0% D7: North $1,507,500 $1,782,229 38 54 97.9% -3.5% 1.6% 72.7% -6.7% -1.1% -9.5% D8: Northeast $962,500 $1,308,324 43 60 97.4% -12.5% 14.2% 13.2% -19.0% -3.4% 22.9% D9: Central East $1,050,000 $1,286,481 115 57 97.4% -4.5% 7.1% 79.7% 2.4% 12.1% 26.4% D10: Southeast $700,000 $607,807 6 82 98.1% 1.7% -7.9% 20.0% -23.9% -33.9% 200.0% December Sales Statistics (Condos/TICs/Co-ops/Lofts) Prices Yearly Change Monthly Change 80.0% 85.0% 90.0% 95.0% 100.0% 105.0% 110.0% 115.0% 120.0% 1 0 A J O 1 1 A J O 1 2 A J O 1 3 A J O 1 4 A J O 1 5 A J O 1 6 A J O 1 7 A J O 1 8 A J O 1 9 A J O 2 0 A J O San Francisco Homes: Sales Price to List Price Ratio © 2020 rereport.com -50.0 -40.0 -30.0 -20.0 -10.0 0.0 10.0 20.0 30.0 40.0 0 6 A J O 0 7 A J O 0 8 A J O 0 9 A J O 1 0 A J O 1 1 A J O 1 2 A J O 1 3 A J O 1 4 A J O 1 5 A J O 1 6 A J O 1 7 A J O 1 8 A J O 1 9 A J O 2 0 A J O San Francisco Condos/Lofts: SalesMomentum Sales Pricing © 2020 rereport.com 0 50 100 150 200 250 300 350 $300 $500 $700 $900 $1,100 $1,300 $1,500 1 0 A J O 1 1 A J O 1 2 A J O 1 3 A J O 1 4 A J O 1 5 A J O 1 6 A J O 1 7 A J O 1 8 A J O 1 9 A J O 2 0 A J O San Francisco Condos: Sold Prices & Unit Sales (3-month moving average — $000's) Ave Med Units © 2020 rereport.com
  • 4. Annie Williams & Miriam Wells Sotheby's International Realty 117 Greenwich Street San, Francisco, CA 94111 my re-opened through the summer. The delayed action of the spring market was joined by additional demand from second home buyers looking to es- cape to remote locations, away from virus and strife, and by buyers who could now work remotely and so no longer felt constricted by proximity to center-city workspaces. With competition for hous- es fierce and existing home prices rising sharply, it's also likely that some demand has been "advanced" from the coming year in order to grab a home before costs increased further. With the existing home market tight and expensive, and possibly with commuting to work far less of a concern, sales of new homes also enjoyed a strong period during the mid-part of 2020, but sales are settling back to a very solid (if less frenetic) trend as the year turns. Before a pandemic dip last spring, sales of new homes had been in a 10-year uptrend, and seem poised to return to that kind of steady, solid (if unspectacular) improvement now that the pandemic distortion in sales has cycled through. Existing home sales have started to cool a bit from heady annualized levels too, although that's to be expected as the winter months kick in. The spring- bumped-into-summer housing season has passed, and while there is still plenty of demand there is (Continued from page 2) little supply to be had, and even fewer homes are put up for sale once the onset of the extended holi- day (and then winter) season begins. The National Association of Realtors Pending Home Sales Index contracted again in November, declining by 2.6%, a third consecutive decline. Compared to a year ago, though, contract signings are still some 16.4% high- er, and if we weigh this change against sales levels last December/January, it looks like this will trans- late into a 6.25 million (or so) annualized rate of sale. October's 6.86 million (annual) was the recent peak, and sales are likely to continue to cool some- what until the next spring cycle kicks up again. -20.0% -10.0% 0.0% 10.0% 20.0% 30.0% 40.0% 50.0% 1 0 A J O 1 1 A J O 1 2 A J O 1 3 A J O 1 4 A J O 1 5 A J O 1 6 A J O 1 7 A J O 1 8 A J O 1 9 A J O 2 0 A J O San Francisco Homes: Year-Over-Year Median Sales Price Change © 2020 rereport.com