Annie Williams Real Estate Report - Dec 2015
•
0 likes•48 views

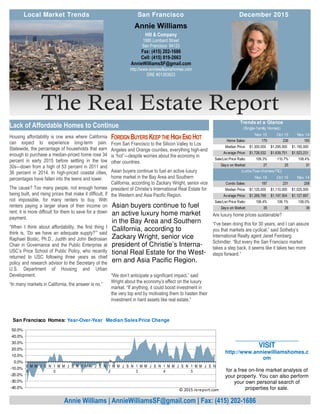
- Housing affordability in California is expected to experience long-term issues due to high home prices, not enough homes being built, and rising rents making it difficult for many to save for a down payment. - In many California markets, including the San Francisco Bay Area and Southern California, the luxury home market remains active with Asian buyers continuing to fuel demand. However, overall home sales are down while prices continue rising. - A lack of housing inventory is seen as a key factor sustaining high home prices in San Francisco, with the median home price rising 13% year-over-year and staying over $1 million for most of the past two years.

Recommended
Recommended
More Related Content
What's hot
What's hot (20)
Viewers also liked
Viewers also liked (20)
Similar to Annie Williams Real Estate Report - Dec 2015
Similar to Annie Williams Real Estate Report - Dec 2015 (20)
Recently uploaded
Recently uploaded (20)
Annie Williams Real Estate Report - Dec 2015
- 1. The Real Estate Report Are luxury home prices sustainable? “I’ve been doing this for 30 years, and I can assure you that markets are cyclical,” said Sotheby’s International Realty agent Janet Feinberg Schindler. “But every the San Francisco market takes a step back, it seems like it takes two more steps forward.” Housing affordability is one area where California can expect to experience long-term pain. Statewide, the percentage of households that earn enough to purchase a median-priced home rose 34 percent in early 2015 before settling in the low 30s—down from a high of 53 percent in 2011 and 36 percent in 2014. In high-priced coastal cities, percentages have fallen into the teens and lower. The cause? Too many people, not enough homes being built, and rising prices that make it difficult, if not impossible, for many renters to buy. With renters paying a larger share of their income on rent, it is more difficult for them to save for a down payment. “When I think about affordability, the first thing I think is, ‘Do we have an adequate supply?’” said Raphael Bostic, Ph.D., Judith and John Bedrosian Chair in Governance and the Public Enterprise at USC’s Price School of Public Policy, who recently returned to USC following three years as chief policy and research advisor to the Secretary of the U.S. Department of Housing and Urban Development. “In many markets in California, the answer is no.” FOREIGN BUYERS KEEP THE HIGH END HOT From San Francisco to the Silicon Valley to Los Angeles and Orange counties, everything high-end is “hot”—despite worries about the economy in other countries. Asian buyers continue to fuel an active luxury home market in the Bay Area and Southern California, according to Zackary Wright, senior vice president of Christie’s International Real Estate for the Western and Asia Pacific Region. “We don’t anticipate a significant impact,” said Wright about the economy’s effect on the luxury market. “If anything, it could boost investment in the very top end by motivating them to hasten their investment in hard assets like real estate.” Hill & Company 1880 Lombard Street San Francisco 94123 Fax: (415) 202-1686 Cell: (415) 819-2663 AnnieWilliamsSF@gmail.com http://www.anniewilliamshomes.com DRE #01393923 Annie Williams Annie Williams | AnnieWilliamsSF@gmail.com | Fax: (415) 202-1686 Lack of Affordable Homes to Continue Nov 15 Oct 15 Nov 14 Home Sales: 179 236 193 Median Price: 1,300,000$ 1,295,000$ 1,150,000$ Average Price: 1,728,532$ 1,639,751$ 1,523,231$ Sale/List Price Ratio: 109.3% 110.7% 108.4% Days on Market: 27 25 31 Nov 15 Oct 15 Nov 14 Condo Sales: 197 231 208 Median Price: 1,125,000$ 1,110,000$ 1,025,000$ Average Price: 1,269,799$ 1,197,504$ 1,127,697$ Sale/List Price Ratio: 106.4% 109.1% 106.0% Days on Market: 35 26 39 (Lofts/Tow nhomes/TIC) Trends at a Glance (Single-family Homes) -40.0% -30.0% -20.0% -10.0% 0.0% 10.0% 20.0% 30.0% 40.0% 50.0% 0 9 M M J S N 1 0 M M J S N 1 1 M M J S N 1 2 M M J S N 1 3 M M J S N 1 4 M M J S N 1 5 M M J S N San Francisco Homes: Year-Over-Year Median SalesPrice Change © 2015 rereport.com _____________________ VISIT http://www.anniewilliamshomes.c om for a free on-line market analysis of your property. You can also perform your own personal search of properties for sale. Local Market Trends December 2015San Francisco Asian buyers continue to fuel an active luxury home market in the Bay Area and Southern California, according to Zackary Wright, senior vice president of Christie’s Interna- tional Real Estate for the West- ern and Asia Pacific Region.
- 2. Home Prices Up, Sales Down The median price for single-family, re-sale homes in San Francisco rose 13% year-over-year last month. The median home price was higher than the year before for the forty-third month in a row. The median home price has stayed over $1MM for nineteen of the past twenty-one months. The sales prices to list price ratio has been over 100% since March 2012.. Lack of inventory is still problematic and will continue to power the San Francisco market upwards. November Market Statistics The median price for homes was up 0.4% month- over-month. The average price was up 13.5% from last year. Home sales were off 7.3% compared to last Novem- ber. Year-to-date, home sales are down 5.2%. Homes are taking an average of 27 days to sell. Sales momentum… for homes rose 1.1 points to –6.0. Sales momentum for condos/lofts gained two points to –14.7. Pricing momentum… for single-family homes was off 0.3 of a point to +13.4. Pricing momentum for condos/lofts dropped 0.9 of a point to +13.1. Condo/Loft Statistics The median price was up 1.4% from October. Year- over-year, the median price was up 9.8%. Condo/loft sales were down 5.3% compared to last November. Year-to-date, condo sales are down 14.6%. The sale price to list price ratio stayed over 100% for the forty-fourth month in a row: 106.4%. This is an extraordinarily tough market for buyers. It's important to be calm and realistic. If you don't know what to do or where to begin, give me a call and let's discuss your situation and your options. 3.0% 4.0% 5.0% 6.0% 7.0% 8.0% 01-08 04-08 07-08 10-08 01-09 04-09 07-09 10-09 01-10 04-10 07-10 10-10 01-11 04-11 07-11 10-11 01-12 04-12 07-12 10-12 01-13 04-13 07-13 10-13 01-14 04-14 07-14 10-14 01-15 04-15 07-15 10-15 30-Year Fixed Mortgage Rates Unit Median Average Sales DOM SP/LP Median Average Sales Median Average Sales San Francisco 1,300,000$ 1,728,532$ 179 27 109.3% 13.0% 13.5% -7.3% 0.4% 5.4% -24.2% D1: Northwest 1,580,000$ 1,947,000$ 8 31 106.4% 12.9% 14.8% -55.6% 6.2% 14.6% -66.7% D2: Central West 1,182,500$ 1,214,433$ 24 25 117.7% 12.9% 7.1% -33.3% 3.0% 8.6% -41.5% D3: Southwest 780,000$ 886,533$ 15 22 112.2% 2.3% 12.0% 25.0% -25.9% -18.9% -16.7% D4: Twin Peaks 1,400,000$ 1,540,143$ 37 24 112.1% 18.6% 23.0% 12.1% -13.3% -8.2% 0.0% D5: Central 1,805,000$ 2,305,875$ 28 22 109.8% 4.6% 11.8% -3.4% -3.7% -0.1% 3.7% D6: Central North 3,737,500$ 3,695,000$ 4 47 104.3% 133.6% 130.9% 100.0% 77.6% 81.6% -33.3% D7: North 5,410,000$ 5,461,667$ 9 35 102.3% 37.0% 6.3% -18.2% 11.5% 2.2% -10.0% D8: Northeast 3,990,000$ 3,990,000$ 2 12 114.1% n/a n/a n/a -46.4% -46.4% 0.0% D9: Central East 1,220,000$ 1,474,714$ 21 29 106.1% 6.1% 7.5% -8.7% -12.9% 1.1% -22.2% D10: Southeast 830,000$ 869,452$ 31 33 113.1% 16.5% 21.1% 10.7% 2.9% 5.1% -29.5% November Sales Statistics (Single-family Homes) Prices Yearly Change Monthly Change 0 50 100 150 200 250 300 350 $300 $500 $700 $900 $1,100 $1,300 $1,500 $1,700 $1,900 0 9 M M J S N 1 0 M M J S N 1 1 M M J S N 1 2 M M J S N 1 3 M M J S N 1 4 M M J S N 1 5 M M J S N San Francisco Homes: Sold Prices & Unit Sales (3-month moving average — $000's) Ave Med Units © 2015 rereport.com Annie Williams http://www.anniewilliamshomes.co m Fax: (415) 202-1686 2 Local Market Trends | San Francisco | Market Statistics The chart above shows the National monthly average for 30-year fixed rate mort- gages as compiled by HSH.com. The aver- age includes mortgages of all sizes, includ- ing conforming, "expanded conforming," and jumbo. December 2015
- 3. Table Definitions _______________ Median Price The price at which 50% of prices were higher and 50% were lower. Average Price Add all prices and divide by the number of sales. SP/LP Sales price to list price ratio or the price paid for the property divided by the asking price. DOI Days of Inventory, or how many days it would take to sell all the property for sale at the current rate of sales. Pend Property under contract to sell that hasn’t closed escrow. Inven Number pf properties actively for sale as of the last day of the month. California REALTORS® disappointed FHFA did not increase Fannie Mae and Freddie Mac conforming loan limits LOS ANGELES (Nov. 25) – The CALIFORNIA ASSOCIATION OF REALTORS® (C.A.R.) today issued the following statement in response to the Federal Housing Finance Agency’s (FHFA) announcement to keep the 2016 maximum conforming loan limits for mortgages acquired by Fannie Mae and Freddie Mac at $417,000 on one-unit properties and a cap of $625,500 in high-cost areas. Loan limits were increased in Mon- terey, Napa, San Diego, and Sonoma counties: “C.A.R. is disappointed that the FHFA didn’t raise the Fannie Mae and Freddie Mac conforming loan limits for next year,” said C.A.R. President Ziggy Zicarelli. “Home prices in California have risen sharply over the past four years, yet conforming loan limits haven’t changed during that time. Not increasing the loan limits will hurt California’s housing market, further exacerbating housing affordability and preventing tens of thou- sands of California homebuyers from a chance at homeownership.” C.A.R. and the NATIONAL ASSOCIATION OF REALTORS® (NAR) both have long advocated for making higher conforming loan limits per- manent. As a result of C.A.R.’s and NAR’s efforts, cities with high me- dian home prices have benefited from a loan limit above the national conforming loan limit. The conforming loan limit determines the maximum size of a mortgage that government-sponsored enterprises (GSEs) Fannie Mae and Freddie Mac can buy or “guarantee.” Non-conforming or “jumbo loans” typically have tighter underwriting standards and carry higher mortgage interest rates than conforming loans, increasing monthly payments and hamper- ing the ability of families in California to purchase homes by making them less affordable. Unit Median Average Sales DOM SP/LP Median Average Sales Median Average Sales San Francisco 1,125,000$ 1,269,799$ 197 35 106.4% 9.8% 12.6% -5.3% 1.4% 6.0% -14.7% D1: Northwest 1,047,500$ 1,094,786$ 14 25 108.5% -11.1% -9.9% 75.0% -5.6% -3.2% 7.7% D2: Central West 787,500$ 1,068,333$ 3 45 110.8% 21.2% 35.6% -40.0% -32.6% 1.4% -50.0% D3: Southwest 1,029,897$ 979,910$ 4 23 104.0% 150.0% 137.8% 300.0% 45.2% 23.2% -50.0% D4: Twin Peaks 642,000$ 642,000$ 2 30 104.7% 3.5% -6.1% -60.0% -12.1% -12.0% -50.0% D5: Central 1,100,000$ 1,204,093$ 27 34 112.3% 0.9% 5.5% -6.9% -13.6% -7.0% -38.6% D6: Central North 1,225,000$ 1,326,241$ 17 25 114.4% 22.4% 36.1% -26.1% -4.9% 10.3% -34.6% D7: North 1,575,000$ 1,728,316$ 19 25 103.1% 18.2% 16.6% -38.7% -3.2% -2.0% -26.9% D8: Northeast 1,150,000$ 1,417,440$ 27 42 105.3% 14.4% 11.8% 0.0% 31.4% 46.1% -37.2% D9: Central East 1,115,000$ 1,204,503$ 82 39 104.1% 13.5% 10.3% 17.1% 10.4% 1.4% 43.9% D10: Southeast 740,000$ 740,000$ 2 28 115.9% 48.0% 52.7% -60.0% 1.0% 8.0% -50.0% November Sales Statistics (Condos/TICs/Co-ops/Lofts) Prices Yearly Change Monthly Change Annie Williams http://www.anniewilliamshomes.co m Fax: (415) 202-1686 Local Market Trends | San Francisco | 3 C.A.R. statement on 2016 FHFA loan limits 0 50 100 150 200 250 300 350 $300 $500 $700 $900 $1,100 $1,300 $1,500 0 9 M M J S N 1 0 M M J S N 1 1 M M J S N 1 2 M M J S N 1 3 M M J S N 1 4 M M J S N 1 5 M M J S N San Francisco Condos: Sold Prices & Unit Sales (3-month moving average — $000's) Ave Med Units © 2015 rereport.com -40.0% -30.0% -20.0% -10.0% 0.0% 10.0% 20.0% 30.0% 40.0% 50.0% 0 9 M M J S N 1 0 M M J S N 1 1 M M J S N 1 2 M M J S N 1 3 M M J S N 1 4 M M J S N 1 5 M M J S N San Francisco Homes: Year-Over-Year Median SalesPrice Change © 2015 rereport.com December 2015
- 4. THE REAL ESTATE REPORT San Francisco This Real Estate Report is published and copyrighted by http://rereport.com. Information contained herein is deemed accurate and correct, but no warranty is implied or given. Annie Williams Hill & Company 1880 Lombard Street San Francisco 94123 Go online to see the full report with the district by district breakdown: http://www.anniewilliamshomes.com -50.0 -40.0 -30.0 -20.0 -10.0 0.0 10.0 20.0 30.0 40.0 0 8 M M J S N 0 9 M M J S N 1 0 M M J S N 1 1 M M J S N 1 2 M M J S N 1 3 M M J S N 1 4 M M J S N 1 5 M M J S N San Francisco Condos/Lofts: SalesMomentum Sales Pricing © 2015 rereport.com -25.0 -20.0 -15.0 -10.0 -5.0 0.0 5.0 10.0 15.0 20.0 25.0 0 8 M M J S N 0 9 M M J S N 1 0 M M J S N 1 1 M M J S N 1 2 M M J S N 1 3 M M J S N 1 4 M M J S N 1 5 M M J S N San Francisco Homes: Sales Momentum Sales Pricing © 2015 rereport.com