Recommended

Recommended
More Related Content
Similar to Data_Visualization.pptx
Similar to Data_Visualization.pptx (20)
More from john6938
More from john6938 (20)
Recently uploaded
Recently uploaded (20)
Data_Visualization.pptx
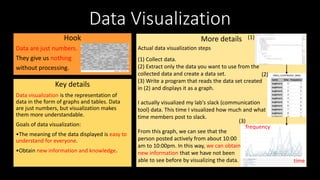
- 1. Data Visualization Hook Data are just numbers. They give us nothing without processing. Key details Data visualization is the representation of data in the form of graphs and tables. Data are just numbers, but visualization makes them more understandable. Goals of data visualization: •The meaning of the data displayed is easy to understand for everyone. •Obtain new information and knowledge. More details Actual data visualization steps (1) Collect data. (2) Extract only the data you want to use from the collected data and create a data set. (3) Write a program that reads the data set created in (2) and displays it as a graph. I actually visualized my lab's slack (communication tool) data. This time I visualized how much and what time members post to slack. From this graph, we can see that the person posted actively from about 10:00 am to 10:00pm. In this way, we can obtain new information that we have not been able to see before by visualizing the data. (1) (2) (3) frequency time