
Recommended
More Related Content
Similar to Maths.pptx
Similar to Maths.pptx (20)
More from john6938
More from john6938 (20)
Recently uploaded
Recently uploaded (20)
Maths.pptx
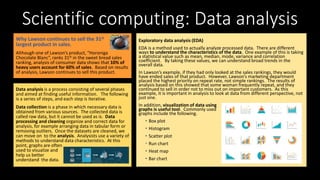
- 1. Data analysis is a process consisting of several phases and aimed at finding useful information. The following is a series of steps, and each step is iterative. Data collection is a phase in which necessary data is obtained from various sources. The collected data is called raw data, but it cannot be used as is. Data processing and cleaning organize and correct data for analysis, for example arranging data in tabular form or removing outliers. Once the datasets are cleaned, we can move on to the analysis. Analysists use a variety of methods to understand data characteristics. At this point, graphs are often used to visualize and help us better understand the data. Scientific computing: Data analysis Why Lawson continues to sell the 31st largest product in sales. Although one of Lawson’s product, “Horoniga Chocolate Blanc”, ranks 31st in the sweet bread sales ranking, analysis of consumer data shows that 10% of heavy users account for 60% of sales. Based on results of analysis, Lawson continues to sell this product. Exploratory data analysis (EDA) EDA is a method used to actually analyze processed data. There are different ways to understand the characteristics of the data. One example of this is taking a statistical value such as mean, median, mode, variance and correlation coefficient. By taking these values, we can understand broad trends in the overall data. In Lawson’s example, if they had only looked at the sales rankings, they would have ended sales of that product. However, Lawson’s marketing department placed the highest priority on repeat rate, not simple rankings. The results of analysis based on this showed that some woman frequently repeat, and they continued to sell in order not to miss out on important customers. As this example, it is important in analysis to look at data from different perspective, not just one. In addition, visualization of data using graphs is useful tool. Commonly used graphs include the following. ・Box plot ・Histogram ・Scatter plot ・Run chart ・Heat map ・Bar chart
- 2. Mathematical Foundation -Quantum Mechanics- Hook Everything around us is made of atoms. Atoms consist of elementary particles. Key details 1.Elementary particles have mysterious property. 2. Application of Quantum Mechanics More details 1.Quantum Mechanics is the study of observing the physical phenomena of its elementary particles. At first, we thought light was a wave, but when scientist shone light on metal, electrons popped out. Scientist think that this phenomena is light is wave and particle. This was the birth of the quantum mechanics. In short, elementary particles have two properties. It is very mysterious. 2.In fact, Quantum Mechanic of thinking is used in modern society. Using computer system from potential of elementary particles. So called “quantum computer”. Other ways, Used in laser technology applications.
- 3. Numerical Calculation Hook Numerical Calculation : To solve problems with computers. Key details • Mathematics • Physics • Meteorology More details • In mathematics field, calculations of differential, integral, Fourier transform and so on are possible. With these knowledge, this technique is applied to other fields. • In physics field, by numerical calculation, phenomenon of the real world can be simulated. For example, RLC circuit can be modeled with differential equation. • In meteorology field, numerical calculation is used to represent information such as temperature, air pressure, humidity by numerical values. By measuring these values and solving equation using these data, prediction of weather becomes possible.