
Recommended
Recommended
More Related Content
Similar to Usability engineeringHow to conduct User testing Week 4.docx
Similar to Usability engineeringHow to conduct User testing Week 4.docx (20)
More from jessiehampson
More from jessiehampson (20)
Recently uploaded
Recently uploaded (20)
Usability engineeringHow to conduct User testing Week 4.docx
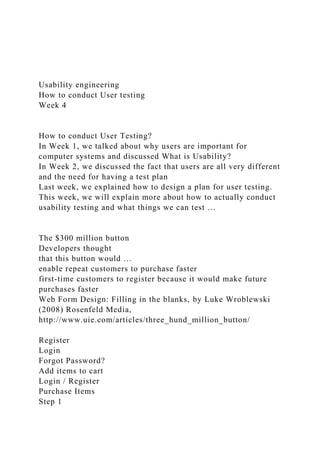
- 1. Usability engineering How to conduct User testing Week 4 How to conduct User Testing? In Week 1, we talked about why users are important for computer systems and discussed What is Usability? In Week 2, we discussed the fact that users are all very different and the need for having a test plan Last week, we explained how to design a plan for user testing. This week, we will explain more about how to actually conduct usability testing and what things we can test … The $300 million button Developers thought that this button would … enable repeat customers to purchase faster first-time customers to register because it would make future purchases faster Web Form Design: Filling in the blanks, by Luke Wroblewski (2008) Rosenfeld Media, http://www.uie.com/articles/three_hund_million_button/ Register Login Forgot Password? Add items to cart Login / Register Purchase Items Step 1
- 2. Step 2 Step 3 However, The usability test found … First timers Couldn’t remember if it was their first time Made multiple false attempts at login Felt the retailer was going to use their information to pester them Repeat customers Couldn’t remember which email/password they’d used Used the Forgot Password link if they could remember which email “I'm not here to enter into a relationship. I just want to buy something.” You do not need to create an account to make purchases on our site. Simply click Continue to proceed to checkout. To make your future purchases are even faster, you can create an account during checkout. Continue Login Forgot Password? Note: This is a representation of changes. Actual screenshots aren’t available because Spool did not reveal the company. The solution…
- 3. This lecture Content Before the test Pre- & post-questionnaires Conducting the Usability Test Roles: facilitator, observer and user How to record observations Report Writing From observations to recommendations Common Industry Report template Recruiting tips for user participants Avoid power users
- 4. They skew results If recruiting within your company … Don’t let users’ managers observe Follow up with schedule Send a clear and detailed confirmation; Make a confirmation call Screener questions Typically 20 questions Clear and specific, no jargon, exact dates, quantities, times Questions should not lead
- 5. “Are you bothered by ….” Every question should have a purpose Start with questions that screen out the most people. Screen participants Give reason for the session Feedback to help us improve the product Not a sales call Give length, date, location of session Offer incentives up front Explain video/audio taping, if it will occur
- 6. Go through screening questions if person is interested Having decided on the users to test …… Before the test… 24 hours before, check the following for yourself … Tasks can be completed Tasks are clear and understandable Materials are available Time allotted is appropriate Number of tasks is appropriate Nothing is overlooked: bugs, goof-ups If system is under development, check state of application
- 7. Pre- and post-test questionnaires Pre-test questionnaire Some of your screener questions Confirm that a participant fits a user profile Locates a participant with user profile ranges Include other characteristics / behaviour / attitudes that might be relevant to the Web site or tasks you are testing Web access from home / work / public computers Usage of competing / similar Web site How they prioritise their Web time Post-test questionnaire Find out how a participant feels about the site/software being tested Complements your measurements of efficiency and effectiveness Based on a standardised opinion questionnaire with a scoring system, plus open-ended questions Features you would like to see / do not like Produces a list of satisfying and unsatisfying site/software features – especially useful if testing is done during development
- 8. Perform Usability test How to measure it? Where to perform it? System usability scale (SUS) I think that I would like to use this system frequently. I found the system unnecessarily complex. I thought the system was easy to use. I think that I would need the support of a technical person to be able to use this system. I found the various functions in this system were well integrated. I thought there was too much inconsistency in this system. I would imagine that most people would learn to use this system very quickly. I found the system very cumbersome to use. I felt very confident using the system. I needed to learn a lot of things before I could get going with this system. https://measuringu.com/sus/ Brooke, J. (1996). SUS-A quick and dirty usability scale. In P. W. Jordan, B. Thomas, McClelland, & B. Weerdmeester (Eds.), Usability evaluation in industry (pp. 189–194). London, UK: Taylor & Francis. System usability scale (SUS) Likert scale Odd questions Subtract 1 from score Even questions
- 9. Subtract score from 5 Add scores, multiply by 2.5 disagree agree 1 2 3 4 5 System usability scale (SUS) Sauro points out SUS Scores are not percentages The average score is 68 http://www.measuringusability.com/sus.php Conducting usability tests Formal usability lab Facility design Low-traffic low-noise area or good sound insulation in walls Good acoustics and lighting Electrical, ventilation & ceiling requirements Double-pane two-way mirror System design Digital audio/video/screen-activity monitor/capture Event-logging software Editing system
- 10. Formal usability lab Advantages Provides a dedicated testing area Shows that management is supportive The technology impresses the developers Considerations It’s expensive Creates a bad image if not used regularly Can be intimidating for users Testing at the users’ site
- 11. When looking for contextual information: How do people work in their environment? What tools do people use? What is their work flow? If people use devices you don’t have in the lab: Highly-customized interfaces Assistive technology: screen magnifier / reader Unconventional work environment When users are difficult to schedule Logistical considerations OnsiteUsability LabAdvantagesNo lab set-up or installation to do
- 12. You test in the real situationEfficient Users travel, not you or your team More people can observe You can control the environmentChallengesSetting up the visits so they run smoothly Capturing information Is there a fast Internet connection there? Can't install Camtasia etc there Harder to take screen shotsSetting up or booking the lab Screen-recording software Camtasia [30-day trial] General screen activity and audio recording Mainly used to record instructions / demos Can use video editing software to inset Webcam video of user Morae [web demos] Special-purpose usability software
- 13. Automatically insets video of user in screen video Supports all stages of usability testing HyperCam [V2 free] Record Windows screen and sound CamStudio [Open source] Silverback [Mac, V2 free] Testing materials Screening questionnaire Orientation script Background questionnaire Data collection instruments (Data Loggers) Nondisclosure Agreement and Tape Consent Form Pre-test questionnaire Task scenarios Prerequisite training materials (optional) Post-test questionnaire Debriefing topics guide Testing procedure
- 14. Greeting/Consent Form/ Non-disclosure agreement Practising thinking aloud (familiarising with interface) Task 1 Task N Post Questionnaire / Interview Debriefing / Concluding Entry questionnaire ....... Encouraging thinking aloud Facilitator (Moderator) Greet and debrief Greet and debrief user
- 15. Offer drink and explain test procedures Get Get the user to sign consent forms questionnaires Ask clarification questions Give gift /cash Get Get users to interact with interface Encourage think aloud Ask appropriate questions to seek clarification Coaches the user to think aloud by asking questions Observe and take
- 16. Observe and take notes (active listening) Control Control the session prevent observer interruptions Asks for questions from observers towards the end Written copy of the task? For If task is asking participant to find something with a difficult spelling it would be better to give instruction on a task card. Allows them to reflect back/re-read the task. Get them in the mood. Cognitive load increase by not giving them written task. Against if using a physical object it’s better to engage in a form of role play to make the task more like how it would be done in the real world What if they are vision-impaired? Dumas (p177) Facilitating - What to do
- 17. Acknowledge the unnatural situation Remain neutral Don’t give any clues as to where the user should go next Don’t ask leading questions If the user doesn’t use a feature you’re interested in: “Could you go back and try it this way?” Give subtle acknowledgements “Uh huh”, “ok”, nod Don’t enthuse when they find the answer Avoid explaining or defending the interface
- 18. Avoid answering questions or helping the user too early Don’t show the user how to complete the task, except in the debriefing at the end of the session Facilitating - What to do Don't ask "how was your day? - a pseudo-relationship skews the test Let the user explore for 5-10 minutes - then give the first specific task Take notes even when nothing is happening - If you stop writing, the user will stop talking Listen actively and be aware of the user's body language If prototype is unstable -Tell user not to worry, you will guide them through parts that don’t work
- 19. Minimise distractions - Hide equipment, clear the desktop Manage observers During the test Focus on user's immediate experience, not extrapolation: Don't ask users to predict the future Non-judgmental Focus on a single topic Open-ended, not binary What would you do … if …?
- 20. The user is uncomfortable being video/audio recorded The user is uncomfortable signing the non-disclosure forms The user starts to blame her/himself The user doesn’t fit the right profile Observing - what to do Be quiet Observers take notes, and give these to the facilitator after each session As facilitator, you want them to have something to do They feel involved You get more data Observers may participate in debriefing the users User – What to do The user Signs consent forms Completes pre & post Questionnaires Interacts with the interface Attempts to complete tasks Thinks aloud
- 21. Think-aloud protocol Preparation Explain the difference between explaining and thinking aloud Emphasise the need for continuous verbalisation Practice! Given an example Not perfect Feels weird Thinking aloud may alter behaviour Disrupts concentration
- 22. Think-aloud alternatives Pairs of users Working together people will discuss and talk Disadvantages Pairs will talk less if they know each other Twice as expensive Retrospective Think-Aloud Review and discuss video with the user Allows you to record ‘time on task’ Useful in eye-tracking studies
- 23. Recording observations Pen & paper notes Prepared forms can help Audio recording For think-aloud Video recording Often two cameras, one for user’s face, one for screen Good for closed-circuit view by observers in another room Generates much data Screen recording software
- 24. Software logging Eye tracker Using pen & paper Get to know the site really well Try to find different ways to do the tasks Do a trial user test What measurable outcomes can you record? #clicks, order of choices, etc. Develop shorthand symbols that you will use
- 25. Identify pages, menus, page areas, links, etc. Identify actions: ^ = click, b = back, ~ = scan, etc. Idea Print screen shots (perhaps several per page) to mark the path the user takes Tips for taking notes Create completion codes SCCXGUSTSuccessfully CompletedCompleted, wrong answer or guessed answerDid not complete task (Gave Up)Task stopped by facilitator These examples were provided by Scott Rippon Keys for note taking Observation key (!): Issue “”: Quote (P): Facilitator prompted (Q): Participant question (IDEA): Design idea Recording user path
- 26. └> Link name: Clicked a link Blah: Filled in text box [Button]: Clicked a button [✓]: Checked checkbox (●): Selected radio button These examples were provided by Scott Rippon From observations to recommendations Transcribing notes Different ways of recording notes Sequential observations (by time) Global observations (by task) Sequential observations By timeTimePage NameObservationsCommentsIssues (write this later)08:07:19XSelect an item“this looks interesting”08:09:20XPut the item into shopping cart08:10:00XClick “check out”08:10:56YRemove an itemError “Why can’t I simply remove this item? Oh, no, I have to restart the whole process again”
- 27. Global observations (by task) Task 2 – Join a network You would like to join a group of professionals in your area. Task Discussion questions: Is this something you would be professionally interested in doing? What are some of the reason/things you would like to do by joining this group? Task Answer: ACME Online > ACME Networks > Browse/Search for group > Join Group How would you go about doing this? Global observations (by task) After the usability sessions transcribe your observations into a spread sheet TaskPilot ParticipantParticipant 1Participant 22Tried to find
- 28. groups in global nav options. “Doesn’t come up.” Looked in Networks and Resources > Links to find.Looked in ‘Networks’ > ‘Upcoming Network Meetings’ first. “Try that” “Browse through these” Would send email to RSVP address to ask to join group.Looked in Networks menu then clicked the Find a Network Meeting link on home page. Networks listing: “Not intuitive list” “Don’t seem to be sorted.” “Don’t get it.” “Feel a bit flat”3Would contact ACME and ask to have details forwarded on. Looked in ‘About ACME’, ‘Networks’, ‘Resources’ and ‘Contact’. Did not think to sign in and look in members area. Idea: Could link to ‘Find a mental health professional’ on Contacts page.Speed: “Very slow”Member listing: “This alphabetical order is f****d!” Advanced search link: Accidentally clicked ‘Advanced search’ link to submit search. Collating task completion results Group issues into themes
- 29. How scores & themes contribute Report writing Purposes of reports A report makes findings understandable and actionable Presents issues and usable designs in a simple format Has necessary and important information Is available in a timely manner Should include quotes; could embed video clips A report is a historical document A report can be impressive: a fat consulting document Be succinct
- 30. “Brevity is the sole of wit” – Shakespeare “Omit needless words” – Strunk All writers will have to edit their prose, but the great writers edit it viciously, always trying to eliminate words which are ‘fuzz’ – excess words which are not adding anything of value. Zinsser compares the process of editing out ‘fuzz’ to fighting weeds – you will always be slightly behind because they creep in when you aren’t looking for them. One of my pet hates is the word ‘also’. If you search and replace all instances of this word you will find you can live without it and your writing will improve instantly. Likewise the word ’very’. De-clutter your writing All writers edit their prose, but great writers edit viciously. The point of editing is to eliminate ‘fuzz’, or excess words which don’t add value. Zinsser compares removing ‘fuzz’ to fighting weeds – you will always be slightly behind. Two examples of fuzz are ‘also’ and ‘very’. Work at keeping them out of your text and your writing will improve. Example from Ingur Mewburn (RMIT) http://thethesiswhisperer.wordpress.com/2010/11/04/5-ways-to- declutter-your-writing a book review of ‘On writing well: the classic guide to writing non fiction’ by William Zinsser Who is your audience?
- 31. In this course: Lecturer and tutors, other students who may take this subject in future (only if you give permission), maybe future employers In industry your clients may be: Engineers Designers Project managers Principal investigators (other researchers) Knowing your audience Who is getting (this version of) the report? What are their immediate/long term goals? What do they know? What do they need to know?
- 32. What are they expecting to get from you? Common industry format Title Page Executive Summary Introduction Method Results Appendices Common industry format Title Page Executive Summary Introduction Method Results Appendices
- 33. Product (and version, if necessary) tested Test: who led it, and when Report: date, author, and author contact info Customer company and contact person Common industry format Title Page Executive Summary Introduction Method Results Appendices Name and brief description of the product Brief summary of method(s) including number(s) and type(s) of participants and tasks. Reason for and nature of the test. Summary of results Common industry format Title Page Executive Summary Introduction Method Results Appendices
- 34. Full product description Context of use (e.g. users, tasks, equipment, environment) Test objectives Common industry format Title Page Executive Summary Introduction Method Results Appendices Participants: who did we work with? Context: what tasks tested, where, & when Experimental design: how was it tested? How are data collected? Metrics: how did we evaluate effectiveness/efficiency/satisfaction? Common industry format Title Page Executive Summary Introduction Method Results Appendices What did we learn?
- 35. Tables, charts, photographs Perhaps recommendations Common industry format Title Page Executive Summary Introduction Method Results Appendices Full text of questionnaires Interview protocols Extra detail on research context, if necessary User Quotes Journalists looking for car photos “You get the feeling that some 20-year-old was given all this money and they were told to make it slick … If you’re having a mid-life crisis, this is the place to go.” “It looks like a bunch of dog dishes” [overlapping BMW wheel covers] Creating a convincing report Acknowledge limitations
- 36. What are the limitations of the test design? What are the data collection problems? What are the limitations of the analysis? Especially quantitative analysis Communicating results Involve and acknowledge all team members Ask for their input Foster inclusiveness in presentation Don’t have surprises Avoid opinions; stick to facts Be positive and proactive Let’s look at an example Common usability problem
- 37. Three different ways of wording the recommendation Writing recommendations Problem: Credit card images: the icons in the right hand side (above the CardHolder field) appear clickable, but they are just meant to indicate what cards are acceptable. From: Molich, Jeffries and Dumas (2007). Making Usability Recommendations Useful and Usable. Journal of Usability Studies Vol. 2, pp. 162-179 Recommendation #1 From: Molich, Jeffries and Dumas (2007). Making Usability Recommendations Useful and Usable. Journal of Usability Studies Vol. 2, pp. 162-179 “Checkout: credit card icons look clickable. Some users may be inclined to click on the credit card icons to specify which card they are using. Suggested solution: Change the visual presentation to discourage this unnecessary behaviour. Usefulness rating 5.0, Usability rating 1.0
- 38. This advice is vague. Several teams were vague about how the appearance of a selected icon would be different from a non- selected one.” Recommendation #2 From: Molich, Jeffries and Dumas (2007). Making Usability Recommendations Useful and Usable. Journal of Usability Studies Vol. 2, pp. 162-179 “Credit card icons cause users to feel they must select one for a successful transaction. Several users felt that they had to click on the proper credit card icon for a successful reservation. When nothing happened upon clicking the icon, users assumed that something was broken. One user actually typed the credit card name in the ‘CardHolder’ text input box because she felt that was what clicking on a CC icon should do (she thought it was just broken). Suggestion: The icons appear to serve no purpose. If this is the case, they should be removed so as to avoid any confusion. Usefulness rating 1.3, Usability rating 5.0 The above assumption is incorrect. The icons inform users of which credit cards are accepted by the hotel. On the other hand,
- 39. the recommendation (‘remove icons’) is very precise and actionable.” Recommendation #3 From: Molich, Jeffries and Dumas (2007). Making Usability Recommendations Useful and Usable. Journal of Usability Studies Vol. 2, pp. 162-179 “Form – credit card icons Credit card icons are not clickable, but most people tried to set card. People are used to providing the card type along with the number and expiration date. It is not widely known that card type is redundant. Suggestion: To make this display fit the mental model of the user, it would be good if the icon reacted like buttons. These “buttons” need not work on the back side but would help the user. Usefulness rating 5.0, Usability rating 4.3” Presentation ideas
- 40. Creative visualization makes data memorable Techniques Quotes from report Annotated screenshots Videos (brief) Photographs Charts and graphs References Kuniavsky, M. (2003), “Creating Tasks”, Observing the User Experience, Morgan Kaufmann, San Francisco. Pages 270-275. Dumas, J., Redish, J. (1999), “12. Creating task scenarios”, A Practical Guide to Usability Testing, Intellect Ltd., Exeter. Pages 171-182.
- 41. Usability Engineering Tutorial: Week 4 Discussion topics (think about in your own time) Ethical issues • What are your ethical obligations when conducting usability testing? • What ethical issues do you need to consider in terms of data collection, use and storage? • What ethical obligations do you have towards the treatment of a user? • Video: who and how should the video be consumed? Writing tasks • What are some of the characteristics of a good task? Facilitating • What are the characteristics/skills a good facilitator should have? Task 1 – Choose users and design screeners Consider website you’ve chosen for Assignment 1 Part 2 and: • Brainstorm and write down the key users for your website
- 42. • Compile a list of questions that would help a recruiter screen for the right users • Discuss your questions with another team Task 2 – Templates and usability documentation • Check out templates for usability documentation. Some sources are: o https://www.usability.gov/how-to-and- tools/resources/templates.html o http://www.sensible.com/downloads-rsme.html which is the book website for Rocket Surgery Made Easy by Steve Krug • Locate the SUS online and look at https://measuringu.com/sus/ Task 3- Task Analysis and Scenario Writing Part 1 • Identify testing goals, objectives and user profiles for your chosen website Tutorial learning objectives Through participating in this tutorial you should learn: • Ethics - be aware of the ethical considerations required in usability testing • Usability testing - know what it is and the different types
- 43. • Usability testing documents – be aware and understand the purpose of the following documents: o Proposal o Research Plan o Recruiter/participant pack ▪ Recruitment screener • Facilitators’ script • Consent form • Writing tasks and scenarios Part 2 Write tasks and develop scenarios for each of the tasks. You will need to consider the following questions for each of your tasks: • How does it help answer the goal / objective? • Why does the user need to perform the task? • Is the task reliant on any other tasks? • How long will it take for the user to perform the task?
- 44. • How might the user try to complete the task? • Does the computer/website/application need to be at a certain starting point before the task can begin? • How will you know that the task has been completed successfully? How will you measure it? Tasks can be documented in a tabular format: Objective Can user find salary information on payscale? Scenario You have been told about an entry –level software developer job in Melbourne which pays $55k to $65k. You are thinking about applying but want to know if the pay is appropriate for the industry. Using www.payscale.com how would you confirm this is industry standard? Dependencies None Estimated Length 2-5 minutes Possible
- 45. Solution • Arrive on the home page. Click on the following.Pay the right way->Personal- >Career research -> Employer & Job search. • Change country to Australia • Start your search – choose job from the first drop down and enter software developer in the search box • Refine the search by selecting the city as Melbourne and experience as Entry-level Starting Point http://www.payscale.com Measuring Success User finds the median pay for a developer on
- 46. payscale and determines that the average pay is within the pay that was offered. When you give a task to a user you only include the scenario. It would look something like this: Task 1: You have been told about an entry –level software developer job in Melbourne which pays $55k to $65k. You are thinking about applying but want to know if the pay is appropriate for the industry. Using www.payscale.com how would you confirm this is industry standard? Part 3 Feedback time! Ask your neighbour for feedback
- 47. Further resources • Dumas, J., Redish, J. (1999), A Practical Guide to Usability Testing, Intellect, Ltd. • Kuniavsky, M (2012), Observing the user experience, Morgan Kaufmann, San Francisco. Ch.11 p.275- 307. • Jarrett, C., Stone, D., Woodroffe, M. (2005), User Interface Design and Evaluation, Morgan Kaufmann, San Francisco. Part 4 p.419-558 and Ch.8 p.563-584. Correlations among Prototypical Usability Metrics: Evidence for the Construct of Usability Jeff Sauro Oracle Corporation 1 Technology Way, Denver, CO 80237 [email protected]
- 48. James R. Lewis IBM Software Group 8051 Congress Ave, Suite 2227 Boca Raton, FL 33487 [email protected] ABSTRACT Correlations between prototypical usability metrics from 90 distinct usability tests were strong when measured at the task-level (r between .44 and .60). Using test-level satisfaction ratings instead of task-level ratings attenuated the correlations (r between .16 and .24). The method of aggregating data from a usability test had a significant effect on the magnitude of the resulting correlations. The results of principal components and factor analyses on the prototypical usability metrics provided evidence for an underlying construct of general usability with objective and subjective factors. Author Keywords usability measurement, usability metrics, principal components analysis, correlation, PCA, factor analysis, FA ACM Classification Keywords H5.2. Information interfaces and presentation: User
- 49. Interfaces – Evaluation/Methodology; Benchmarking INTRODUCTION Determining how quantitative measures of usability relate is important in understanding the construct of usability. Using meta-analysis, Hornbæk and Law [7] recently reported weak correlations among efficiency, effectiveness and satisfaction, with an average Pearson-product moment correlation (r) of about .2. The correlations were equally weak among the specific measures of time-on-task, binary completion rates, error rates and user satisfaction (the measures that Hornbaek & Law defined as “prototypical” due to their common inclusion in usability studies to represent aspects of efficiency, effectiveness, and satisfaction). They concluded that although their research showed some dependence among various aspects of usability, the associations were too low to warrant aggregating metrics into a summary score. They hypothesized that Sauro and Kindlund’s [17] earlier reports of higher correlations might be due to small sample sizes and simple task-level measures. They also suggested that the aggregation level of the data (task or user) could affect the magnitude of the correlations.
- 50. The purpose of this analysis is to extend the important work of Hornbæk and Law [7] by focusing on the prototypical usability measures found in summative usability evaluations. Their research provided a broad survey of published studies, including studies that were not traditional scenario-based usability tests. We deal instead with the type of data found in the typical usability test presented to product teams, executives or for other internal benchmarking efforts [14]. In short, we wanted to see what the correlations were in actual usability tests, and how the level of aggregation affected the magnitude of the correlations. The data also afforded a unique opportunity to explore the construct validity of usability. METHOD We gathered the raw data from usability studies by searching the archives of present and past usability reports and contacting colleagues across many companies to get a large and reasonably varied set of task-level usability data. The data collection period lasted several months and incorporated data from usability studies conducted from 1983 to 2008, including products such as printers, accounting and human resources software, websites and portals. In total we obtained 97 raw data-sets from 90 distinct usability tests, all of which contained some
- 51. combination of the prototypical usability metrics, with data from over 2000 unique users and 1000 tasks (see Table 1). Thirteen of the 90 distinct usability tests (14.4%) were conducted by the authors. Data Collected N Data Sets 97 Distinct Usability Studies 90 Donors 12 Users 2286 Tasks 1034 Table 1. Dataset descriptions. Permission to make digital or hard copies of all or part of this work for personal or classroom use is granted without fee provided that copies are not made or distributed for profit or commercial advantage and that copies bear this notice and the full citation on the first page. To copy otherwise, or republish, to post on servers or to redistribute to lists, requires prior specific permission and/or a fee.
- 52. CHI 2009, April 4–9, 2009, Boston, Massachusetts, USA. Copyright 2009 ACM 978-1-60558-246-7/09/04…$5.00. Description of Datasets The type of data included in this analysis contained a narrower range of measures and tasks than those considered by Hornbæk and Law [7]. The bulk of the tasks in the present study were closed-end productivity activities (e.g., create an expense report, install paper in a printer, review employee performance reports, check status of a submitted report) as opposed to the more varied tasks in Hornbæk and Law (e.g., pointing and clicking, authoring privacy rules, editing code, essays written with computer support). All but four studies were between-subjects usability tests, wherein one set of users attempted a set of tasks on one product. Three data sets were from between-subjects comparisons in which independent groups of users attempted the same tasks on different products (either 2 or 3). One study used a within-subjects design in which the same users attempted the same set of tasks across three products. The difference between the total number of datasets and distinct usability tests reflects the inclusion of
- 53. these between- and within-subjects comparisons. Our goal was to obtain raw datasets from as many companies and products as possible. Part of such an undertaking, however, required that we extend a degree of anonymity to the donors, and many of the details (including all confidential details) of the usability studies were removed from the raw datasets before we received them (and many thanks to those who selflessly donated their data). For the datasets in which we also obtained the reports, the majority tested users who were unfamiliar with the product but had experience in the domain (e.g., Human Resources Professionals adding new hire information in an HR application). All but three of the 97 datasets came from lab-based moderated usability tests; the other three were automated remote usability tests. Domains The usability test data came from 12 sources, including software companies (e.g., PeopleSoft, Oracle, IBM, Intuit), IT organizations within another company (e.g., Fidelity Investments, American Family Insurance) or individuals or organizations as part of research. Coding
- 54. Most datasets were coded from reports or spreadsheets with little modification. Because some scales (such as the ASQ and PSSUQ – [11,12,13]) code higher numbers as having worse usability, in contrast to the majority of other scales, the major source of re-coding came from ensuring the sentiment of the satisfaction scales were pointing in the same direction (with higher scores indicating greater satisfaction). In addition to scale direction, satisfaction questions differed on the number of scale steps. For post-task ratings, 20 used five-point scales (53%) 16 used 7-point scales (42%), one used the 150 point SMEQ scale, and three used magnitude estimation [5,15] (which does not have a defined number of scale steps). Most post-task ratings were averages of 2 to 3 questions using 5- or 7-point Likert-type questions, resulting in a composite score often between 10-15 response options. Even though 95% of the tests used 5- or 7-point scales for post-task satisfaction, we recoded the raw scale scores as proportions of the maximum score because a mean response of 4 on a 5-point scale represents a higher sentiment than a 4 (the mid-point) on a 7-point scale. For the same reasons, we used the same technique to scale the post-test satisfaction ratings. For example, a raw SUS score
- 55. of 75 became .75 because the maximum SUS score is 100. Metric Representation across Studies Table 2 shows the representation of the prototypical measures across the datasets. Metric N % Task Time 96 99 Completion Rate 95 98 Errors 56 58 Post-Test Satisfaction 47 48 Post-Task Satisfaction 39 40 Table 2. Metric distribution across the 97 datasets. Almost every study collected task time and completion rates; only 39 collected post-task satisfaction. Users In total, there were 2286 unique users from the 97 datasets. The distribution of users across tests was highly skewed by one very large sample size (n = 296 – one of the automated remote usability tests), making the mean number of users
- 56. per test a misleading figure. The median number of users per test was 10, ranging from 4 to 296. Sixty-four percent of the tests had between 8 and 12 users and 80% had fewer than 20. Most information about the characteristics of the users was removed from the data-sets, preventing a representative tabulation. There was sufficient evidence from the reports to conclude that users were predominately from the US and usually familiar with the application. The distribution of gender appeared roughly representative, but there was no evidence of representation from children or the elderly. Tasks In total, there were 1034 unique tasks from the 97 datasets. The distribution of tasks across tests was more normally distributed, with a mean of 10.6 and range of 2 to 44. Fifty- one percent of tests had between 6 and 10 tasks. Most information about the details of the task scenarios had been removed from the data-sets before we received them. Much of the data came from productivity tasks. For example, two scenarios which exemplify this type of task were “Enter a social security number for a beneficiary” and “Create and submit an Expense Report for Mileage between
- 57. Vancouver and San Francisco.” Task Duration Task duration had a strong positive skew from a few very long tasks lasting over an hour. To address this skewness, the task time means were transformed using the natural logarithm. The mean task duration was 172 seconds with a range from 10 seconds to 104 minutes. Fifty percent of tasks lasted between 90 and 270 seconds. LEVELS OF AGGREGATION FOR ANALYSIS A key goal of this investigation was to understand how different levels of aggregation affect the correlations among prototypical usability metrics. Hornbæk and Law [7, p. 625] identified different aggregation levels as a potential cause for different correlation magnitudes. Table 3 shows the seven different aggregation schemes used in the current study. Across Tests Within Tests Multiple
- 58. Correlations per Test One Correlation Per Test Tasks TM TO Users UM UO Observation -- OO Task Means -- TAO User Means -- UAO Table 3. Aggregation schemes. Task means, user means and observation level data are only possible one time per test. As Table 3 shows, we aggregated tasks along two
- 59. dimensions: (1) by the level of aggregation within a test and (2) the level of aggregation across tests. All aggregation methods ending with “O” generated only one correlation per test for each pair of prototypical usability metrics collected in the study. The aggregation methods ending with “M” generated multiple correlations per test for each pair of variables. To help explain the different methods, the following definitions of the aggregation schemes will include examples using the data in Table 4. Task Level Aggregation (TO/TM) Task level aggregation indicates the generation of correlations from the pairs of measures by the users for each task, so there are as many correlations for a test as there are tasks. For example, the correlations between task time and errors for the four tasks in the sample dataset shown in Table 4 are (.58, --, .89, .36) respectively. There is no correlation for task 2 because there were no errors. When one measurement has no variation, its correlation with other measurements is undefined due to division by 0. One way to estimate the overall correlation between time and errors is to use the TO scheme, averaging the three valid correlations. When averaging correlations, it is standard practice to convert the correlations to standard (z)
- 60. scores, do the math, then convert the mean standard score back to a correlation. To convert r to z, use: z = .5*ln((1+r)/(1-r)). To convert z back to r, use: r = ((exp(2*z)-1)/((exp(2*z)+1))). These formulas use Excel notation for easy pasting into a spreadsheet, replacing r and z in the bodies of the equations with cell designations as appropriate. To continue the example, converting the three correlations to standard scores produces .66, 1.4, and .38, which have a mean of .81. Converting this standard score back to a correlation gives r = .67 as the one correlation for this test when using the TO aggregation scheme. An alternative aggregation scheme using this data is to include all three correlations with similar task level correlations from the other datasets (the TM scheme, with multiple correlations per test). Using the TM scheme, the test data in Table 4 provided three estimates of the correlation between task time and errors (.58, .89, and .36).
- 61. Task User Raw Sat Scaled Sat Time Comp Errors 1 1 4.00 0.57 72 1 0 1 2 4.00 0.57 60 1 0 1 3 3.33 0.48 72 1 0 1 4 3.00 0.43 66 1 0 1 5 1.00 0.14 144 0 1 1 6 4.00 0.57 72 1 0 1 7 2.33 0.33 78 1 1 1 8 2.33 0.33 72 1 1 2 1 4.00 0.57 60 1 0 2 2 4.00 0.57 54 1 0 2 3 4.00 0.57 54 1 0 2 4 3.00 0.43 66 1 0 2 5 3.00 0.43 72 1 0 2 6 4.00 0.57 72 1 0 2 7 3.00 0.43 72 1 0 2 8 3.00 0.43 54 1 0 3 1 4.00 0.57 72 1 0
- 62. 3 2 4.00 0.57 72 1 0 3 3 4.00 0.57 78 1 0 3 4 3.00 0.43 84 1 0 3 5 3.33 0.48 90 1 0 3 6 4.00 0.57 90 1 0 3 7 2.33 0.33 114 1 1 3 8 2.00 0.29 150 1 1 4 1 4.00 0.57 96 1 0 4 2 4.00 0.57 72 1 0 4 3 4.00 0.57 60 1 0 4 4 1.67 0.24 114 0 1 4 5 2.33 0.33 78 0 1 4 6 4.00 0.57 66 0 1 4 7 2.33 0.33 78 1 0 4 8 3.00 0.43 96 0 1 Table 4. A dataset used in the analysis. The satisfaction scores were task-level, with a maximum score of 7. User Level Aggregation (UO/UM) User level aggregation indicates the generation of correlations from the pairs of measures by the tasks for each user, so for this scheme there are as many correlations for a test as there are users. For example, to generate the
- 63. correlations between task time and scaled task-level satisfaction for the sample data, the correlations are (--, --, - .37, -.93, -.84, --, -.47, -.66). To estimate the overall correlation between time and completion, we can either average these 5 valid correlations (after transforming) to get r = -.73 (One per test: the UO scheme) or use all 5 correlations with the user level correlations from the other datasets (Multiple per test, the UM scheme). Observation Level Aggregation (OO) Aggregation by observation involves creating one matrix of tasks and users within a dataset. For example, when correlating errors with completion rates in the sample data in Table 4, one correlation is generated from 32 pairs of errors and completion rates to get an r of -.68, which is then averaged with all other datasets (the OO scheme). Task Average Level Aggregation (TAO) Task average level aggregation indicates correlation taken on the mean task performance. For the sample data in Table 4, the correlation between post-task satisfaction and errors would use the mean satisfaction rating and mean number of errors by task (for this sample data, r = -.83). With this
- 64. scheme, there is only one correlation per test for each pair of variables. User Average Level Aggregation (UAO) User average level aggregation indicates that the correlation is taken on the mean user performance across tasks. For example, the correlation between task time and completion in the sample dataset for the 8 users is -.73. With this scheme, there is only one correlation per test for each pair of variables. Exploring the Construct of Usability The data also provide an opportunity to use principal components analysis (PCA) and factor analysis (FA) to explore the construct of usability. Organizing the data as described above for UM casts the data in a form suitable for PCA and FA (one set of prototypical usability scores per participant, averaged over tasks to get a set of independent scores, restricting the final data set to those participants who have scores for all prototypical usability metrics). The three key questions to address with these analyses are: 1. Do all prototypical usability metrics significantly correlate?
- 65. 2. Do all prototypical usability metrics heavily load on the first unrotated component of a PCA (indicative of an underlying usability construct ‘u’, analogous to Spearman’s ‘g’ for intelligence [9])? 3. Does an exploratory FA indicate a reasonable underlying factor structure for the construct of usability? RESULTS All correlations in the subsequent tables were calculated using the Fisher r-to-z transformation, then transforming the z-scores back to report as correlations (Pearson’s r). All reported correlations were significantly different from 0 (p < .05). For each of the following seven tables, the calculation of the overall mean used the standard conversion to z-scores, then conversion back to r, so the overall means will not match a simple average of the tabled correlations, but will probably provide a better estimate of the true correlation between the two metrics than any individual correlation from the aggregation levels. Using a similar procedure, the overall median is the mean of the transformed medians. The 95% confidence intervals were calculated on the z-scores and transformed back to Pearson r’s. The intervals are asymmetrical because the distribution
- 66. of r is positively skewed, especially for values above .5. The “% Neg.” and “% Pos.” columns show the percentage of correlations that were either negative or positive based on the overall tendency of the metric pairs. Higher values in this column show higher agreement and less variability in the datasets for that aggregation level and correlation pair. Correlations among Task Completion, Task Time and Errors Tables 5-7 show the correlations between the prototypical measures for effectiveness and efficiency: task time, errors and completion rates. The tables show both the mean and the median as measures of central tendency for each correlation. 95% CI Level Mean Median N Low High % Neg. TM -0.41 -0.36 809 -0.44 -0.38 81 UM -0.36 -0.32 1921 -0.38 -0.34 83 OO -0.39 -0.38 92 -0.43 -0.34 97 TO -0.44 -0.40 92 -0.49 -0.38 96 UO -0.51 -0.47 92 -0.56 -0.46 99
- 67. TAO -0.61 -0.60 92 -0.67 -0.54 91 UAO -0.51 -0.45 92 -0.58 -0.43 90 Overall -0.46 -0.43 7 -0.51 -0.41 91 Table 5. Correlations between completion rate and time by aggregation level. 95% CI Level Mean Median N Low High % Neg. TM -0.59 -0.48 518 -0.63 -0.54 90 UM -0.51 -0.43 675 -0.55 -0.48 88 OO -0.40 -0.39 56 -0.45 -0.33 96 TO -0.51 -0.48 55 -0.60 -0.41 91 UO -0.56 -0.42 56 -0.66 -0.43 91 TAO -0.60 -0.58 56 -0.68 -0.52 95 UAO -0.58 -0.57 56 -0.67 -0.47 95 Overall -0.54 -0.48 7 -0.61 -0.46 92 Table 6. Correlations between completion rate and errors
- 68. by aggregation level. 95% CI Level Mean Median N Low High % Neg. TM 0.47 0.47 624 0.44 0.50 86 UM 0.62 0.59 812 0.59 0.66 92 OO 0.54 0.57 56 0.48 0.59 100 TO 0.47 0.48 56 0.41 0.53 96 UO 0.66 0.59 56 0.57 0.74 98 TAO 0.80 0.77 56 0.73 0.85 96 UAO 0.53 0.50 56 0.44 0.61 91 Overall 0.60 0.59 7 0.53 0.66 94 Table 7. Correlations between errors and task time by aggregation level. Correlation of Task-Level Satisfaction with Task Completion, Task Time, and Errors Tables 8-10 show the correlations between task-level
- 69. satisfaction and the prototypical measures for effectiveness and efficiency: completion, errors and time. 95% CI Level Mean Median N Low High % Neg. TM 0.41 0.33 455 0.32 0.50 79 UM 0.56 0.50 1518 0.51 0.62 90 OO 0.42 0.42 39 0.36 0.48 97 TO 0.42 0.36 39 0.34 0.49 97 UO 0.63 0.51 39 0.38 0.79 95 TAO 0.68 0.74 39 0.59 0.74 95 UAO 0.42 0.48 39 0.31 0.52 90 Overall 0.51 0.48 7 0.41 0.61 92 Table 8. Correlations between task-level satisfaction and completion rate by aggregation level. 95% CI Level Mean Median N Low High % Neg.
- 70. TM -0.39 -0.38 575 -0.42 -0.36 84 UM -0.54 -0.51 1676 -0.57 -0.52 90 OO -0.41 -0.41 38 -0.46 -0.36 97 TO -0.39 -0.37 38 -0.44 -0.33 97 UO -0.52 -0.54 38 -0.61 -0.41 95 TAO -0.56 -0.59 38 -0.65 -0.45 89 UAO -0.43 -0.42 38 -0.55 -0.3 89 Overall -0.47 -0.46 7 -0.53 -0.39 92 Table 9. Correlations between task-level satisfaction and task time by aggregation level. 95% CI Level Mean Median N Low High % Neg. TM -0.37 -0.25 398 -0.49 -0.24 78 UM -0.42 -0.37 554 -0.49 -0.35 83
- 71. OO -0.34 -0.38 26 -0.41 -0.27 100 TO -0.33 -0.29 26 -0.43 -0.23 96 UO -0.52 -0.43 26 -0.74 -0.20 88 TAO -0.61 -0.63 26 -0.72 -0.48 92 UAO -0.45 -0.49 26 -0.58 -0.31 92 Overall -0.44 -0.41 7 -0.57 -0.30 90 Table 10. Correlations between task-level satisfaction and errors by aggregation level. Task-level satisfaction measurement (e.g., the ASQ [11,12]) takes place after the completion of each task (or scenario), in contrast to satisfaction measures taken at the completion of a test (post-test satisfaction), such as the SUS [2], SUMI [8], and PSSUQ [12,13]) which appear in Table 11. Post-Test Satisfaction 95% CI
- 72. Mean Median N Low High % -/+ Comp 0.24 0.29 46 0.12 0.36 72 + Time -0.25 -0.28 47 -0.37 -0.11 68 - Task Sat 0.64 0.62 15 0.39 0.8 93 + Errors -0.16 -0.16 29 -0.3 -0.02 62 - Table 11. Correlations with post-test satisfaction. Post-test correlation done at the aggregation level of UAO is the only way to correlate post-test satisfaction with task-level measures. Correlation of Test-Level Satisfaction with Task Level Metrics Forty-seven of the datasets included test-level satisfaction measurement along with some combination of task-level measures. Correlation with post-test satisfaction ratings with task level measures is only possible with the UAO aggregation scheme because users complete post-test satisfaction measures once at the end of the test. Table 11 shows the correlations between test-level satisfaction and
- 73. the other usability metrics. Overall Correlations Table 12 shows the average correlations from Tables 5-11 above. The correlations range from low correlations for test-level satisfaction (e.g., -.16) to strong correlations (e.g., .60) for task time and errors. Comp Time -0.46 Time Errors -0.54 0.60 Errors Task-Sat 0.51 -0.47 -0.44 Task-Sat Test-Sat 0.24 -0.25 -0.16 0.64 Table 12. Correlation matrix using the average of all aggregation levels (except Test-Sat which necessarily used only the UAO aggregation level). Levels of Aggregation and Variable Pairs One of our key questions was the extent to which the level
- 74. of aggregation affects the magnitude of the measured correlation. We used ANOVA to assess the main effects of Level of Aggregation and Variable Pair (correlated pairs of variables) and their interaction. Out of the 97 data sets in the database, there were 26 for which we could compute all of the following prototypical usability metrics: task time, task completion, errors per task, and task-level satisfaction. For each study, we used each of the five levels of aggregation to obtain correlations for each of the six variable pairs, for a total of 30 correlations per study. Next, we converted correlations to z-scores (ensuring that correlations in the expected direction were coded as positive z-scores), then conducted the ANOVA on the z- scores, treating studies as subjects in a within-subjects design with two independent variables (Level of Aggregation and Variable Pair). The main effect of Level of Aggregation was statistically significant (F(4, 100) = 6.2, p < .0001), as was the main effect of Variable Pair (F(5, 125) = 8.0, p < .0001) and their interaction (F(20, 500) = 2.2, p = .003). Figure 1 shows the interaction (with z-scores converted back to r).
- 77. C o rr e la ti o n TAO UO UAO TO OO Figure 1. Interaction between Level of Aggregation and Variable Pair. The codes for variables are T = Time, C =
- 78. Completions, E = Errors, and S = Satisfaction (Task- Level). Tables 13 and 14 show the results of Bonferroni multiple comparisons on the main effects. For the multiple comparisons, we used all of the study-level data available for each level of aggregation (n = 93) and for each variable pair (n ranging from 26 to 56, depending on the variable pair). TAO UO UAO TO OO r = 0.67 r = 0.58 r = 0.48 r = 0.43 r = 0.42 X X X X X X Table 13. Bonferroni comparisons of Levels of Aggregation. With five levels, there are 10 possible comparisons, so to maintain a significance level of .05 across the set of comparisons, the critical significance level for each individual comparison was .005 (.05/10). Levels
- 79. that have an “X” on the same row were not significantly different. TE CE CS CT TS ES r = 0.62 r = 0.53 r = 0.52 r = 0.49 r = 0.46 r = 0.46 X X X X X X X X Table 14. Bonferroni comparisons of Variable Pair. With six pairs, there are 15 possible comparisons, so to maintain a significance level of .05 across the set of comparisons, the critical significance level for each individual comparison was .0033 (.05/15). Levels that have an “X” on the same row were not significantly different. Construct Validity of Usability The database contained 325 cases (from 13 studies) in which participants provided all five prototypical usability metrics: task completions, task times, error counts, task-
- 80. based satisfaction, and test-based (overall) satisfaction. The correlation matrix for the metrics for this subset of the data appears in Table 15. Comp Time -0.50 Time Errors -0.66 0.59 Errors Task-Sat 0.43 -0.24 -0.34 Task-Sat Test-Sat 0.35 -0.23 -0.23 0.64 Table 15. Correlation matrix for the 325 complete cases by participant. All correlations were statistically significant (p < .0001) and in the expected direction, a finding consistent with the hypothesis of an underlying construct of usability. The magnitudes were similar to those of the whole dataset (see Table 12 above) with the exception of time and task-level satisfaction which had a greater attenuation. Table 16 shows the unrotated loadings for a PCA conducted
- 81. on this subset of the data. All variables loaded highly on the first component, with the absolute value of the loadings ranging from .63 to .82. Thus, this finding is consistent with the hypothesis of an underlying construct of usability. Measures 1 2 3 4 5 Comp 0.82 -0.20 0.38 0.26 0.27 Time -0.70 0.45 0.53 0.06 -0.16 Errors -0.80 0.41 -0.17 0.11 0.40 Task-Sat 0.71 0.56 0.09 -0.41 0.13 Test-Sat 0.63 0.65 -0.22 0.32 -0.17 Eigenvalue 2.70 1.14 0.51 0.35 0.30 % Variance 53.97 22.78 10.14 7.05 6.06 Table 16. Unrotated PCA loadings. Note that the mechanics of PCA maximize the assignment of variance to the first unrotated component, leading to some controversy regarding its interpretability. Despite this, some psychometricians do hold that this first unrotated principal component is interpretable “as a general index of a construct represented by shared variance among related
- 82. variables. For example, if one had administered five tests of specific cognitive abilities, the first unrotated principal component … could be viewed as a measure of general ability" [9, p. 251]. This first unrotated component is also a potential source for weightings to use in the computation of a composite score. This is not evidence for a latent factor structure with only one factor, rather, it is evidence for an overall usability construct that might or might not have an additional latent factor structure. To explore the possibility of a latent factor structure, we conducted a common factor analysis on the 325 cases. A parallel analysis [4] of the eigenvalues from the FA (2.364, 0.805, 0.094, 0.024, -0.003) indicated a two-factor solution (with those two factors accounting for about 63% of the total variance). The final varimax-rotated loadings for the two-factor solution appear in Table 17, with objective measures loading strongly on the first factor, and subjective measures loading strongly on the second factor. Measures 1 2 Comp 0.70 0.33
- 83. Time -0.65 -0.14 Errors -0.88 -0.15 Task-Sat 0.24 0.79 Test-Sat 0.15 0.76 Table 17. Rotated factor loadings. Internal Reliability of Post-Test Questionnaires There were 9 different post-test satisfaction questionnaires used across 47 datasets. Seven datasets provided only summary level data, but we had the raw data from the other 40 datasets, allowing us to examine the reliability of the questionnaires using a procedure similar to that of Hornbæk and Law [7]. We computed the internal reliability using coefficient alpha, with results in Table 18. Coefficient Alpha Questionnaire N Mean Min Max SUS 17 0.83 0.52 0.98
- 84. Homegrown 11 0.78 0.63 0.92 SUMI 6 0.92 0.86 0.98 PSSUQ 6 0.92 0.80 0.98 Overall 40 0.85 Table 18. Internal reliability of post-test satisfaction questionnaires. To test the relative reliability between homegrown and standardized questionnaires, we combined the questionnaires into two groups and conducted a t-test, with the result that the standardized instruments were more reliable (.78 vs .87, t(16)=2.24, p < .05) than the homegrown ones, confirming the finding of Hornbæk and Law. There were seven questionnaires that had reliability below .70; however, they were about equally split between standardized and homegrown (four homegrown; three standardized). All homegrown questionnaires asked questions about ease of use and at least one additional construct. For example, one questionnaire asked whether the product met the user’s business needs and another asked about the perceived attractiveness of the interface. The inclusion of these items reduced the internal reliability,
- 85. suggesting that they were getting at a construct other than usability. Three instances of the SUS questionnaire had reliability between .52 and .68. Likely causes for this lower reliability include small sample sizes and failure to orient the questions in the same direction (coding errors). DISCUSSION Although the values of the correlations fluctuated depending on the aggregation level, the magnitudes of the correlations among the prototypical usability metrics tended to be medium to large. The lower bounds of the 95% confidence intervals around the correlations for the overall averages never dipped below .30. This conservative lower bound suggests task-level correlations that have at least a medium-sized effect [3]. Comparison with Correlations of Hornbæk & Law (2007) Table 19 shows the average correlations across aggregation levels from this study, the correlations obtained using the UAO scheme and post-test rather than post-task satisfaction (closest to the scheme used by Hornbæk & Law [7]), and the correlations reported by Hornbæk and Law. Measures Overall UAO H&L
- 86. Comp/Time -0.46 -0.50 Comp/Errors -0.54 -0.56 Errors/Time 0.60 0.51 0.32 / 0.44* Sat/Comp 0.51 0.26 Sat/Time -0.47 -0.25 -0.15 Sat/ Errors -0.44 -0.22 -0.20 Table 19. Comparison of correlations at the UAO aggregation level with the prototypical measures from Hornbaek &Law (H&L). *The correlation of .44 is for their category of errors-along-the-way, which is more similar to the error types in the current analysis than their category of task-completion-errors (errors in a task’s outcome). In the current study, the UAO level of aggregation comes closest to the correlations reported by Hornbæk and Law [7]. In their Table 5, Hornbæk and Law (p. 623) reported correlations of .316 (with a 95% confidence interval from
- 87. .246 to .386) for time and errors, .196 (95% CI from .012 to .380) for errors and satisfaction, and .145 (95% CI from .016 to .274) for time and satisfaction. It appears that many of their satisfaction measures were post-test, and our UAO correlation between errors and post-test satisfaction (see Table 10) was very similar, -.16 (95% CI from -.02 to - .30), as was the UAO correlation between time and post- test satisfaction of -.25 (95% CI from -.11 to -.37). Our UAO estimate of the correlation between time and errors (.51, with a 95% CI from .44 to .61) was significantly higher than Hornbæk and Law’s estimate (95% CI from .246 to .386). We agree with the hypothesis put forth by Hornbæk and Law [7] that a likely cause of higher correlations in Sauro and Kindlund [17] and in the current analysis is due to restricting task types and task-level measures. The variety of studies used in Hornbæk and Law most likely provide a better picture of the broader area of human computer interaction (HCI), whereas the data analyzed here present a more focused picture of summative usability tests. In other words, the results of Hornbæk and Law are more
- 88. generalizable to the entire field of HCI, whereas our results are more generalizable to the types of usability tests typically conducted by usability professionals – a type of test often performed, but rarely published. For example, an indicator of the difference in the types of studies examined in the current study and Hornbæk and Law is the percentage of studies that included task completion rates as a metric. In Hornbæk and Law, 15 of 72 studies (21%) included this metric; in our database, 95 of 97 studies (98%) included it. Error Types Fifty-three of our datasets contained error data. Hornbæk and Law [7] defined a distinction between task-completion- errors (errors in task outcomes) and what they dubbed errors-along-the-way (e.g., slips, mistakes). The data sets we have contain total error counts at the task level, combining these two types of errors. The correlation found between errors and task time in this analysis (r = .60) was closer to the Hornbæk and Law correlation of task time with errors-along-the-way (r = .44) than their correlation of task time with task-completion-errors (r = .16). This is consistent with our observation that in standard usability testing, task-completion errors are a much smaller class of errors than errors-along-the-way. In many cases,
- 89. participants may not even be aware of task-completion- errors, which would restrict correlation between those types of errors and satisfaction measurements. Also, errors- along-the-way necessarily have an effect on task time (all other things being equal, more errors lead to longer task times), but there is no similar logical relationship between task-completion-errors and task time. Whether usability practitioners should routinely discriminate between these two classes of errors is an open question because, although this distinction is of interest to some researchers, it might be of little practical significance in guiding product redesign. Levels of Aggregation and Variable Pairs As suggested by Hornbæk and Law [7], the level of aggregation significantly affected the magnitude of the correlations, with the highest correlations generally associated with the TAO level of aggregation. The lowest correlations generally occurred with the OO level of aggregation, but even those correlations were of substantial magnitude. The lowest correlation from the ANOVA was for the association of completions and time using the OO level of aggregation, with r = .30. Because this is a correlation between two different variables collected at the same time, it is a measure of concurrent validity. In
- 90. classical psychometrics, validity coefficients of .30 are respectable, large enough to justify the use of the associated psychometric instruments for personnel decisions [16]. There were also significant differences among the magnitudes of the correlations for the variable pairs. The strongest correlation was for time and errors (r = .62), but this correlation was not significantly different from those for completions and errors (r = .53) or satisfaction (task- based) and errors (r = .52). With correlations ranging from r = .46 to .62 in the Bonferroni comparisons for all the pairs of variables, only the correlation between time and errors was significantly higher than any of the other correlations (specifically, higher than the correlations for time and completions, time and satisfaction, and errors and satisfaction). These analyses (ANOVA and associated Bonferroni multiple comparisons) show that for different levels of aggregation, prototypical usability metrics from standard usability tests correlate significantly, which is consistent with the hypothesis that they are measuring different aspects of a common underlying construct of usability. The Construct of Usability
- 91. The results of the PCA and FA on the 325 complete cases in the database were consistent with an underlying construct of usability containing two components, one objective and one subjective. Not only did the prototypical metrics of usability correlate significantly with one another, the pattern of their correlations was also consistent with an easily interpreted factor structure. The magnitudes of loadings on the first component of the PCA (ranging from .63 to .82) were close enough in value that it is reasonable to use unweighted combinations to create composite usability scores, which is usually the case with combined measurements [16]. For these 325 cases, the correlation between weighted and unweighted combination was .99999 showing no statistical advantage to using a weighted combination instead of a simpler unweighted combination. This evidence for the construct validity of usability is especially compelling given the wide variety of the sources of data in the analyses. These data did not come from one large study with homogenous participants, products, and tasks. Instead, they came from a disparate collection of studies, with values averaged across a disparate collection of tasks (for example, for one task a completion time of five minutes might be fast, but for a different task, it might be slow). Even with this inherent variability in the data, the
- 92. analyses consistently supported the existence of the construct of usability. Why do we care if the prototypical usability metrics correlate? From psychometric theory [16], an advantage of a composite score (created either by summing or averaging components of the score) is increased reliability of measurement, but that increase depends on correlations among the component scores. If the component scores do not correlate, the reliability of the composite score will not increase relative to the component scores. Even without an increase in reliability, it might still be advantageous to combine the scores [1], but the results of the PCA and FA lend statistical support to the practice of combining component usability metrics into a single score [17]. Hornbæk and Law [7, p. 625] argued that attempts to reduce usability to one measure are bound to lose important information because there is no strong correlation among usability aspects. There are, however, real-world situations in which practitioners must choose only one product from a summative competitive usability test of multiple products
- 93. and, in so doing, must either rely on a single measurement (a very short-sighted approach) or must use a composite score [10,17]. Our PCA suggests that a single composite score of five usability measures (including post-test satisfaction) would likely contain about 54% of the variation of the raw scores (see Table 16) – accounting for a substantial proportion of the variance, but certainly not 100%. Any summary score (median, mean, or other composite scores) must lose important information (just as an abstract does not contain all of the information in a full paper) – it is the price paid for summarizing data. It is certainly not appropriate to rely exclusively on summary data, but this analysis indicates the retention of a reasonable amount of the original variables’ information. Also, it is important to keep in mind that the data that contribute to a summary score remain available as component scores for analyses and decisions that require more detailed information. Differences in Task- and Test-Level Satisfaction There was a noticeable difference in satisfaction correlations when using test-level satisfaction instead of task-level satisfaction. For example, Table 12 shows that the correlation between errors and task-level satisfaction
- 94. was -.44, but errors and test-level satisfaction only correlated at r = -.16. The correlation between task- and test-level satisfaction was .64 (See Table 12). Thus, post-task satisfaction accounted for around 40% of the variation in post-test satisfaction. Hornbæk and Law [7] found correlations of between .38 and .70 between the two, consistent with our findings. This relationship is among the strongest between pairs of measures, but it is not high enough to indicate complete redundancy. The relatively high coefficient alphas of the post-test satisfaction questionnaires (See Table 18) also suggest that reliability is probably not a major cause of the attenuation in the correlations for post-test satisfaction. It is reasonable to speculate that responses to post-test satisfaction questions elicit reactions to aspects beyond the immediate usability test (past usage, brand perception, customer support). The nature of the questions supports this hypothesis; e.g., the SUS item, “I think that I would like to use this system frequently.” In contrast, responses to post- task questions are probably highly influenced by the just- completed activity. The direct nature of the post-task
- 95. questions supports this idea; e.g., the ASQ item, “Overall, I am satisfied with the amount of time it took to complete the tasks in this scenario.” There are other factors that might influence a participant’s rating of items in a post-test satisfaction questionnaire. For example, there could be a primacy effect if the participant’s experience with the product in the first task was unusually good or bad. Hassenzahl and Sandweg [6] reported evidence for recency effects from the last task, and Xie and Salvendy [19] found similar effects in the measurement of workload. For all these reasons, it should not be surprising that post-task satisfaction measures correlate more highly than post-test satisfaction with other task-level usability measures. It is possible to assess post-task subjective usability with a single item [18], so this need not add much time to a usability test. Overall, these findings strongly support the practice of collecting both post-task and post- test satisfaction measurements in usability tests. Task Level Independence and Range Restriction Although there are many likely causes for the differences among aggregation levels, one notable difference occurs when correlating the data within users or tasks. At this level there was often little variation. Many users completed all
- 96. tasks successfully and many tasks had 90 to 100% successful completion rates. Error rates were also often homogenous at this level, with many users committing no errors and many tasks being error-free. Under these circumstances, it is impossible to compute a correlation, which excludes the task from the types of analysis conducted in the present study (as illustrated with the sample data in Table 4). At different levels of aggregation though (e.g., OO), a task with a 100% completion rate gets combined with other tasks, allowing it to contribute to the computed correlations. What’s more, at very high or low levels of magnitude there is also a more limited opportunity to detect correlations (as only 1 or 2 values may differ). This problem is most noticeable when correlating the discrete measures (completion rates and errors) when there are a limited number of values. It is also a potential problem for post- task satisfaction scales if there are few scale steps. This factor affected 5 out of 6 of the correlation pairs, with the greatest range restriction expected for the correlations between completion and errors and between completions and satisfaction. To a slightly lesser extent, it will restrict the correlations between completion and time, errors and
- 97. time, and errors and satisfaction. There should be little restriction of the correlation between time and satisfaction. CONCLUSION Recent investigations of the magnitude of correlations among prototypical usability metrics have had mixed results, with some indicating substantial correlation [17] and others less substantial [7]. In this paper, we report the correlations computed from a database with prototypical usability metrics (task times, completion rates, errors, post- task satisfaction, and post-test satisfaction) from 90 distinct summative usability studies. For these types of studies and measurements, the data indicated that prototypical usability metrics correlate substantially. Additional analyses provided evidence of their association with an underlying general construct of usability made up of an objective factor and a subjective factor, supporting the practice of combining component usability metrics into a single score. The results of this study help to clarify the factors that affect the correlation structure of usability studies, such as a focus on summative usability studies (as opposed to more general studies of human-computer interaction), distinguishing between post-task and post-test satisfaction
- 98. measurement, and the effect of various data-aggregation schemes. REFERENCES 1. Bangor, A., Kortum, P. T., & Miller, J. T. (2008). An empirical evaluation of the System Usability Scale. International Journal of Human-Computer Interaction, 6, 574-594. 2. Brooke, J. (1996). SUS: A quick and dirty usability scale. In P.W. Jordan, B. Thomas, B.A. Weerdmeester & I.L. McClelland (Eds.), Usability Evaluation in Industry (pp. 189-194). London: Taylor & Francis. 3. Cohen, J. (1988). Statistical power analysis for the behavioral sciences. Hillsdale, NJ: Lawrence Erlbaum. 4. Coovert, M. D., & McNelis, K. (1988). Determining the number of common factors in factor analysis: A review and program. Educational and Psychological Measurement, 48, 687–693. 5. Cordes, R. (1984). Software ease-of-use rating using magnitude estimation (Tech. Report 82-0156). Tucson,
- 99. AZ: IBM. 6. Hassenzahl, M. & Sandweg, N. (2004). From mental effort to perceived usability: Transforming experiences into summary assessments. In Proceedings of the CHI 04 Conference on Human Factors in Computing Systems. Extended abstracts (pp. 1283-1286). New York: ACM. 7. Hornbæk , K., & Law, E. (2007). Meta-analysis of correlations among usability measures. In Proceedings of CHI 2007 (pp. 617-626). San Jose, CA: ACM. 8. Kirakowski, J., & Corbett, M. (1993). SUMI: The Software Usability Measurement Inventory. British Journal of Educational Technology, 24, 210–212. 9. Leong, F. T. L., & Austin, J. T. (2005). The psychology research handbook: A guide for graduate students and research assistants. Thousand Oaks, CA: Sage Publications. 10. Lewis, J. R. (1991). A rank-based method for the usability comparison of competing products. In Proceedings of the Human Factors Society 35th Annual
- 100. Meeting (pp. 1312-1316). San Francisco, CA: Human Factors Society. 11. Lewis, J. R. (1991). Psychometric evaluation of an after- scenario questionnaire for computer usability studies: The ASQ. SIGCHI Bulletin, 23, 1, 78-81. 12. Lewis, J. R. (1995). IBM computer usability satisfaction questionnaires: Psychometric evaluation and instructions for use. International Journal of Human– Computer Interaction, 7, 57–78. 13. Lewis, J. R. (2002). Psychometric evaluation of the PSSUQ using data from five years of usability studies. International Journal of Human–Computer Interaction, 14, 463–488. 14. Lewis, J. R. (2006). Usability testing. In G. Salvendy (Ed.), Handbook of Human Factors and Ergonomics (3rd ed.) (pp. 1275-1316). New York, NY: John Wiley. 15. McGee, M. (2004). Master usability scaling: Magnitude estimation and master scaling applied to usability measurement. In Proceedings of CHI 2004 (pp. 335- 342). Vienna, Austria: ACM.
- 101. 16. Nunnally, J. C. (1978). Psychometric theory. New York, NY: McGraw-Hill. 17. Sauro, J., & Kindlund, E. (2005). A method to standardize usability metrics into a single score. In Proceedings of CHI 2005 (pp. 401-409). Portland, OR: ACM. 18. Tedesco, D. P., & Tullis, T. S. (2006). A comparison of methods for eliciting post-task subjective ratings in usability testing. UPA 2006, unpublished presentation. (www.upassoc.org/usability_resources/conference/2006/ post_task_ratings.pdf) 19. Xie, B., & Salvendy, G. (2000). Prediction of mental workload in single and multiple tasks environments. International Journal of Cognitive Ergonomics, 4, 213- 242. Usability Engineering
- 102. Assignment 2 Part 1 – Group Assignment (10%) This assignment is due on Monday, April 20, 2020, at 9am Overview Assignment 2 is about the design and implementation of Usability Testing Assignment 2 consists of two components: Part 1, Part 2 for a total of 45 % of your overall work. Part 1 - Test plan for larger user study [ 10%] Part 2 - Final report for larger user study [35%] This document contains only Part 1 of Assignment 2. Important Instructions You must work in a group of 1, 2, 3, 4, 5 or 6 people. You
- 103. should work with other people from your Prac class, because one Tutor will mark the group submission. You can work with students from another Prac class provided you agree which Tutor to submit your work to and this Tutor knows and agrees. Only one submission should be made per group. Make sure that every group member’s name is on the submission, as well as the Tutor’s name and Prac time information. Step 1: The website we will be working with is RMIT: www.rmit.edu.au. Your team needs to identify at least five (5) clear tasks which different users accessing the RMIT website could reasonably expect to conduct.
- 104. Step 2: Make a Test Plan This test plan from Part 1 will be used in Assignment 2 Part 2. What to look for in creating the Test Plan: • Documents and processes that you will need for the usability test • Online templates and other test materials can be found in Week 4 Learning Materials How to prepare a test plan 1. Gather information and identify tasks. Identify user profiles, market segments and aspects of the website that you will test. Deleted: 5 Deleted: Thursday, April 16
- 105. Deleted: 3 Deleted: 0 Deleted: 5 Deleted: 25 Deleted: or Deleted: four Deleted: a person 2. Screeners, tasks and scenarios Use the user profiles and draft a screener / questionnaire to identify the right participant in your test. Focus on the unique attributes that the user must
- 106. have. Define tasks that the users you recruit will perform. Please note that if the user requires an account, you cannot provide your own RMIT account details. The task must not specify to create a log in, this is a step that the user may decide they would need to take if necessary. 3. Test script, Observation Sheet and Consent Form Prepare: • A script to be read by the facilitator to the participant on the day of the test. The script must welcome the participant and provide them with the necessary information about the test
- 107. • An observation sheet to note down your observation during the test • A consent form to be filled and signed by the participant. 4. Checking Do a run-through of the entire test to ensure that it will take no more than 45 minutes of the user’s time. Assume that the tasks will take 3-10 times the time an expert takes to do the task. (See Kuniavsky 2012, p285). Task Checklist • Do I have a good number of varied tasks? // 3 - 5 • Is the task too easy for the user? //It shouldn’t be • Is the task realistic? // It must be • Will the user I recruit be too familiar with the task? //It
- 108. shouldn’t be Marking Guide Where to submit? The test plan should be submitted via Turnitin in Canvas. Plagiarism Checking via the Turnitin Originality report (via the Canvas submission) Any templates or information that you gather from other sources should be referenced in Section 8: Source documents. Since your submission contains templates it would not be surprising if the Originality Report percentage is very high. You should make sure that your input in the follow sections is unique: Section 1: Participant and Recruitment Summary
- 109. Section 7: User Task Sheets (for participants) Section Criteria Mark 1 Section 1 - Participant and Recruitment Summary Age range and source of participants is defined. The age must be more than 18 years 2 2 Section 2 – Facilitator script The facilitator script must include the following – • Participant introduction • Testing the website and not the participant’s abilities
- 110. • Video recording and the distribution and usage of it • Duration of the test, the number of tasks, testing environment • Participant can withdraw at any time, ask questions and encouraged to think aloud • If you have used an external source / template, please reference the script in Section 8 2 3 Section 3 – Screener and Pre-test Questionnaire • Screening questions used to identify the eligible participant (Section 1) • Pre-test questions gather relevant information that may be useful for defining user characteristics • If you have used an external source / template, please reference the
- 111. script in Section 8 2 4 Section 4 – Post-test Questionnaire • Post-test questions could include the ‘SUS’ and/or specific task based questions. • Should be sufficient and provide relevant data for analysis • If you have used an external source / template, please reference the script in Section 8 2 5 Section 5 – Consent form • Includes website section name and test duration • Consent to the test, filling out questionnaires, performing the tasks and recording
- 112. 2 6 Section 6 – User Task description • The tasks include an objective, scenario, dependencies, possible solution, estimated length and criteria for completion. • There should be sufficient number of tasks. • Tasks should not be trivial but relevant to the core functions of website. • Avoid signup / sign in as a task • Scaffolding / materials like username/password should be provided 2 7 Section 7 – User Task Sheets (for participants)
- 113. • Scenarios are written in terms of user goals. • Scenarios are unambiguous and short. • Scenarios are realistic and provide a motive for end goal of task • Scenarios are written in the user’s words 2 8 Section 8- Source documents • List the section and the reference used. 2 9 Test Plan structure and presentation • Presentation and structure • Adherence to template 4