Bringing Employees Closer: The Effect of Proximity on
Communication When Teams Function under Time Pressure
Darrel S. F. Chong, Wendelien van Eerde, Christel G. Rutte, and Kah Hin Chai
Some studies have assumed close proximity to improve team communication on the premise that reduced physical
distance increases the chance of contact and information exchange. However, research showed that the relationship
between team proximity and team communication is not always straightforward and may depend on some contextual
conditions. Hence, this study was designed with the purpose of examining how a contextual condition like time pressure
may influence the relationship between team proximity and team communication. In this study, time pressure was
conceptualized as a two-dimensional construct: challenge time pressure and hindrance time pressure, such that each
has different moderating effects on the proximity–communication relationship.
The research was conducted with 81 new product development (NPD) teams (437 respondents) in Western Europe
(Belgium, England, France, Germany, and the Netherlands). These teams functioned in short-cycled industries and
developed innovative products for the consumer, electronic, semiconductor, and medical sectors. The unit of analysis
was a team, which could be from a single-team or a multiteam project. Results showed that challenge time pressure
moderates the relationship between team proximity and team communication such that this relationship improves for
teams that experience high rather than low challenge time pressure. Hindrance time pressure moderates the relation-
ship between team proximity and team communication such that this relationship improves for teams that experience
low rather than high hindrance time pressure.
Our findings contribute to theory in two ways. First, this study showed that challenge and hindrance time pressure
differently influences the benefits of team proximity toward team communication in a particular work context. We found
that teams under high hindrance time pressure do not benefit from close proximity, given the natural tendency for
premature cognitive closure and the use of avoidance coping tactics when problems surface. Thus, simply reducing
physical distances is unlikely to promote communication if motivational or human factors are neglected. Second, this
study demonstrates the strength of the challenge–hindrance stressor framework in advancing theory and explaining
inconsistencies. Past studies determined time pressure by considering only its levels without distinguishing the type of
time pressure. We suggest that this study might not have been able to uncover the moderating effects of time pressure
if we had conceptualized time pressure in the conventional way.
Introduction
C
ommunication is a critical process for innova-
tion teams to achieve their goals successfully
(Ancona and Caldwell, 1992; Keller, 2001).
Functional experts working in a team require a meeting of
minds ...
Bringing Employees Closer The Effect of Proximity onCommuni.docx
1. Bringing Employees Closer: The Effect of Proximity on
Communication When Teams Function under Time Pressure
Darrel S. F. Chong, Wendelien van Eerde, Christel G. Rutte,
and Kah Hin Chai
Some studies have assumed close proximity to improve team
communication on the premise that reduced physical
distance increases the chance of contact and information
exchange. However, research showed that the relationship
between team proximity and team communication is not always
straightforward and may depend on some contextual
conditions. Hence, this study was designed with the purpose of
examining how a contextual condition like time pressure
may influence the relationship between team proximity and
team communication. In this study, time pressure was
conceptualized as a two-dimensional construct: challenge time
pressure and hindrance time pressure, such that each
has different moderating effects on the proximity–
communication relationship.
The research was conducted with 81 new product development
(NPD) teams (437 respondents) in Western Europe
(Belgium, England, France, Germany, and the Netherlands).
These teams functioned in short-cycled industries and
developed innovative products for the consumer, electronic,
semiconductor, and medical sectors. The unit of analysis
was a team, which could be from a single-team or a multiteam
project. Results showed that challenge time pressure
moderates the relationship between team proximity and team
communication such that this relationship improves for
teams that experience high rather than low challenge time
pressure. Hindrance time pressure moderates the relation-
2. ship between team proximity and team communication such that
this relationship improves for teams that experience
low rather than high hindrance time pressure.
Our findings contribute to theory in two ways. First, this study
showed that challenge and hindrance time pressure
differently influences the benefits of team proximity toward
team communication in a particular work context. We found
that teams under high hindrance time pressure do not benefit
from close proximity, given the natural tendency for
premature cognitive closure and the use of avoidance coping
tactics when problems surface. Thus, simply reducing
physical distances is unlikely to promote communication if
motivational or human factors are neglected. Second, this
study demonstrates the strength of the challenge–hindrance
stressor framework in advancing theory and explaining
inconsistencies. Past studies determined time pressure by
considering only its levels without distinguishing the type of
time pressure. We suggest that this study might not have been
able to uncover the moderating effects of time pressure
if we had conceptualized time pressure in the conventional way.
Introduction
C
ommunication is a critical process for innova-
tion teams to achieve their goals successfully
(Ancona and Caldwell, 1992; Keller, 2001).
Functional experts working in a team require a meeting of
minds for information to be effectively exchanged and
used for goal achievement. Among the strategies that
have thus been deployed to facilitate team communica-
tion, colocation is frequently pursued in research and
practice (e.g., Allen, 1977; Hoegl and Proserpio, 2004;
Keller and Holland, 1983; Te’eni, 2001; Van den Bulte
4. has yet contemplated the role of stress; in particular,
stressed caused by time pressure despite its connection
with psychological distance (e.g., Chajut and Algom,
2003; Kruglanski and Webster, 1996). In this study, psy-
chological distance refers to cognitive and affective abili-
ties as well as the readiness of actors to exchange
information. Although earlier studies on team proximity
have generally emphasized its dependence on physical
distance between members, we suggest that team proxim-
ity is also a function of psychological distance. This is
because team members, despite sitting next to one another,
are unlikely to share information if they are psychologi-
cally distanced, which occurs when people are under
intense time pressure (e.g., Hoopes and Postrel, 1999).
Furthermore, examining the role of time pressure on the
proximity–communication relationship is also timely
because escalating market competition over the last
decade has made work an increasingly stressful experi-
ence (Barczak and Wilemon, 2003). Therefore, consider-
ing time pressure potentially sheds further light on the
proximity–communication relationship.
This study contributes to research in two major ways.
First, this study extends the team proximity literature by
examining how time pressure moderates the effect of team
proximity on team communication. By adopting the
challenge–hindrance stressor framework (cf. Podsakoff,
LePine, and LePine, 2007) into the existing literature on
NPD teams, we theorized and found empirical support that
challenge time pressure, and hindrance time pressure
improves and deteriorates, respectively, the relationship
between team proximity and team communication. The
second contribution stems from the conceptualization of
the two-dimensional time pressure constructs. This devel-
opment adds to research by considering the nature of
5. stress, which researchers have argued to advance under-
standing on the influence of stress on team outcomes
(Lazarus and Folkman, 1984; LePine, LePine, and
Jackson, 2004; Selye, 1982). In the context of new product
development (NPD), the distinction between challenge
and hindrance time pressure can help to shed light on
shortening product development cycle and its effects on
team performance (Hoopes and Postrel, 1999; Perlow,
Okhuysen, and Repenning, 2002), as we have seen in this
study.
Background and Hypotheses
Scholars have posited colocation to improve team com-
munication. In this paper, we focus on three factors
through which team proximity was proposed to affect
team communication (Hinds and Kiesler, 2002). First is
team awareness. Olson, Teasley, Covi, and Olson (2002)
highlighted that team members located in close physical
proximity tend to have more understanding of one anoth-
er’s strengths, working styles, and moods than of people
that are located farther away. Similarly, Covi, Olson, and
Rocco (1998) found in an interview study that being aware
BIOGRAPHICAL SKETCHES
Dr. Darrel S. F. Chong holds a position of regional marketing
manager
(Asia Middle East) of APL Logistics, a wholly owned
subsidiary of
NOL Group based in Singapore, which specializes in shipping,
terminal,
and supply chain businesses. He received his joint Ph.D. from
the
National University of Singapore and Eindhoven University of
Technol-
6. ogy in 2010, and a bachelor’s degree (Hons) in Electrical and
Comput-
ing Engineering from National University of Singapore in 2003.
His
research was published in IEEE Transactions on Engineering
Manage-
ment and presented at Academy of Management Conference.
Darrel was
also a recipient of the Keppel Telecommunication and
Transportation
Scholarship (2000–2003).
Dr. Wendelien van Eerde is an assistant professor of
organizational
behavior at the University of Amsterdam Business School. She
received
her Ph.D. in organizational psychology at the University of
Amsterdam
in 1998. Subsequently, she worked as an assistant professor at
the
Eindhoven University of Technology until 2007. Her main
research
interests are work motivation and the use of time at work. More
specifi-
cally, she studies how people manage multiple goals over time,
procras-
tinate, and deal with time pressure. Her publications appear in
several
scholarly journals, such as Journal of Applied Psychology,
Journal of
Organizational Behaviour, IEEE Transactions on Engineering
Manage-
ment, and Applied Psychology: An International Review.
Professor Christel G. Rutte is currently a full professor of work
and
7. organizational psychology in the Department of Social
Psychology at
Tilburg University in the Netherlands. She received her M.Sc.
and Ph.D.
in social psychology from Groningen University. Her main
research
interests are workgroup processes, workgroup performance, and
time
management.
Dr. Kah Hin Chai is an assistant professor at the Industrial and
Systems
Engineering Department, National University of Singapore
(NUS). He
received his Ph.D. degree from Cambridge University (2000) in
the area
of manufacturing management. He has a master’s degree in
manufac-
turing management from University of South Australia (1996)
and bach-
elor of electrical engineering from University of Technology
Malaysia
(1992). His work experience includes management consulting
and semi-
conductor manufacturing in Singapore and Malaysia. His
current
research interests are new product development, service
innovation, and
knowledge management. His work appears in journals such as
IEEE
Transactions on Engineering Management, Journal of Service
Research, European Journal of Operational Research, and
Interna-
tional Journal of Service Industry Management.
206 J PROD INNOV MANAG D. S. F. CHONG ET AL.
8. 2012;29(2):205–215
of one another’s job scope helps team members to know
when, what, and how to communicate with one another.
The second factor is the reduced amount of effort
needed to initiate a conversation. According to Kraut,
Fussell, Brennan, and Siegel (2002), the effort to initiate
a conversation is lower when team members are in closer
physical proximity. This is due to a higher likelihood of
chance encounters (Allen, 1977; Porter, 1998) and ease of
coordinating planned meetings. The reduced effort also
implies that team members can become more efficient in
sharing information and in correcting misattribution (e.g.,
Cramton, 2001).
Third is team identity, which refers to a common per-
spective of cohesiveness and mutual acceptance among
team members (Earley and Mosakowski, 2000). Team
identity is developed when team members meet face to
face frequently (Sherif and Sherif, 1969) and work
together over a period of time (Katz, 1982). Several
studies have shown team identity to facilitate team com-
munication (e.g., Hinds and Mortensen, 2005).
Although colocation facilitates information exchange,
its influence on communication may not be straightfor-
ward. This is because the relationship, as highlighted in
the beginning of this paper, also depends on psychologi-
cal distance between members of a team (Hinds and
Kiesler, 2002). Christensen and Shenk (1991) found
people who are psychologically distanced to communi-
cate less. And if they do communicate, they are less
constructive. Hoopes and Postrel (1999) also observed
9. team members to overlook sharing of critical information
because they might be psychologically distanced by dif-
ficult deadlines. Therefore, we suggest that time pressure,
which is a prominent experience in the NPD environ-
ment, is closely related to psychological distance
between team members (Kruglanski and Webster, 1996),
and can cause people to alter their frequency and pattern
of communication even when they are in close proximity.
Before proceeding further on how time pressure may
affect the relationship between team proximity and team
communication, this paragraph explains the rationale
behind conceptualizing challenge time pressure and hin-
drance time pressure. Studies on time pressure have
adopted Yerkes and Dodson’s (1908) response-based
approach, which focuses on the levels of time pressure to
explain its effects on performance (e.g., Amabile et al.,
2002; Baer and Oldham, 2006). However, the approach
may not sufficiently explain the association between time
pressure and performance, given that the stress–
performance relationship is also contingent on the nature
of stress experienced (cf. Selye, 1982). Lazarus and
Folkman (1984) advocated that actors’ problem-solving
tactics vary with the nature of stressors experienced. For
instance, people who appraise stressful events as poten-
tially benefiting tend to take proactive actions to over-
come the difficulties imposed by the stressful situations.
Conversely, people who appraise stressful events as
potentially threatening tend to withdraw from or be
passive in stressful situations. Therefore, challenge stress
contributes to good performance while hindrance stress
leads to bad performance. Recently, research using the
challenge–hindrance stressor framework has provided
strong evidence for Lazarus and Folkman’s proposition
(e.g., Cavanaugh, Boswell, Roehling, and Boudreau,
10. 2000; LePine et al., 2004; Podsakoff et al., 2007). There-
fore, this study used LePine and colleagues’ framework
to conceptualize time pressure as challenge or hindrance
time pressure. This enables us to better differentiate and
to gain stronger insights into the influence of time pres-
sure on the relationship between team proximity and
team communication.
Hypotheses
As revealed by some studies, team proximity improves
communication because of three underlying factors.
People in close proximity tend to experience team aware-
ness, require less effort to initiate conversation, and expe-
rience a strong sense of team identification. These factors
explain the direct relationship between proximity and
communication. However, we also expect the relationship
to depend on the time pressure experienced by teams
because beyond physical distance, challenge time pres-
sure, and hindrance time pressure appear to affect the three
underlying factors by altering team members’ cognitive
and affective readiness and ability to exchange informa-
tion. We term this mechanism psychological distance.
Challenge time pressure is associated with fulfillment
and a strong proclivity to succeed. These experiences
serve as a motivating force in teams (Selye, 1982). Under
such circumstances, a person with constrained attentional
resources can still engage vigorously in cognitive activi-
ties if he or she is stimulated to persist in the course of
action (De Dreu and Carnevale, 2003). Pieters and
Warlop (1999) conducted a field study to explore the
effects of motivation on how people gather purchasing
information under time pressure. The authors found the
motivated groups to exert more effort in acquiring infor-
mation than other groups. This indicates that challenge
11. time pressure can facilitate information exchange. Thus,
teams that experience challenge time pressure are likely
to experience lower psychological distance between one
another.
EFFECT OF PROXIMITY ON TEAM COMMUNICATION
UNDER TIME PRESSURE J PROD INNOV MANAG 207
2012;29(2):205–215
Because challenge time pressure is associated with
lower psychological distance, teams that experience high
challenge time pressure are cognitively and affectively
more ready than low challenge time-pressured teams to
take advantage of close physical proximity to exchange
information (Hinds and Kiesler, 2002). This is because
lower psychological distance encourages people to find
opportunities to tap into proximate resources and network
to meet deadlines. Hence, we expect challenge time-
pressured teams to experience the following. First, such
teams will capitalize on their awareness (knowledge) of
the teams’ capabilities and resources to exchange useful
information to fulfill the teams’ objectives (Ashford and
Cummings, 1985). Second, such teams will be more
spontaneous and take seemingly even less effort to
engage in constructive conversation because of the
lowered psychological distance (Kruglanski and Webster,
1996). Finally, such teams will experience a deeper sense
of team identity given the lowered psychological barriers
to unite to overcome the challenging tasks ahead (Gittell,
2003). These experiences demonstrate that high chal-
lenge time pressure has positive effects on the three
underlying factors that govern the relationship between
team proximity and team communication, which explains
why challenge time pressure teams communicate better
12. than other teams that are located within the same physical
proximity but are not challenge by time pressure. There-
fore, we propose the following hypothesis:
H1: Challenge time pressure moderates the relationship
between team proximity and team communication such
that this relationship improves for teams that experience
high rather than low challenge time pressure.
In contrast to challenge time pressure, hindrance time
pressure is associated with hassles and constraints to goal
achievement. Cognitive closure theory suggests time
pressure to threaten information exchange if the stress is
perceived to be hindering (Kruglanski and Webster,
1996). People in such a situation tend to engage in
shallow communication and close their minds to rethink
solutions to problems, or even choose not to revisit avail-
able information to minimize onerous processing of
complex information. This suggests that hindrance time
pressure leads people to overlook peripheral information
and social cues (Kelly and Loving, 2004). Hence, teams
that experience hindrance time pressure are likely to
experience higher psychological distance between one
another.
Because hindrance time pressure is associated with
higher psychological distance, teams that experience high
hindrance time pressure are cognitively and affectively
less ready and able than low hindrance time pressure teams
to take advantage of close physical proximity to exchange
information (Hinds and Kiesler, 2002). This is because
heightened psychological distance discourages people
from seeking additional information, including from
proximate resources and networks to meet deadlines
(Driskell, Salas, and Johnston, 1999). Thus, we expect
13. hindrance time-pressured teams to experience the follow-
ing. First, such teams tend not to capitalize on their aware-
ness (knowledge) of the teams’ capabilities and resources
as they are more concerned about meeting immediate
deadlines than exchanging more information, which
requires both effort and time (Kruglanski and Webster,
1996). Second, such teams will be more focused on their
individual tasks and avoid engaging in conversations
despite the physical proximity because of the higher psy-
chological distance (Kruglanski and Webster, 1996).
Finally, such teams also tend to experience a weaker sense
of team identity as members avoid social cues and are
more self-focused in completing their individual tasks
(Kelly and Loving, 2004). Thus, high hindrance time
pressure has detrimental effects on the three underlying
factors that govern the relationship between team proxim-
ity and team communication, which explains why teams
not affected by hindrance time pressure communicate
better than other teams that are located within the same
physical proximity but are affected by hindrance time
pressure. Therefore, we propose the following hypothesis:
H2: Hindrance time pressure moderates the relationship
between team proximity and team communication such
that this relationship improves for teams that experience
low rather than high hindrance time pressure.
Methods
Research Setting and Procedures
The research was conducted with 81 NPD teams in
Western Europe (Belgium, England, France, Germany,
and the Netherlands). These teams functioned in short-
cycled industries and developed innovative products for
the consumer, electronic, semiconductor, and medical
14. sectors. The unit of analysis was a team, which could be
from a single-team or a multiteam project. When the
survey took place, overall 74 teams were still active: in
the design (19%), testing (41%), or initial production
(31%) stages. In total, 437 informants contributed data to
this study, 356 of whom were team members, and 81
were project managers. The teams consisted of 4–18 core
members (x = 7.2, standard deviation [s.d.] = 3.8); 94%
were male; the average age was 38 years (s.d. = 7.9); the
208 J PROD INNOV MANAG D. S. F. CHONG ET AL.
2012;29(2):205–215
average time with the current team was 2.5 years
(s.d. = 2.3). Our informants had worked in NPD-related
industries on an average of 10 years (s.d. = 7.4), and most
of them were highly educated, with 94% having at least a
bachelor’s degree or a diploma. A large proportion of our
sample was natives from Northern or Western Europe
(93.6%). The rest were from Eastern Europe (3.7%),
Southern Europe (1.6%), and America or Asia (1.1%).
We invited teams for this survey by approaching vice
presidents and project managers of organizations devel-
oping new products to take part in this study. Contacts
who were interested then identified one or more suitable
teams from their departments for our follow-up. About
40% of the contacts that we approached recommended
teams to participate in the survey. A team was assessed
for participation based on a few criteria. The team (1) has
at least four members, including the project manager, to
take part in the survey; (2) was functioning in short-
cycled industries; (3) was developing innovative prod-
ucts; (4) was located in Western Europe; and (4) worked
15. in the same site. In this study, we adopted an informant
sampling approach to attract a higher team response rate
through reducing the total amount of time needed from
each participating team (Van de Ven and Ferry, 1980).
The informant sampling approach recognizes that many
members of a team are suited to provide good assessment
pertaining to their work and team. Hence, we depended
on “a limited selective sample of people who are knowl-
edgeable of the global properties of interest” (Van de Ven
and Ferry, 1980, p. 72) rather than on all the team
members to provide us with the data needed.
The survey was sent electronically in two parts to all
informants. The team and project manager’s names were
printed on introduction emails to ascertain that infor-
mants made reference to the correct project while engag-
ing in the survey. Part two was sent to informants a day
after they had submitted complete answers to part one.
We took the two-part survey design for two reasons: (1)
to keep the survey length at each attempt short to facili-
tate quality response and (2) to introduce a time lag
between input to the moderator (challenge and hindrance
time pressure) and criterion (team communication) vari-
ables because these variables were measured by the same
informants. Finally, informants were assured that their
input would be used only for research purposes and be
kept completely confidential. The response rate for part
one was 94%, and 98% of those who completed part one
also completed part two.
The approach of the study has made our results less
susceptible to common method variance. We shall discuss
this from three perspectives. First, this study is team-level
research. Research has shown variables measured using
multiple informants to be less susceptible to common
16. method bias. This is because aggregating responses pro-
vides a more complete measurement of the focal team
characteristics, which increases the reliability of the
response (Atuahene-Gima and Murray, 2004; Kumar,
Stern, and Anderson, 1993). Second, not all our measure-
ments are subjective measures. While the criterion vari-
able (team communication) is a subjective measure, the
predictor variable (team proximity) is an objective
measure, hence one that is less susceptible to mood state,
social desirability, and halo effects. This potentially
reduces the chance of main effects inflation and common
method variance (Podsakoff, Mackenzie, Lee, and Pod-
sakoff, 2003). Third, the primary interest of this study is
related to moderation effects. This reduces the suscepti-
bility of our results to common method variance.
Research has found that although common method bias
tends to inflate main effects, it also tends to suppress
interaction effects (Evans, 1985; McClelland and Judd,
1993). Since we found significance in the moderation
analysis (as demonstrated in the Results section),
common method bias did not appear to be an issue in this
study.
Nonetheless, the data collection process was carefully
designed to minimize common method bias by imple-
menting the recommendations put forth by Podsakoff
et al. (2003). We did so by separating the measurements
temporally and psychologically. Respondents were asked
to measure team proximity, challenge time pressure, and
hindrance time pressure in the first survey, and to measure
team communication in the second survey. This approach
introduced a time lag and led respondents to leave short-
term memory. The average time lag for receiving the two
parts was 16.5 days (s.d. = 13.5). Because the response
formats of team proximity and team communication were
different, the two measurements were separated method-
17. ologically. Such separation reduces the respondents’
ability and motivation to use previous answers to infer
missing details.
Measures
Prior to data analysis, we established that the answers of
the respondents within teams were more similar than
those between teams by computing the average interrater
agreement coefficient (rwg; James, Demaree, & Wolf,
1993) and the interclass correlation coefficient (ICC(1);
Kenny & Lavoie, 1985). Means of the combined ratings
of informants belonging to the same team were subse-
quently computed and used for further analysis.
EFFECT OF PROXIMITY ON TEAM COMMUNICATION
UNDER TIME PRESSURE J PROD INNOV MANAG 209
2012;29(2):205–215
Team proximity was measured based on the method
described by Keller (1986), where the author asked each
participant to estimate the walking distance between his
or her primary workstation to those of each of three other
team members who were the most valuable source of
information for the respondent’s work in the project. In
this study, the distances were measured in meters. We
encountered some data (5.6%) where informants indi-
cated the walking distances between them and one or
more colleagues to be greater than 200 meters, for
example, in the range of 500–1500 meters. This was to be
expected, as innovative projects are increasingly using
multisite teams to develop new products (Evaristo and
Van Fenema, 1999). A team member’s valuable sources
of information may, therefore, be located in another site.
18. Because data of distance greater than 200 meters
occurred almost randomly within any particular team, we
approximated these data to 200 meters in our analysis.
We suggest that this is a reasonable choice because
according to Allen (1977), a walking distance of more
than 30 meters between two individuals is usually con-
sidered remote. Hence, considering distances greater than
200 meters in the analysis would bring little benefit con-
ceptually. Moreover, given the random nature of these
data, computing the actual distances (greater than 200
meters) might undesirably increase the means and vari-
ances of proximity for some teams. A factor analysis of
the three distances to other team members of each respon-
dent showed these data to load satisfactorily on one
factor, explaining 61.5% of variability. Thus, the three
data points were averaged (e.g., x meters) for each
respondent and reversed coded (200 – x) to compute the
proximity for their respective teams.
Team communication was assessed using the ten-item
scale developed by Hoegl and Gemuenden (2001). The
items asked informants the extent to which members of
their team communicated frequently, spontaneously,
directly, timely, and openly with one another. Three
examples of the scale are “there was frequent communi-
cation within the team,” “important information was kept
away from other team members in certain situations
(reversed coded),” and “the team members were happy
with the timeliness in which they received informa-
tion from other team members.” One item was excluded
from the scale because its item-to-total correlation (.14)
was far below the acceptable level of .40 (Bennett and
Robinson, 2000). The scale was measured with a range
from 1 “to little extent” to 7 “to great extent” (a = .87;
rwg = .92; ICC(1) = .12).
19. Challenge and hindrance time pressure were measured
using a five-item and an eight-item scale, respectively (see
the Appendix). A rigorous process consisting of three
phases based on the procedures conducted by Cavanaugh
et al. (2000) and LePine et al. (2004) was used to develop
the scales. In the first phase, we interviewed 49 practitio-
ners (eight teams) from Western Europe working in NPD
industries to gather examples on the causes of time pres-
sure. In total, we gathered 167 examples and classified
them into nine categories. Subsequently, these were evalu-
ated with validated time pressure scales (e.g., Amabile
et al., 1996) and work stress scales (e.g., Cavanaugh et al.,
2000) to generate an initial 20 items for challenge and
hindrance time pressure. In the second phase, we invited
another 33 NPD practitioners to categorize each item as
either a stressor leading to challenge time pressure,
leading to hindrance time pressure, or not clearly falling in
either of the categories. The classification was conducted
using an electronic survey and was based on the construct
definitions presented earlier. Based on the feedback from
the participants, we reduced the initial number of items to
13; five for challenge time pressure and eight for hindrance
time pressure. Importantly, this phase ensured that the
items were refined based on perspectives from the field. In
the third phase, we recruited two independent academic
judges who were unrelated to the research to classify the
13 items into either the challenge or the hindrance cat-
egory. The judges were allowed to refer to the construct
definitions during the task. The categorization of the
judges was 88% (23 of 26 items) consistent with the prior
categorization, providing evidence that the scales were
satisfactory. Finally, we invited the 437 team members
from this study to respond to the 13 time pressure items.
The responses were required both at the individual level
and at the team level on the extent to which each item leads
20. to challenge and hindrance time pressure, respectively,
with scales ranging from 1 “not at all” to 7 “a great deal.”
This step provided added certainty that participants were
able to associate the items to challenge and hindrance time
pressure. The Cronbach’s alpha of the two scales (a =
.86 | challenge, a = .88 | hindrance) provided good evidence that
the scales are acceptable in terms of reliability. Because
informants were asked to repeat their ratings of the 13
items for both scales, we were able to validate statistically
if any of the challenge time pressure items belong to the
hindrance time pressure scale, and vice versa.
An example of the challenge time pressure scale is
“the technological complexity that the team needs to
overcome to complete this project on time.” (rwg = .83;
ICC(1) = .10 | challenge). An example of the hindrance
time pressure scale is “the lack of time buffer
that is planned for this project.” (rwg = .85; ICC(1) =
.15 |hindrance). A confirmatory factor analysis (CFA) was
210 J PROD INNOV MANAG D. S. F. CHONG ET AL.
2012;29(2):205–215
also conducted. We found good support for the two-factor
model (c2[64] = 213.9; comparative fit index [CFI] = .94;
goodness-of-fit index [GFI] = .93; root mean square
error of approximation [RMSEA] = .072). A one-factor
model was also tested (c2[65] = 3305.0; CFI = .32;
GFI = .47; RMSEA = .33). The chi-square difference
between the two-factor model and the one-factor model
was significant (Dc2[1] = 3091.1, p < .001). These results
support the two-factor structure of time pressure pro-
posed in this study. The ICC(1) of .10 for challenge
time pressure indicated that the scale accounted for a
21. reasonable proportion of the variance in individual
responses. Although the ICC(1) was not as high as the
“hurdle rates” of .12, aggregation is still acceptable if
research questions and hypotheses of a study require a
particular level of analysis (James, 1982). Following the
work of Keller (2001) and Kirkman, Rosen, Tesluk, and
Gibson (2004), challenge time pressure was aggregated
to team mean.
In addition, we also conducted CFA with the three
factors (i.e., two types of time pressure and team com-
munication). The results yielded reasonable support for
the three-factor model (c2[206] = 896.69; CFI = .93;
GFI = .84; RMSEA = .088, normed fit index [NFI] = .9,
standardized root mean square residual [SRMR] = .067).
Although the GFI is on the low side, we suggest that the
model is acceptable given the validity of other statistics
like CFI, SRMR, and NFI (Kelloway, 1998). In addition,
factor loadings for all the items are significant and higher
than .5, thus providing support to measurement validity.
Team size and team tenure were included as control
variables because prior work had suggested them to relate
to team communication (e.g., Ancona and Caldwell,
1992; Katz, 1982; Keller, 2001). Team size was measured
based on the number of core members in each team. Team
tenure was measured with project managers’ input on the
number of years their members have been working
together, including in previous projects.
Results
Table 1 provides the team-level correlations and descrip-
tive statistics for the variables. None of this study’s vari-
ables had a variable inflation factor above 2.0, indicating
that multicollinearity was not a significant problem. In
22. addition, the condition indices for the model were also
evaluated. All of the condition indices (<1.77) were far
below the 15 mark. This further indicates that our model
does not have multicollinearity problem.
The table shows that the correlation between team
proximity and team communication is nonsignificant
(r = .10, p = n.s.). Table 2 presents the results of the mod-
erated hierarchical regression analysis used to test H1 and
H2. After centering our independent variables (Aiken
and West, 1991), we introduced the control variables and
main effects into a regression equation. Next, to test our
Table 1. Means, Standard Deviations, and Correlationsa
Variable M SD 1 2 3 4 5
1 Team proximity (meter)b 167.8 24.0
2 Team communication 5.10 .50 .10
3 Challenge time pressure 4.36 .59 .12 .50**
4 Hindrance time pressure 4.15 .68 -.04 -.37** -.17
5 Team size 7.21 3.80 .06 .01 .10 .06
6 Team tenure (year)c 1.40 .99 .02 -.15 .00 .18 .10
a n = 81 teams; b reverse coded and measured in meters; c
measured in years; ** p < .01; * p < .05; † p < .10.
SD, standard deviation.
Table 2. Hierarchical Regression Analysis of the
Moderating Role of Challenge and Hindrance
Time Pressure
Variables
Team Communication
1 2 3
23. Control
Team size .03 -.01 .00
Team tenure -.15 -.10 -.08
Main effects
Team proximity .04 .10
Challenge time pressure .45** .47**
Hindrance time pressure -.27** -.25**
Moderation effects
Team proximity ¥ challenge time pressure .21*
Team proximity ¥ hindrance time pressure -.15†
Incremental R2 .20 .09
R2 .15 .35 .43
Adjusted R2 .02 .30 .38
** p < .01; * p < .05; † p < .10; Standardized regression
coefficients are
reported.
One tailed for hypothesized effects and two tailed for other
effects.
EFFECT OF PROXIMITY ON TEAM COMMUNICATION
UNDER TIME PRESSURE J PROD INNOV MANAG 211
2012;29(2):205–215
predictions that team proximity is more highly related to
team communication (1) when challenge time pressure is
high than when it is low (H1) and (2) when hindrance
time pressure is low than when it is high (H2), we intro-
duced the interaction term of team proximity and chal-
lenge time pressure and the interaction term of team
24. proximity and hindrance time pressure to the model at the
same time. As shown in Table 2, the coefficient associ-
ated with the interaction term of team proximity and
challenge time pressure was significant (b = .21, p < .05).
The coefficient associated with the interaction term of
team proximity and hindrance time pressure was signifi-
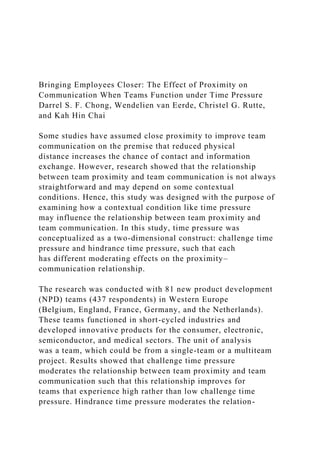
cant (b = -.15, p < .10). An inspection of the interaction
plots (Figures 1 and 2) with simple slope tests (Aiken and
West, 1991) revealed that only the slopes related to high
challenge time pressure and low hindrance time pressure
were significant. The plots show that teams communicate
more effectively when their members are located proxi-
mately when they experienced high challenge time pres-
sure or low hindrance time pressure. The findings are
consistent with our hypotheses. As a result, both H1 and
H2 were supported. Additionally, the results also suggest
that bringing team members closer yields virtually no
benefit on team communication in low challenge or high
hindrance time pressure situations.
Discussion
This paper addresses the tenet that team proximity
improves team communication. Our findings demonstrate
that effective communication in teams depends not only
on physical distance (the ease of reach) but also on per-
ceived time pressure, such that high challenge and low
hindrance time pressure environments are conducive to
team communication. Although team proximity is a well-
researched topic, bringing time pressure into the picture
enabled us to gather further insight into this area.
Our findings contribute to theory in two ways. First,
this study showed that challenge and hindrance time pres-
sure differently influences the benefits of team proximity
25. toward team communication in a particular work context.
We found that teams under high hindrance time pressure
do not benefit from close proximity, given the natural
tendency for premature cognitive closure and the use of
avoidance coping tactics when problems surface. Simi-
larly, teams experiencing low challenge time pressure do
not gain from close proximity. This is an interesting
outcome as it underscores the importance of challenge for
teams to function effectively (e.g., Wageman, 2001).
Thus, simply reducing physical distances is unlikely to
promote communication if motivational or human factors
are neglected (cf. King and Majchrzak, 1996).
Importantly, this study demonstrates the strength of
the challenge–hindrance stressor framework in advancing
theory and explaining inconsistencies. Past studies deter-
mined time pressure by considering only its levels
without distinguishing the type of time pressure. We
suggest that this study might not have been able to
uncover the moderating effects of time pressure if we had
conceptualized time pressure in the conventional way.
For example, if time pressure is measured in the general
way, high time pressure may or may not moderate the
proximity–communication relationship, depending on
whether a team perceives time pressure as highly chal-
lenging or highly hindering. In most cases, the outcomes
would be masked because of the aggregated effects of
challenge and hindrance time pressure. This would pos-
sibly lead to insignificant conclusions. In addition, our
results have highlighted the advantages of conceptualiz-
ing time pressure as a two-dimensional work stress and
also served to extend the framework introduced by
Low Challenge Time Pressure (p = n.s.)
High Challenge Time Pressure (p = .06)
26. Figure 1. Effects of Challenge Time Pressure on Interaction
between Team Proximity and Team Communication
High Hindrance Time Pressure (p = n.s.)
Low Hindrance Time Pressure (p = .05)
Figure 2. Effects of Hindrance Time Pressure on Interaction
between Team Proximity and Team Communication
212 J PROD INNOV MANAG D. S. F. CHONG ET AL.
2012;29(2):205–215
LePine and his colleagues. So far, it had been applied to
examine individual-level outcomes. In this study, we
extended the framework and used it to address inconsis-
tencies at the team level.
On a separate note, we found an insignificant relation-
ship between team proximity and team communication,
similar to previous studies (e.g., Conrath, 1973). We
explain this finding by suggesting that communication is
a matter of heart and mind (Kruglanski, 1996); mere
physical distance alone may not have significant effects.
This study is not without limitations, and it is impor-
tant to indicate them. The first limitation is that we did not
collect data concerning team awareness, effort to initiate
conversations, or team identity to provide an empirical
argument for the nonsignificant relationship between
team proximity and team communication. This portion of
the study needs to be investigated in the future. Another
limitation is the small sample size of 81 teams. The third
27. limitation is that we did not take into account the physical
barriers, such as partitions or doors, in the offices while
examining the relationship between team proximity and
team communication. Hatch (1987) found physical bar-
riers to improve communication, as barriers help a team
to define its boundaries and sense of identity. Hatch’s
findings implied that close proximity does not necessarily
improve team communication if there is no landmark to
signify a team boundary, and simply placing multiple
teams in a huge open hall does not facilitate communi-
cation within a team. This could be an alternative expla-
nation for not finding a significant relationship between
team proximity and team communication in this study.
The outcomes of this study are important for managers
and practitioners. The results showed that simply locating
team members close to one another does not guarantee
improved communication. This is especially so for teams
functioning in short-cycled industries. The effects of
close proximity depend on whether team members are
willing to make use of the short distances between one
another to exchange information. Management with the
intent to adopt colocation as a means to facilitate com-
munication should also attempt to cultivate a work envi-
ronment where employees experience challenge time
pressure. Accordingly, we encourage managers to iden-
tify and eliminate factors that cause hindrance time pres-
sure. On the one hand, managers could attempt to reduce
hindrance time pressure by designing realistic project
schedule and deliverables, and by planning downtime in
between projects so that teams can recuperate from high
strain projects during these intervals. These can be
achieved through active engagements with team
members. In addition, providing team members with rea-
sonable levels of autonomy for decision making and man-
28. aging the frequency of status reporting also helps teams
to feel that they are trusted.
On the other hand, managers could increase challenge
time pressure by underlining the importance of the
project. It is fundamental for managers to understand
what challenges the team and induces them to work
together. Is it the complexity of a particular technology?
Or is it the collective desire to advance consumer life-
styles, to develop a sustainable solution, or to see a break-
through in a medical field? Managers that are able to keep
their teams focused on achieving a goal are likely to
witness their teams endure time pressure and perceive it
as stimulus. In fact, our time pressure scales show that at
the team level, dependency and commitment are two
team components that induce team members to experi-
ence time pressure as a challenge. Based on that finding,
we encourage managers to plan activities and training
that will help teams to develop a stronger sense of inter-
dependency and team commitment before putting them
through high time pressure missions.
References
Aiken, L. S., and S. G. West. 1991. Multiple regression: Testing
and
interpreting interactions. Newbury Park, CA: Sage.
Allen, T. J. 1977. Managing the flow of technology. Cambridge,
MA: MIT
Press.
Amabile, T. M., R. Conti, H. Coon, J. Lazenby, and M. Herron.
1996.
Assessing the work environment for creativity. Academy of
Manage-
29. ment Journal 39: 1154–84.
Amabile, T. M., J. S. Mueller, W. B. Simpson, C. N. Hadley, S.
J. Kramer,
and J. Fleming. 2002. Time pressure and creativity in
organization.
A longitudinal field study. Working paper, Harvard Business
School,
2–73.
Ancona, D. G., and D. F. Caldwell. 1992. Bridging the
boundary: External
activity and performance in organizational teams.
Administrative
Science Quarterly 37: 634–66.
Ashford, S. J., and L. L. Cummings. 1985. Proactive feedback
seeking: The
instrumental use of the information environment. Journal of
Occupa-
tional Psychology 58: 67–79.
Atuahene-Gima, K., and J. Y. Murray. 2004. Antecedents and
outcomes of
marketing strategy comprehensiveness. Journal of Marketing
68:
33–46.
Baer, M., and G. R. Oldham. 2006. The curvilinear relation
between expe-
rienced creative time pressure and creativity: Moderating
effects of
openness to experience and support for creativity. Journal of
Applied
Psychology 91: 963–70.
30. Barczak, G., and D. Wilemon. 2003. Team member experiences
in new
product development: Views from the trenches. R&D
Management 33:
463–79.
Bennett, R. J., and S. L. Robinson. 2000. Development of a
measure of
workplace deviance. Journal of Applied Psychology 85: 349–60.
Cavanaugh, M. A., W. R. Boswell, M. V. Roehling, and J. W.
Boudreau.
2000. An empirical examination of self-reported work stress
among
U.S. managers. Journal of Applied Psychology 85: 65–74.
Chajut, E., and D. Algom. 2003. Selective attentive improves
under stress:
Implications for theories of social cognition. Journal of
Personality
and Social Psychology 85: 231–48.
EFFECT OF PROXIMITY ON TEAM COMMUNICATION
UNDER TIME PRESSURE J PROD INNOV MANAG 213
2012;29(2):205–215
Christensen, A., and J. L. Shenk. 1991. Communication,
conflict, and
psychological distance in nondistressed, clinic, and divorcing
couples.
Journal of Consulting and Clinical Psychology 59: 458–63.
Conrath, D. W. 1973. Communications environment and its
relationship to
31. organizational structure. Management Science 20: 586–603.
Covi, L. M., J. S. Olson, and E. Rocco. 1998. A room of your
own: What do
we learn about support of teamwork from assessing teams in
dedicated
project rooms? In Cooperative buildings, ed. N. Streitz, S.
Konomi, and
H. J. Burkhardt, 53–65. Amsterdam: Springer-Verlag.
Cramton, C. D. 2001. The mutual knowledge problem and its
consequences
for dispersed collaboration. Organization Science 12: 346–71.
De Dreu, C. K. W., and P. J. Carnevale. 2003. Motivational
bases of
information processing and strategy in conflict and negotiation.
In
Advances in experimental social psychology, Vol. 35, ed. M.
Zanna,
235–91. New York: Academic Press.
Driskell, J. E., E. Salas, and J. Johnston. 1999. Does stress lead
to a loss of
team perspective? Group Dynamics: Theory, Research, and
Practice 3:
291–302.
Earley, P. C., and E. Mosakowski. 2000. Creating hybrid team
cultures: An
empirical test of transnational team functioning. Academy of
Manage-
ment Journal 43: 26–49.
Evans, M. G. 1985. A Monte Carlo study of the effects of
correlated method
32. variance in moderated multiple regression analysis.
Organizational
Behavior and Human Decision Processes 36: 305–23.
Evaristo, R., and P. C. Van Fenema. 1999. A typology of project
manage-
ment: Emergence and evolution of new forms. International
Journal of
Project Management 17: 275–81.
Ganesan, S., A. J. Malter, and A. Rindfleisch. 2005. Does
distance still
matter? Geographic proximity and new product development.
Journal
of Marketing 69: 44–60.
Gittell, J. H. 2003. The Southwest Airlines way: Using the
power of rela-
tionships to achieve high performance. Boston, MA: McGraw-
Hill.
Hatch. M. J 1987. Physical barriers, task characteristics, and
interaction
activity in research and development firms. Administrative
Science
Quarterly 32: 387–99.
Hinds, P., and S. Kiesler. 2002. Distributed work. Cambridge,
MA: MIT
Press.
Hinds, P., and M. Mortensen. 2005. Understanding conflict in
geographi-
cally distributed teams: An empirical investigation.
Organization
Science 16: 290–307.
33. Hoegl, M., and H. G. Gemuenden. 2001. Teamwork quality and
the success
of innovative projects: A theoretical concept and empirical
evidence.
Organization Science 12: 438–49.
Hoegl, M., and L. Proserpio. 2004. Team member proximity and
teamwork
in innovative projects. Research Policy 33: 1153–65.
Hoopes, D. G., and S. Postrel. 1999. Shared knowledge,
“glitches,” and
product development performance. Strategic Management
Journal 20:
837–65.
James, L. R. 1982. Aggregation bias in estimates of perceptual
agreement.
Journal of Applied Psychology 67: 219–29.
James, L. R., R. G. Demaree, and G. Wolf. 1993. Rwg: An
assessment of
within-group interrater agreement. Journal of Applied
Psychology 8:
306–9.
Kahn, K. B., and E. F. McDonough III. 1997. An empirical
study of the
relationship among co-location, integration, performance, and
satisfac-
tion. Journal of Product Innovation Management 14: 161–78.
Katz, R. 1982. The effects of group longevity on project
communication
and performance. Administrative Science Quarterly 27: 81–104.
34. Keller, R. T. 1986. Predictors of the performance of project
groups in R&D
organizations. Academy of Management Journal 29: 715–26.
Keller, R. T. 2001. Cross-functional project groups in research
and new
product development: Diversity, communications, job stress,
and out-
comes. Academy of Management Journal 44: 547–57.
Keller, R. T., and W. E. Holland. 1983. Communicators and
innovators in
research and development organizations. Academy of
Management
Journal 26: 742–49.
Kelloway, E. K. 1998. Using LISREL for structural equation
modeling:
A researcher’s guide. Thousand Oaks, CA: Sage.
Kelly, J. R., and T. J. Loving. 2004. Time pressure and group
performance:
Exploring underlying processes in the attentional focus model.
Journal
of Experimental Social Psychology 40: 185–98.
Kenny, D. A., and L. Lavoie. 1985. Separating individual and
group effects.
Journal of Personality and Social Psychology 48: 339–48.
Kessler, E. H. 2000. Tightening the belt: Methods for reducing
develop-
ment costs associated with new product innovation. Journal of
Engi-
neering and Technology Management 17: 59–92.
35. King, N., and A. Majchrzak. 1996. Concurrent engineering
tools: Are the
human issues being ignored? IEEE Transaction on Engineering
Man-
agement 43: 189–201.
Kirkman, B. L., B. Rosen, P. E. Tesluk, and C. B. Gibson. 2004.
The impact
of team empowerment on virtual team performance: The
moderating
role of face-to-face interaction. Academy of Management
Journal 47:
175–92.
Kraut, R. E., S. R. Fussell, S. E. Brennan, and J. Siegel. 2002.
Understand-
ing effects of proximity on collaboration: Implications for
technologies
to support remote collaboration. In Distributed work, ed. P. S.
Hinds
and S. Kiesler, 137–62. Cambridge, MA: MIT Press.
Kruglanski, A. W. 1996. Motivated social cognition: Principles
of the
interface. In Social psychology: A handbook of basic principles,
ed.
E. T. Higgins and A. W. Kruglanski, 493–522. New York:
Guilford
Press.
Kruglanski, A. W., and D. M. Webster. 1996. Motivated closing
of the
mind: “Seizing” and “freezing.” Psychological Review 103:
263–83.
36. Kumar, N., L. Stern, and J. C. Anderson. 1993. Conducting
interorganiza-
tional research using key informants. Academy of Management
Journal
36: 1633–51.
Lau, D. C., and J. K. Murnighan. 2006. Interactions within
groups and
subgroups: The effects of demographic faultlines. Academy of
Man-
agement Journal 48: 645–59.
Lazarus, R. S., and S. Folkman. 1984. Stress, appraisal, and
coping. New
York: Springer.
LePine, J. A., M. A. LePine, and C. J. Jackson. 2004. Challenge
and
hindrance stress: Relationships with exhaustion, motivation to
learn,
and learning performance. Journal of Applied Psychology 89:
883–91.
McClelland, G. H., and C. M. Judd. 1993. Statistical difficulties
of detect-
ing interactions and moderator effects. Psychological Bulletin
114:
376–90.
Olson, J. S., S. D. Teasley, L. Covi, and G. Olson. 2002. The
(currently)
unique advantage of collocated work. In Distributed work, ed.
P. J.
Hinds and S. Kiesler, 113–35. Cambridge, MA: MIT Press.
Perlow, L. A., G. A. Okhuysen, and N. P. Repenning. 2002. The
37. speed trap:
Exploring the relationship between decision-making and
temporal
context. Academy of Management Journal 45: 931–55.
Pieters, R., and L. Warlop. 1999. Visual attention during brand
choice: The
impact of time pressure and task motivation. International
Journal of
Research in Marketing 16: 1–16.
Podsakoff, N. P., J. A. LePine, and M. A. LePine. 2007.
Differential chal-
lenge stressor-hindrance stressor relationships with job
attitudes, turn-
over intentions, turnover, and withdrawal behavior: A meta
analysis.
Journal of Applied Psychology 92: 438–54.
Podsakoff, P. M., S. B. Mackenzie, J. Y. Lee, and N. P.
Podsakoff. 2003.
Common method biases in behavioral research: A critical
review of the
literature and recommended remedies. Journal of Applied
Psychology
88: 879–903.
Porter, M. E. 1998. Clusters and the new economy of
competition. Harvard
Business Review 76: 77–90.
Selye, H. 1982. History and present status of the stress concept.
In Hand-
book of stress, ed. L. Goldberger and S. Breznitz, 7–17. New
York: Free
Press.
38. 214 J PROD INNOV MANAG D. S. F. CHONG ET AL.
2012;29(2):205–215
Sethi, R. 2000. Superordinate identity in cross-functional
product develop-
ment teams: Its antecedents and effect on new product
performance.
Journal of Academy of Marketing Science 28: 330–34.
Sethi, R., and C. Y. Nicholson. 2001. Structural and contextual
correlates of
charged behavior in product development teams. Journal of
Product
Innovation Management 18: 154–68.
Sherif, M., and C. W. Sherif. 1969. Social psychology. New
York: Harper &
Row.
Te’eni, D. 2001. Review: A cognitive-affective model of
organizational
communication for designing IT. MIS Quarterly 25: 251–312.
Van De Ven, A. H., and D. L. Ferry. 1980. Measuring and
assessing
organizations. New York: Chichester.
Van Den Bulte, C., and R. K. Moenaert. 1998. The effects of
R&D team
co-location on communication among R&D, marketing, and
manufac-
turing. Management Science 44: 1–18.
39. Victor, B., and C. Stephens. 1994. The dark side of the new
organizational
forms: An editorial essay. Organization Science 5: 479–82.
Wageman, R. 2001. How leaders foster self-managing team
effectiveness:
Design choices versus hands-on coaching. Organization Science
12:
559–77.
Yerkes, R. M., and J. D. Dodson. 1908. The relation of strength
of stimulus
to rapidity of habit-formation. Journal of Comparative
Neurology and
Psychology 18: 459–82.
Appendix Construct Measurement
1 = strongly disagree to 7 = strongly agree Loading
Challenge time pressure (a = .86). Source: self-developed
To what extent do the following cause the team to experience
positive time pressure (makes you feel good,
joyful, satisfied, stimulated) in the project?
1. The importance of completing this project on time. .70
2. The degree to which team members depend on one another to
finish this project on time. .68
3. The urgent need for successful completion of the work the
team is doing. .76
4. The extent to which the team committedly works together to
complete the project on time. .78
5. The technological complexity that the team needs to
overcome to complete this project on time. .63
Hindrance time pressure (a = .88). Source: self-developed
To what extent do the following cause the team to experience
40. negative time pressure (makes you feel annoyed,
upset, bothered, discouraged) in the project?
1. The impossibility to fulfill the project schedule. .77
2. The lack of time buffer that is planned for this project. .59
3. The excessive reporting of the project team status required by
the management. .80
4. The number of changes on the team tasks at the late stages of
the project. .72
5. The inability for the team to do more iteration to improve the
project deliverables. .72
6. The amount of constant switching between tasks for the team
in a day. .69
7. The persisting period of high time pressure the team
experienced. .56
8. The imbalance in my team members’ personal lives due to the
time pressure from this project. .76
Team communication (a = .87). Source: Hoegl and Gemuenden
(2001)
For each statement, use the following scale to indicate which is
most descriptive of your team.
1. There was frequent communication within the team. .62
2. The team members were happy with the timeliness in which
they received information from other team
members.
.67
3. The team members were happy with the precision of the
information received from other team members. .77
4. The team members were happy with the usefulness of the
information received from other team members. .79
5. The team members communicated often in spontaneous
meetings, phone conversation, etc. .55
6. The team members communicated mostly directly and
personally with each other. .54
41. 7. Project-relevant information was shared openly by all team
members. .69
8. Important information was kept away from other team
members in certain situations (reverse coded). .59
9. In our team there were conflicts regarding the openness of
information flow (reverse coded). .60
All loadings are significant at p < .001 (one tail).
EFFECT OF PROXIMITY ON TEAM COMMUNICATION
UNDER TIME PRESSURE J PROD INNOV MANAG 215
2012;29(2):205–215
A multilevel model of emotional skills,
communication performance, and task
performance in teams
ASHLEA C. TROTH*, PETER J. JORDAN, SANDRA A.
LAWRENCE AND
HERMAN H. M. TSE
Griffith Business School, Griffith University, Nathan,
Queensland, Australia
Summary There is increasing research regarding the influence
of emotions on teamwork. In this study, we use a
multilevel approach to examine how team members’ use of
emotion-related skills affects team task performance
and communication performance within the team. We measured
individual self-reported emotional skills prior to
team formation and then collected peer-rated individual
communication performance and independently rated
team task performance eight weeks later. Although there was no
influence at the individual level between
44. and test a model to explain the following:
(i) how the emotional skills of individual team members
influence their performance in a team; (ii) how a collective
of individual team members’ emotional skills can be
conceptualized as a team-level emotional skill construct that
has independent direct effects on team performance; and (iii)
how team-level emotional skills have cross-level
influences on individual performance in teams (Figure 1). Our
aim is to enable researchers to better understand the link
between emotional skills and team effectiveness and respond to
calls for multilevel research (e.g., Ashkanasy, 2003;
Cohen & Bailey, 1997; Stewart et al., 2005) that considers the
top-down effects of team factors on individual
functioning in teams (Chen, Kirkman, Kanfer, Allen, & Rosen,
2007; Hitt, Beamish, Jackson, & Mathieu, 2007) and
the impact of emotions in teams (Jordan & Ashkanasy, 2006).
We also examine the impact of emotional skills on both team
task performance and communication performance in
teams. Whereas past research focuses on task aspects of team
performance (Tannenbaum, Beard, & Salas, 1992), we
adopt a relational communications approach (Millar & Rogers,
1976) to argue that emotional skills will affect commu-
nication effectiveness and appropriateness (a process-focused
performance indicator) within teams (Scullen, Mount, &
Judge, 2003). An important element of good communication
involves the management and recognition of one’s own
and others’ emotional expressions (Bales, 1970; Briner, 1999).
Elfenbein et al. (2007) suggest that the benefits of
team-level emotional skills in the workplace arise largely from
coordinating interactions. Communication performance
is central to how teams work together and, we argue, is directly
affected by the emotional skills team members possess.
Emotional Skills
45. Originally conceptualized at the individual level, Mayer and
Salovey (1997) developed the most broadly accepted EI
model that comprises four branches: awareness of emotions,
acquiring emotional knowledge, using emotions in
decision making, and managing emotions. Debate still surrounds
the EI construct in respect to definition and
Emotional Skills
Dimensions Performance
H2
H1
H4
H5
H6
Team level
Individual level Individual
Communication
Performance
within the Team
Own Emotional Awareness
(Own Aware)
Other Emotional Awareness
(Other Aware)
Team Task
Performance
47. Jordan, Ashkanasy, Härtel, and Hooper (2002) and Jordan and
Lawrence (2009) showed that team members need
two broad emotional skills to enhance their capability to deal
with emotions in team contexts: (i) emotional
awareness and (ii) emotional management. These skills further
distinguish between the following: (i) skills related
to dealing with your own emotions and (ii) skills related to
dealing with other peoples’ emotions. Theoretical
(George, 2000; Mayer & Salovey, 1997) and empirical research
(Jordan & Troth, 2004) supports this delineation.
We differentiate between these four skills and their potential to
impact on individual behavior in teams as follows.
Awareness of own emotions
This skill involves being attuned to one’s momentary feelings
and discussing and disclosing the emotions one
experiences (Pennebaker & Francis, 1996). A team member who
recognizes his or her escalating emotions during
a difficult team encounter is taking an important first step
toward managing those emotions. For example, the
emotional escalation of frustration to anger is more difficult to
resolve if the team member does not recognize the
correct precipitate emotion. Silvia (2002) also found that
emotional self-awareness lessens the experience of intense
emotions. Being able to identify the emotion one experiences
makes it easier to decide if it is reasonable and to act
accordingly. Team members higher in emotional self-awareness
are more likely to recognize the appropriate
emotional intensity levels required during team exchanges and
be better positioned to promote team relationships.
Awareness of others’ emotions
Recognizing others’ emotional displays and detecting false
emotional expressions promote successful interactions with
others (Jordan & Lawrence, 2009). An individual needs to
48. accurately identify the emotion a fellow team member is
experiencing to effectively respond to emotions in a team. For
example, team interactions will be different when team
members are enthusiastic as opposed to stressed. An awareness
of others’ emotions is also important for effective
communication interchanges and team conflict resolution
(Druskat & Wolff, 2001). Detecting a team member’s nega-
tive emotion might signal the need for reflective listening to
better understand the source of emotion for that person.
Managing own emotions
This skill requires connecting or disconnecting from an emotion
depending on its usefulness and is linked to
bounded emotionality (Mumby & Putnam, 1992). It often results
in holding back on immediate reactions. In teams,
situations such as conflict over values or goals, short time
frames, or the entry of new team members can evoke
intense emotions that may require self-control if the situations
are to be resolved (Mischel & DeSmet, 2000; Weiss
& Cropanzano, 1996). Skill in managing one’s own emotions
may be the key to better resolve team conflicts
productively and without emotional escalation (Amason, 1996).
Managing others’ emotions
This skill entails the promotion of more positive and productive
emotions in teams (Mayer & Salovey, 1997).
Sometimes, the emotional reactions of other team members need
to be managed to ensure working relationships
are maintained. Managing others’ emotions enables a team
member to regulate the emotional tone of interpersonal
exchanges within the team so they can be productive.
Team Emotional Skills
With few exceptions (e.g., Bell, 2007; Côté, 2007; Elfenbein,
2006; Jordan & Troth, 2004), empirical researchers
50. one hand, team emotional skills are viewed as team norms
influencing team members’ awareness of emotional
information and notions of appropriate emotional response
behaviors (Druskat & Wolff, 2001; Elfenbein, 2006;
Wolff, Druskat, Koman, & Messer, 2006). This norm filters
team members’ perceptions and reactions to
emotion-related issues in the team. Team emotional skills are an
emergent process or team style that contributes
to effective intra-team processes and performance outcomes. On
the other hand, other researchers (e.g., Bell,
2007; Jordan et al., 2002) regard team emotional skills as the
pooled resources individual team members bring to
the team, an input factor that contributes to effective intra-team
processes and performance outcomes and takes a
“sum of parts approach.” Elfenbein (2006) notes each
perspective asks different questions about teams. The norma-
tive framework considers the development of emotions-based
norms within the team over time. The pooled
resources framework provides insights about whether the team
has the emotional resources to be productive and
offers predictions about team performance before a team is
formed.
We do not intend to evaluate the relative merits of each
approach to team emotional skills in this study. The teams
in our sample were required to meet over eight weeks to plan,
develop, and then deliver a persuasive performance
task. Input was required by all team members in a compensatory
manner to achieve the performance task goals
(Steiner, 1972). In other words, team members used a variety of
skills in their team interactions about the
performance task (e.g., emotional, decision-making, oral, and
written communication skills) and compensated for
team members with lower levels of such skills. Day et al. (2004,
p. 1525) note that
51. although for this type of task, the group is frequently permitted
to combine member contributions in any manner
the group sees fit, the typical case is one in which each
individual’s contribution is likely to influence the group’s
final decision.
In this way, we argue that a performance task requiring
compensatory effort contextualizes the role of team skills to
align conceptually with a pooled resources framework.
Therefore, given that our performance task is compensatory
in nature and that team membership is short-term and comprises
members with no relationship history (which limits
the development of team norms; cf. Elfenbein et al., 2007), we
adopt a pooled resources framework to conceptualize
team emotional skills. This is reflected in our study’s research
design assessing emotional skills at one time prior to
team formation.
In conjunction with conceptualizing team emotional skills as a
pooled resource, the composition measurement
approach is important. There are many ways (e.g., minimum,
maximum, diversity, and average) to measure a team’s
collective level of emotional skills. The average of individual
team members’ emotional skills is the most common
(Côté, 2007; Druskat & Wolff, 2001; George, 2002; Yang &
Mossholder, 2004). Steiner (1972) argues that group-
level skills are best assessed using the mean score if team tasks
require compensatory or additive effort (as opposed
to disjunctive or conjunctive effort). Bell’s (2007) meta-
analysis examining the relationship between deep-level
construct variables (e.g., personality factors and EI) and team
performance also concluded that teams carrying out
additive or compensatory tasks are more aligned theoretically
and empirically to team mean assessments. Likewise,
53. time frame to plan, develop, and complete a compensatory
performance task. The task required team members to
adjust their emotions to match the cognitive and interpersonal
demands of the work over this period (Côté, 2007).
We also expect emotional skills to reflect consistent patterns of
behavior at the individual level over this relatively
short period that will collectively combine across team members
to form stable patterns of behavior at the team level
(i.e., team-level emotional skills; Bell, 2007; Stewart et al.,
2005).
Alternative approaches to team composition
We acknowledge the alternative operationalizations of team
emotional skills that adopt a pooled resources
framework (Elfenbein, 2006). As Kozlowski and Klein (2000, p.
58) explain, “collective phenomena may emerge in
different ways under different contextual constraints and
patterns of interaction.” Conceivably, an individual in a team
with the highest (or lowest) level of emotional skills might
enhance (or weaken) the performance of other members in
the team or team performance overall (Elfenbein, 2006). Côté
(2007) considered dispersion (i.e., variance) as a team
representation of emotional skills. He discusses how teams of
individuals with different levels of emotional skills might
be forced to reconcile varying approaches to group tasks. In
essence, individual team members might experience
different emotional states associated with different cognitive
approaches for dealing with task information, and
discussing and reconciling these differences may enhance
performance. We test these alternative compilation typologies
(Kozlowski & Klein, 2000) in our subsequent analyses.
Ultimately, we argue that Kozlowski and Klein’s (2000) pooled
constrained emergence typology is most closely aligned to our
conceptualization of team emotional skills. A minimum
contribution is required by each team member in the emergence
55. performance. Within this theory, it is not a single
communication episode, or the process of communication that is
the focus, but a series of exchanges as a whole that result in a
single product (Parks, 1977). In line with this, we argue
that appropriate and effective communication (communication
performance) is dependent on the emotional skills used
by an individual, and this performance emerges in a succession
of exchanges. Other skills that involve the elements of
detecting, understanding, and regulating emotional displays,
such as encoding and decoding skills (Berger, 2005),
nonverbal communication skills (Burgoon & Bacue, 2003), and
persuading skills (Dillard & Marshall, 2003), have been
found to directly contribute to successful communication
performance. Similar to Berger (2005), we assert that
emotional skills contribute to better communication outcomes
for individuals within teams.
Significant relationships have been found between individual
global emotional skills and performance in
communication-dependent activities such as decision making
(e.g., Lam & Kirby, 2002) and leadership behavior
(e.g., Wong & Law, 2002). We outlined earlier that scholars
(e.g., Jordan & Lawrence, 2009; Mischel & DeSmet,
2000) suggest that distinct emotional skills have particular ways
of influencing the escalation of negative emotion
(Silvia, 2002), productive emotion generation, (Borman &
Motowidlo, 1993) and conflict behavior (Jordan & Troth,
2004). Research examining the performance of individuals
within teams generally suggests that team members more
capable of recognizing and managing their own and others’
emotions during interactions are likely to make better
decisions and resolve task conflict (i.e., communication
performance outcomes) than individuals with lower levels
of emotional skills (e.g., Pelled et al., 1999; Yang &
Mossholder, 2004). Our rationale is that felt or expressed
emotions, particularly negative ones, are less likely to distract
56. or restrict individuals with stronger emotional skills from
the communication performance task at hand. They are more
likely to detect counterproductive emotions within the
team (via awareness skills) and have a greater capacity to
deescalate and deal with these emotions (via management
skills). Emotional skills are also more likely to have an impact
on individual performance within a team when the
objective, or performance goal, involves communicating
interdependently with others (Jordan & Troth, 2004).
Determining if differences exist in the strength of the
relationship between distinct emotional skills and
communication outcomes might have practical implications for
organizations in terms of training programs. There
is some research that considers the possibility of either a null or
negative influence of emotional awareness on
outcome variables (e.g., Elfenbein et al., 2007; Feyerherm &
Rice, 2002; Foo, Elfenbein, Tan, & Aik, 2004). This
is most likely due to the refocusing of individuals high in
emotional awareness on their relationships with others,
instead of the task at hand. We maintain that both emotional
awareness and management skills will positively relate
to communication performance in our sample. However, given
the mixed research findings surrounding emotional
awareness and Jordan and Lawrence’s (2009) argument for the
delineation of emotional skills (awareness versus
management), we investigate these skills separately. The
following hypotheses are proposed:
Hypothesis 1
An individual team member’s emotional awareness (own and
others) skills will be positively related to the individ-
ual member’s communication performance within the team.
Hypothesis 2
An individual team member’s emotional management (own and
58. We propose that a team’s pooled emotional skills will positively
impact on the presentation scores received. The
team’s skills in regulating any negative emotions commonly
associated with public speaking, such as fear and
anxiety (Putnis & Petelin, 1999), will affect the extent a team is
able to deliver a clear argument in a suitable format.
It is also expected that teams with greater skills in recognizing
and regulating others’ emotions will be better able to
“read” their audience and thus manipulate the emotions of
others in a positive direction if required (e.g., audience
engagement, use of humor). A team’s emotional skills will also
impact on presentation scores, via their influence
during team preparation. For instance, team members with
higher level skills are more likely to set a productive
emotional tone that enables a greater exchange of ideas and
clearer, problem-focused thinking. On the basis of this,
and evidence that team emotional skills are positively related to
team task performance (e.g., Bell, 2007; Elfenbein
et al., 2007), we propose the following hypotheses:
Hypothesis 3
Team emotional awareness (own and others) skills will be
positively related to team task performance.
Hypothesis 4
Team emotional management (own and others) skills will be
positively related to team task performance.
Emotional Skills and Performance Cross-Level Relationships
The episodic interaction model of team behaviors (i.e., Marks et
al., 2001) and the relational communications theory
(i.e., Millar & Rogers, 1976), both outlined earlier, lead us to
assert that teams with greater collective skills for
recognizing and managing their emotions over a series of
interactions will promote a communication environment
60. DOI: 10.1002/job
is that individuals within a team pool their emotional skills as
resources to facilitate communication. Individuals with
varying levels of emotional skills (e.g., a member with higher
emotional skill) within a team compensate for and
facilitate the emotional skills of other team members (e.g., a
member with lower emotional skill). This is reflected in
both team and individual behaviors and performances. A team
with a reasonable level of pooled emotional skills might
compensate for an individual team member with lower
emotional skills in terms of active listening and reflection
behaviors. This, in turn, will promote that particular team
member’s effective and appropriate behavior and/or perfor-
mance (despite their initial low emotional skills). We expect all
four team emotional skills to be related to individual
team member’s communication performance. The following
cross-level hypotheses are proposed:
Hypothesis 5
Team emotional awareness (own and others) skills will be
positively related to individual members’ communication
performance within the team.
Hypothesis 6
Team emotional management (own and others) skills will be
positively related to individual members’
communication performance within the team.
Method
Sample and procedure
The sampling frame for this study consisted of 567
61. undergraduate students enrolled in a business communication
course. We asked the respondents to work in teams to develop
and deliver a persuasive presentation on one of five
predetermined topics. We required the respondents to form self-
selected teams with no prior history of working together
(no friendship groups). We also required team members to meet
every week (in class) to work on their presentation for
approximately eight weeks. Some teams also met outside class
of their own volition. At Time 1, 376 respondents
(response rate= 66 per cent) completed the first survey with a
self-report measure of emotional skills during the second
lecture of the course. Eight weeks later at Time 2, 540
respondents (response rate = 95 per cent) in 114 teams
completed
a second survey immediately following the delivery of their
particular team presentation as an in-class reflective tool
(held during course tutorials). Each respondent provided peer
ratings of each of their fellow team members in terms
of their communication performance in the team over the
previous eight weeks. Although the entire sample undertook
this peer-rating exercise as a course reflection about team
performance, the 95 per cent response rate reflects those
respondents who voluntarily returned the survey. Having peers
rate other team members’ communication is a common
practice (e.g., Wayne & Kacmar, 1991); and Scullen et al.
(2003), who suggested that performance is best rated by
others when examining how an individual’s personality or
dispositional constructs influences his or her human skills
performance, advocated it.
An anonymous code, entered by the respondents on the surveys,
allowed both surveys to be matched. The
matched sample consisted of 244 respondents belonging to 57
teams (consisting of three or more team members
who had completed both Time 1 and Time 2 surveys; response
rate = 43 per cent). This sample size is comparable
63. (Jordan et al., 2002), the WEIP-S assesses a team
member’s self-assessment of their emotional awareness and
emotional management skills within a team context
and has an own and other focus. The scale captures four
dimensions (four items each): awareness of own emotions
(e.g., I can explain the emotions I feel to team members),
management of own emotions (e.g., When I am frustrated
with fellow team members, I can overcome my frustration),
awareness of others’ emotions (e.g., I can read fellow
team members “true” feelings, even if they try to hide them),
and management of other’s emotions (e.g., I am able
to cheer team members up when they are feeling down). The
respondents indicated their level of agreement with
each item by using a 7-point format (1 = strongly disagree to 7
= strongly agree). We averaged items for each sub-
scale to provide four emotional skills scores for each
respondent.
Communication performance
We assessed this by using Canary and Spitzberg’s (1987) 13-
item communication performance scale. We asked the
participants to indicate the effectiveness and the
appropriateness of the communication performance of each of
his or
her fellow team members during the life of the presentation
project, using a 5-point response format (1= strongly
disagree to 5 = strongly agree). We modified the scales to
assess the communication performance of specific team
members within a team context. Sample items include He/she
achieved what he/she apparently wanted to achieve in
our conversations for communication effectiveness and He/she
was a smooth conversationalist for appropriateness.
As peer observer ratings are sometimes idiosyncratic, we
conducted within-team inter-rater reliability (rwg) tests
for individual-level communication performance. This
64. established the level of consistency across peer raters for each
individual team member with respect to their ratings for
communication performance (James, Demaree, & Wolf,
1984, 1993). We calculated inter-rater reliabilities using all
available peer ratings (N = 1170) for the 244 ratees in
the 57 teams. The results of rwg for each team member revealed
a mean rwg of .95 for communication performance
(median rwg = .96). As these values were satisfactory, each
team member received an averaged aggregated score
across his or her peers for each of the communication
performance items. We averaged together the aggregated
peer-rated items for each subscale to provide one
communication performance score for each individual
respondent.
See the section on the measurement model analyses for
individual-level construct for more information regarding
construct validity and Cronbach’s alpha reliabilities.
Team-level measures
Team emotional skills
According to Chan (1998), specifying the appropriate
composition model is essential for multilevel research. We
defined team-level emotional skills as a summative composition
model and operationalized it on the basis of the mean
of individual members’ collective emotional skills scores (in
each of the four subscales) within each team (Chen,
Mathieu, & Bliese, 2004). In other words, we aggregated
individuals’ ratings of the four dimensions of emotional skills
within each team to assess their teams’ emotional skills, for the
cross-level and team-level analyses in this study. It is
important to note that Chen et al. (2004) argue that the evidence
of intra-class correlation (ICC 1 and 2) and of inter-rater
708 A. C. TROTH ET AL.
66. SMEs, and the analysis showed that the SMEs had similar
means and score distributions. Furthermore, each SME
was paired with another of the remaining three assessors to
independently rate 20 per cent of each others’ presentations.
Cohen’s kappa coefficients for each of the SME’s ratings were
0.71, 0.73, 0.79, and 0.80, respectively. Cohen’s kappa
coefficient is commonly used to measure the level of agreement
between nominal variables. We gave the category of
“yes” for raters whose final mark corresponded to within one
mark of the second raters’ final mark. We gave the cate-
gory of “no” for a rater who had mark discrepancies greater
than one mark with the second rater. We chose this analysis
over simple percentage agreement because it takes into account
agreement occurring by chance. Our kappa coefficients
indicate a good level of inter-rater agreement according to
Landis and Koch (1977).
Control variables
As demographic variables such as sex, age, and nationality
influence individuals’ attitudes toward other team
members (e.g., Chattopadhyay, George, & Lawrence, 2004), we
used the information collected from the participants
regarding their sex (1 = male, 2 = female), age (actual age), and
national origin (1 = born in Australia, 2 = born
outside Australia) as individual-level control variables. We used
team size as a team-level control variable.
Results
Measurement model analyses for individual-level constructs
Before conducting the hypothesis tests, we established the
construct validity of the individual-level variables in the
context of the obtained sample. Because of sample size
constraints (team level n = 57), we did not perform a separate