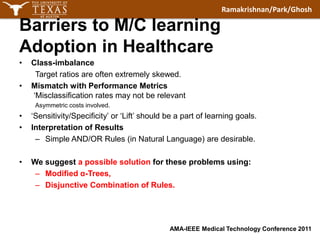
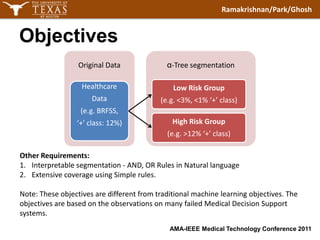
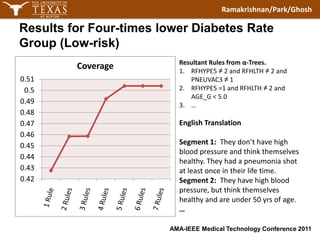
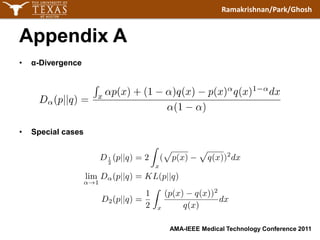
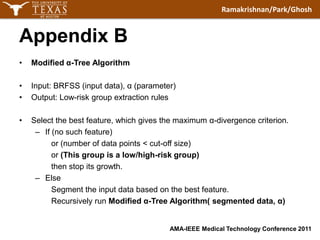
LOW/HIGH-RISK DIABETES GROUP SEGMENTATION USING α-TREESAMA-IEEE Medical Technology Conference 2011Anurekha Ramakrishnan1, Yubin Park2, Joydeep Ghosh21Dept. of Statistics and Scientific Computation2Dept. of Electrical and Computer EngineeringThe University of Texas at Austin
Barriers to M/C learning Adoption in HealthcareClass-imbalance 	Target ratios are often extremely skewed.Mismatch with Performance Metrics ‘Misclassification rates may not be relevantAsymmetric costs involved. ‘Sensitivity/Specificity’ or ‘Lift’ should be a part of learning goals.Interpretation of ResultsSimple AND/OR Rules (in Natural Language) are desirable.We suggest a possible solution for these problems using:Modified α-Trees,Disjunctive Combination of Rules.
ObjectivesOther Requirements:Interpretable segmentation - AND, OR Rules in Natural languageExtensive coverage using Simple rules.Note: These objectives are different from traditional machine learning objectives. The objectives are based on the observations on many failed Medical Decision Support systems.
BRFSS DatasetBehavioral Risk Factor Surveillance SystemURL: http://www.cdc.gov/brfss/The largest telephone survey since 1984.Tracks health conditions and risk behaviors in the United States.Contains information on a variety of diseasese.g. diabetes, hypertension, cancer, asthma, HIV, etc. More than 400,000 records per year.Many states use BRFSS data to support health-related legislative efforts.
α-Tree1A Decision Tree Algorithm (e.g. CART, C4.5)Decision criterion: α-Divergence.Generalizes C4.5.Robust performance in class-imbalance settings.Stop its growth when a Low/High-risk group is obtained. (modified α-Tree)Different ‘α’ values result in different decision rules.Decision trees provide greedy solutions (sub-optimal solutions).By disjunctively combining different solutions from different α-Trees, we can approach to a better solution.Python Code available (http://www.ideal.ece.utexas.edu/~yubin/)1. Y.Park and J.Ghosh, “Compact Ensemble Trees for Imbalanced Data,” in 10th International Wokshop on Multiple Classifier Systems, Italy, June 2011.
3-Phase DiagramExample)When High-risk group is defined as more than 24% Diabetes Rate group.		- Twice Higher rate than Normal Population	Rule1:RFHYPE5 = 1 & AGE_G >= 5.0 & RFHLTH = 2 & BMI4CAT >= 2.0		from α=0.1	ORRule 2: RFHYPE5 ≠ 1 & RFHLTH = 1 & BMI4CAT >= 2.9 & PNEUVAC3 = 1    from α=1.0	ORRule 3: RFHYPE5 = 2 & RFHLTH ≠ 1from α=1.5	OR … These combined rules extract High-risk Diabetes Segments (>24%).
Example Tree StructureWhen α=2.0, total five High-risk Segmentation Rules are extracted.Different α values result in different tree structures.YesNo
Results for Twice Higher Diabetes Rate Group (High-risk)Resultant Rules from α-Trees.RFHYPE5 = 2 & RFHLTH ≠1RFHYPE5 ≠2 & RFHLTH = 2 & RFCHOL = 2…English TranslationSegment 1: They have high-blood pressure and think themselves unhealthy (including not responding to this question).Segment 2: They have high cholesterol and think themselves unhealthy. But they don’t have high-blood pressure.…
Results for Four-times lower Diabetes Rate Group (Low-risk)Resultant Rules from α-Trees.RFHYPE5 ≠2 and RFHLTH ≠2 and PNEUVAC3 ≠1  RFHYPE5 =1 and RFHLTH ≠2 and AGE_G < 5.0…English TranslationSegment 1:  They don’t have high blood pressure and think themselves healthy. They had a pneumonia shot at least once in their life time.Segment 2:  They have high blood pressure, but think themselves healthy and are under 50 yrs of age.…
AppendixAα-DivergenceSpecial cases
AppendixBModified α-Tree AlgorithmInput: BRFSS (input data), α (parameter)Output: Low-risk group extraction rulesSelect the best feature, which gives the maximum α-divergence criterion.If (no such feature) or (number of data points < cut-off size) or (This group is a low/high-risk group) then stop its growth.ElseSegment the input data based on the best feature.Recursively run Modified α-Tree Algorithm( segmented data, α)

Ama ieee-rpg

  • 1.
    LOW/HIGH-RISK DIABETES GROUPSEGMENTATION USING α-TREESAMA-IEEE Medical Technology Conference 2011Anurekha Ramakrishnan1, Yubin Park2, Joydeep Ghosh21Dept. of Statistics and Scientific Computation2Dept. of Electrical and Computer EngineeringThe University of Texas at Austin
  • 2.
    Barriers to M/Clearning Adoption in HealthcareClass-imbalance Target ratios are often extremely skewed.Mismatch with Performance Metrics ‘Misclassification rates may not be relevantAsymmetric costs involved. ‘Sensitivity/Specificity’ or ‘Lift’ should be a part of learning goals.Interpretation of ResultsSimple AND/OR Rules (in Natural Language) are desirable.We suggest a possible solution for these problems using:Modified α-Trees,Disjunctive Combination of Rules.
  • 3.
    ObjectivesOther Requirements:Interpretable segmentation- AND, OR Rules in Natural languageExtensive coverage using Simple rules.Note: These objectives are different from traditional machine learning objectives. The objectives are based on the observations on many failed Medical Decision Support systems.
  • 4.
    BRFSS DatasetBehavioral RiskFactor Surveillance SystemURL: http://www.cdc.gov/brfss/The largest telephone survey since 1984.Tracks health conditions and risk behaviors in the United States.Contains information on a variety of diseasese.g. diabetes, hypertension, cancer, asthma, HIV, etc. More than 400,000 records per year.Many states use BRFSS data to support health-related legislative efforts.
  • 5.
    α-Tree1A Decision TreeAlgorithm (e.g. CART, C4.5)Decision criterion: α-Divergence.Generalizes C4.5.Robust performance in class-imbalance settings.Stop its growth when a Low/High-risk group is obtained. (modified α-Tree)Different ‘α’ values result in different decision rules.Decision trees provide greedy solutions (sub-optimal solutions).By disjunctively combining different solutions from different α-Trees, we can approach to a better solution.Python Code available (http://www.ideal.ece.utexas.edu/~yubin/)1. Y.Park and J.Ghosh, “Compact Ensemble Trees for Imbalanced Data,” in 10th International Wokshop on Multiple Classifier Systems, Italy, June 2011.
  • 6.
    3-Phase DiagramExample)When High-riskgroup is defined as more than 24% Diabetes Rate group. - Twice Higher rate than Normal Population Rule1:RFHYPE5 = 1 & AGE_G >= 5.0 & RFHLTH = 2 & BMI4CAT >= 2.0 from α=0.1 ORRule 2: RFHYPE5 ≠ 1 & RFHLTH = 1 & BMI4CAT >= 2.9 & PNEUVAC3 = 1 from α=1.0 ORRule 3: RFHYPE5 = 2 & RFHLTH ≠ 1from α=1.5 OR … These combined rules extract High-risk Diabetes Segments (>24%).
  • 7.
    Example Tree StructureWhenα=2.0, total five High-risk Segmentation Rules are extracted.Different α values result in different tree structures.YesNo
  • 8.
    Results for TwiceHigher Diabetes Rate Group (High-risk)Resultant Rules from α-Trees.RFHYPE5 = 2 & RFHLTH ≠1RFHYPE5 ≠2 & RFHLTH = 2 & RFCHOL = 2…English TranslationSegment 1: They have high-blood pressure and think themselves unhealthy (including not responding to this question).Segment 2: They have high cholesterol and think themselves unhealthy. But they don’t have high-blood pressure.…
  • 9.
    Results for Four-timeslower Diabetes Rate Group (Low-risk)Resultant Rules from α-Trees.RFHYPE5 ≠2 and RFHLTH ≠2 and PNEUVAC3 ≠1 RFHYPE5 =1 and RFHLTH ≠2 and AGE_G < 5.0…English TranslationSegment 1: They don’t have high blood pressure and think themselves healthy. They had a pneumonia shot at least once in their life time.Segment 2: They have high blood pressure, but think themselves healthy and are under 50 yrs of age.…
  • 10.
  • 11.
    AppendixBModified α-Tree AlgorithmInput:BRFSS (input data), α (parameter)Output: Low-risk group extraction rulesSelect the best feature, which gives the maximum α-divergence criterion.If (no such feature) or (number of data points < cut-off size) or (This group is a low/high-risk group) then stop its growth.ElseSegment the input data based on the best feature.Recursively run Modified α-Tree Algorithm( segmented data, α)