SlideShare a Scribd company logo
1 of 19
1. Why does rent control result in a shortage of rental units.
2. How does price elasticity of demand affect how much of a tax
is passed on to the consumer and how much is absorbed by the
seller. Show the effect with graphs.
3. Why can monopolistic firms make economic profit in the
short run bot not in the long run. Explain and show graphically.
4. Your brother-in-law wants to borrow $1000 from you but he
has a fit when you tell him he will have to pay you the same
interest on the loan that the bank gives you. Are you justified?
Why or Why not?
5. During the 1930s Jewish fighters dominated boxing. From the
around 1975 until the present, blacks have dominated
basketball. Explain the cause(s) underlying these two situations.
PowerPoint Slides prepared by:
Andreea CHIRITESCU
Eastern Illinois University
Demand and Revenue
Management
*
© 2012 Cengage Learning. All Rights Reserved. May not be
copied, scanned, or duplicated, in whole or in part, except for
use as permitted in a license distributed with a certain product
or service or otherwise on a password-protected website for
classroom use.
CHAPTER 12
© 2012 Cengage Learning. All Rights Reserved. May not be
copied, scanned, or duplicated, in whole or in part, except for
use as permitted in a license distributed with a certain product
or service or otherwise on a password-protected website for
classroom use.
Price, Sales, and Consumer ChoiceProfit
Revenue minus costRevenue
Depends on the customer Consumer behavior - making choices
Choices reveal preferences
If people spend money on something and not on something else
Revealing their preferences
*
© 2012 Cengage Learning. All Rights Reserved. May not be
copied, scanned, or duplicated, in whole or in part, except for
use as permitted in a license distributed with a certain product
or service or otherwise on a password-protected website for
classroom use.
© 2012 Cengage Learning. All Rights Reserved. May not be
copied, scanned, or duplicated, in whole or in part, except for
use as permitted in a license distributed with a certain product
or service or otherwise on a password-protected website for
classroom use.
Price, Sales, and Consumer ChoiceLaw of demand
The quantity of a good or service that is purchased
Will decline as the price of that good or service rises
Everything else unchanged
*
© 2012 Cengage Learning. All Rights Reserved. May not be
copied, scanned, or duplicated, in whole or in part, except for
use as permitted in a license distributed with a certain product
or service or otherwise on a password-protected website for
classroom use.
© 2012 Cengage Learning. All Rights Reserved. May not be
copied, scanned, or duplicated, in whole or in part, except for
use as permitted in a license distributed with a certain product
or service or otherwise on a password-protected website for
classroom use.
ElasticityPrice elasticity of demand
Magnitude by which consumers alter the quantity of some
product they purchase
In response to a change in the price of that productThe more
price-elastic demand is
The more responsive consumers are to a price change
*
© 2012 Cengage Learning. All Rights Reserved. May not be
copied, scanned, or duplicated, in whole or in part, except for
use as permitted in a license distributed with a certain product
or service or otherwise on a password-protected website for
classroom use.
© 2012 Cengage Learning. All Rights Reserved. May not be
copied, scanned, or duplicated, in whole or in part, except for
use as permitted in a license distributed with a certain product
or service or otherwise on a password-protected website for
classroom use.
ElasticityPrice elasticity of demand
Percentage change in the quantity demanded of a product
Divided by the percentage change in the price of that producted
= %ΔQ / %ΔP
%ΔQ = percentage change in quantity demanded
%ΔP = percentage change in price
*
© 2012 Cengage Learning. All Rights Reserved. May not be
copied, scanned, or duplicated, in whole or in part, except for
use as permitted in a license distributed with a certain product
or service or otherwise on a password-protected website for
classroom use.
© 2012 Cengage Learning. All Rights Reserved. May not be
copied, scanned, or duplicated, in whole or in part, except for
use as permitted in a license distributed with a certain product
or service or otherwise on a password-protected website for
classroom use.
ElasticityPrice elasticity of demand
If between -1 and - ∞: elastic demand
If = -1: unit elastic demand
If between -1 and 0: inelastic demand Demand curve
Illustrates the quantity of an item that will be purchased at each
price
Relationship between the price and quantity demanded of a
good or service
*
© 2012 Cengage Learning. All Rights Reserved. May not be
copied, scanned, or duplicated, in whole or in part, except for
use as permitted in a license distributed with a certain product
or service or otherwise on a password-protected website for
classroom use.
© 2012 Cengage Learning. All Rights Reserved. May not be
copied, scanned, or duplicated, in whole or in part, except for
use as permitted in a license distributed with a certain product
or service or otherwise on a password-protected website for
classroom use.
ElasticityShape of a demand curve
Depends on the price elasticity of demandPerfectly elastic
demand curve
Horizontal line
Consumers can purchase any quantity they want at the single
prevailing price
Even the smallest price change
Consumers switch to the producer with the lowest price
*
© 2012 Cengage Learning. All Rights Reserved. May not be
copied, scanned, or duplicated, in whole or in part, except for
use as permitted in a license distributed with a certain product
or service or otherwise on a password-protected website for
classroom use.
© 2012 Cengage Learning. All Rights Reserved. May not be
copied, scanned, or duplicated, in whole or in part, except for
use as permitted in a license distributed with a certain product
or service or otherwise on a password-protected website for
classroom use.
ElasticityPerfectly inelastic demand curve
Vertical line
Consumers cannot or will not change the quantity of a good
they purchase when the price of that good is changedDownward
sloping demand curve
The steeper – the less elastic
*
© 2012 Cengage Learning. All Rights Reserved. May not be
copied, scanned, or duplicated, in whole or in part, except for
use as permitted in a license distributed with a certain product
or service or otherwise on a password-protected website for
classroom use.
© 2012 Cengage Learning. All Rights Reserved. May not be
copied, scanned, or duplicated, in whole or in part, except for
use as permitted in a license distributed with a certain product
or service or otherwise on a password-protected website for
classroom use.
Figure 12.1
The demand curve is a graphic relationship between quantity
demanded and price. The graph is drawn with price on the
vertical axis and quantity on the horizontal axis. (a) Perfectly
elastic demand: Demand is so sensitive to price that even an
infinitesimal change leads to a total change in quantity
demanded. (b) Perfectly inelastic demand: The quantity
demanded is the same no matter the price. Demand is
completely insensitive to price. (c) Alternative demand curves:
and D2 represents straight downward-sloping demand curves.
D2 is said to be more elastic than D1 because at every single
price the elasticity of demand is higher at D2 than D1.
Demand Curves
*
© 2012 Cengage Learning. All Rights Reserved. May not be
copied, scanned, or duplicated, in whole or in part, except for
use as permitted in a license distributed with a certain product
or service or otherwise on a password-protected website for
classroom use.
© 2012 Cengage Learning. All Rights Reserved. May not be
copied, scanned, or duplicated, in whole or in part, except for
use as permitted in a license distributed with a certain product
or service or otherwise on a password-protected website for
classroom use.
ElasticityPrice Elasticity and Revenue
Total revenue, TR = P × Q
Dollar value of sales
Price of a product multiplied by the quantity sold As price is
increased, total revenue:
Increases if demand is inelastic
Decreases if demand is elastic
Does not change if demand is unit-elastic
*
© 2012 Cengage Learning. All Rights Reserved. May not be
copied, scanned, or duplicated, in whole or in part, except for
use as permitted in a license distributed with a certain product
or service or otherwise on a password-protected website for
classroom use.
© 2012 Cengage Learning. All Rights Reserved. May not be
copied, scanned, or duplicated, in whole or in part, except for
use as permitted in a license distributed with a certain product
or service or otherwise on a password-protected website for
classroom use.
ElasticityElasticity of demand depends on
How many substitutes and how good of substitutes they are
More substitutes – more elastic demand
Commoditization – price elasticity of demand is very large
Period over which we measure the price elasticity
Longer – more elastic demand
*
© 2012 Cengage Learning. All Rights Reserved. May not be
copied, scanned, or duplicated, in whole or in part, except for
use as permitted in a license distributed with a certain product
or service or otherwise on a password-protected website for
classroom use.
© 2012 Cengage Learning. All Rights Reserved. May not be
copied, scanned, or duplicated, in whole or in part, except for
use as permitted in a license distributed with a certain product
or service or otherwise on a password-protected website for
classroom use.
Figure 12.2
Demand is perfectly elastic for Demand1. The firm cannot
charge more without losing all of its customers because the
product is a commodity—there are many perfect substitutes.
The firm undertakes an advertising campaign to change the
image of the product. If successful, consumers begin to think
the product is not a commodity, that there are not lots of perfect
substitutes. The demand curve then becomes steeper, as with
Demand2.
Changing Price Elasticity
*
© 2012 Cengage Learning. All Rights Reserved. May not be
copied, scanned, or duplicated, in whole or in part, except for
use as permitted in a license distributed with a certain product
or service or otherwise on a password-protected website for
classroom use.
© 2012 Cengage Learning. All Rights Reserved. May not be
copied, scanned, or duplicated, in whole or in part, except for
use as permitted in a license distributed with a certain product
or service or otherwise on a password-protected website for
classroom use.
Business Insight
Price Elasticity of Demand for GasolinePrice elasticity of
demand for gasoline, US
Over a period of one year or less = −0.26
10% hike in the price of gasoline lowers quantity demanded by
2.6%
Long-run = −0.58
10% hike in gasoline causes quantity demanded to decline by
5.8%
*
© 2012 Cengage Learning. All Rights Reserved. May not be
copied, scanned, or duplicated, in whole or in part, except for
use as permitted in a license distributed with a certain product
or service or otherwise on a password-protected website for
classroom use.
© 2012 Cengage Learning. All Rights Reserved. May not be
copied, scanned, or duplicated, in whole or in part, except for
use as permitted in a license distributed with a certain product
or service or otherwise on a password-protected website for
classroom use.
Business Insight
Price Elasticity of Demand for Gasoline10% increase in
real price of fuel
Volume of traffic decline
By 1% within a year
By 3% in longer run (5 years)
Volume of fuel consumed decreases
By 2.5% within a year
By 6% in the longer run
Efficiency of use of fuel increases
By 1.5% within a year
By 4% in the longer run
*
© 2012 Cengage Learning. All Rights Reserved. May not be
copied, scanned, or duplicated, in whole or in part, except for
use as permitted in a license distributed with a certain product
or service or otherwise on a password-protected website for
classroom use.
© 2012 Cengage Learning. All Rights Reserved. May not be
copied, scanned, or duplicated, in whole or in part, except for
use as permitted in a license distributed with a certain product
or service or otherwise on a password-protected website for
classroom use.
Other Demand ElasticitiesOther elasticity measures
Income elasticity of demand
Cross price elasticity of demand
Advertising elasticity
Promotion elasticity
*
© 2012 Cengage Learning. All Rights Reserved. May not be
copied, scanned, or duplicated, in whole or in part, except for
use as permitted in a license distributed with a certain product
or service or otherwise on a password-protected website for
classroom use.
© 2012 Cengage Learning. All Rights Reserved. May not be
copied, scanned, or duplicated, in whole or in part, except for
use as permitted in a license distributed with a certain product
or service or otherwise on a password-protected website for
classroom use.
Figure 12.3
The demand curve is a relation between price and quantity
demanded, everything else held constant. The things held
constant are income, advertising, expectations, tastes,
preference, and anything else that could affect demand. When
one of these changes, the demand curve shifts. For instance,
Demand2 represents demand following an increased income.
The distance the demand curve shifts is reflective of the income
elasticity of demand.
Changes Other than Price
*
© 2012 Cengage Learning. All Rights Reserved. May not be
copied, scanned, or duplicated, in whole or in part, except for
use as permitted in a license distributed with a certain product
or service or otherwise on a password-protected website for
classroom use.
© 2012 Cengage Learning. All Rights Reserved. May not be
copied, scanned, or duplicated, in whole or in part, except for
use as permitted in a license distributed with a certain product
or service or otherwise on a password-protected website for
classroom use.
Other Demand ElasticitiesU.S. economy
Has grown over the years
The growth has not been at a steady paceBusiness cycles
Upswing in business activity
Incomes are growing
Sales of many products are rising
Downswing
Incomes are not rising
Sales may be declining
*
© 2012 Cengage Learning. All Rights Reserved. May not be
copied, scanned, or duplicated, in whole or in part, except for
use as permitted in a license distributed with a certain product
or service or otherwise on a password-protected website for
classroom use.
© 2012 Cengage Learning. All Rights Reserved. May not be
copied, scanned, or duplicated, in whole or in part, except for
use as permitted in a license distributed with a certain product
or service or otherwise on a password-protected website for
classroom use.
Figure 12.4
The real output or GDP of the U.S. economy each year is
pictured. The picture points out two things: The total output has
grown over the years, and the growth has not been a steady rise.
Economic Growth and the Business Cycle
*
© 2012 Cengage Learning. All Rights Reserved. May not be
copied, scanned, or duplicated, in whole or in part, except for
use as permitted in a license distributed with a certain product
or service or otherwise on a password-protected website for
classroom use.
© 2012 Cengage Learning. All Rights Reserved. May not be
copied, scanned, or duplicated, in whole or in part, except for
use as permitted in a license distributed with a certain product
or service or otherwise on a password-protected website for
classroom use.
Figure 12.5
Taking out the growth part of Figure 12.4 leaves just the cycles.
Business Cycle
*
© 2012 Cengage Learning. All Rights Reserved. May not be
copied, scanned, or duplicated, in whole or in part, except for
use as permitted in a license distributed with a certain product
or service or otherwise on a password-protected website for
classroom use.
© 2012 Cengage Learning. All Rights Reserved. May not be
copied, scanned, or duplicated, in whole or in part, except for
use as permitted in a license distributed with a certain product
or service or otherwise on a password-protected website for
classroom use.
Other Demand ElasticitiesIncome Elasticity of Demand
Responsiveness of consumer purchases to income changes
Percentage change in demand
Divided by the percentage change in income
Everything else held constant
*
© 2012 Cengage Learning. All Rights Reserved. May not be
copied, scanned, or duplicated, in whole or in part, except for
use as permitted in a license distributed with a certain product
or service or otherwise on a password-protected website for
classroom use.
© 2012 Cengage Learning. All Rights Reserved. May not be
copied, scanned, or duplicated, in whole or in part, except for
use as permitted in a license distributed with a certain product
or service or otherwise on a password-protected website for
classroom use.
Other Demand ElasticitiesLuxury good
Very high income elasticity (>1.0)
1% increase in income will lead to a greater than 1% rise in
demand
As long as the economy is growing
And incomes are rising
Sales are rising
*
© 2012 Cengage Learning. All Rights Reserved. May not be
copied, scanned, or duplicated, in whole or in part, except for
use as permitted in a license distributed with a certain product
or service or otherwise on a password-protected website for
classroom use.
© 2012 Cengage Learning. All Rights Reserved. May not be
copied, scanned, or duplicated, in whole or in part, except for
use as permitted in a license distributed with a certain product
or service or otherwise on a password-protected website for
classroom use.
Other Demand ElasticitiesNormal good
Positive but <1 income elasticity
As income rises, demand rises
Cyclical goodsInferior good
Negative income elasticity
As income rises, demand falls
Countercyclical goods
*
© 2012 Cengage Learning. All Rights Reserved. May not be
copied, scanned, or duplicated, in whole or in part, except for
use as permitted in a license distributed with a certain product
or service or otherwise on a password-protected website for
classroom use.
© 2012 Cengage Learning. All Rights Reserved. May not be
copied, scanned, or duplicated, in whole or in part, except for
use as permitted in a license distributed with a certain product
or service or otherwise on a password-protected website for
classroom use.
Other Demand ElasticitiesComplements
Items used together Substitutes
Items used in place of each otherCross elasticity of demand
Measures whether goods and services are complements or
substitutes
*
© 2012 Cengage Learning. All Rights Reserved. May not be
copied, scanned, or duplicated, in whole or in part, except for
use as permitted in a license distributed with a certain product
or service or otherwise on a password-protected website for
classroom use.
© 2012 Cengage Learning. All Rights Reserved. May not be
copied, scanned, or duplicated, in whole or in part, except for
use as permitted in a license distributed with a certain product
or service or otherwise on a password-protected website for
classroom use.
Other Demand ElasticitiesCross elasticity of demand
Percentage change in demand of one good
Divided by the percentage change in the price of a related good
Close substitutes: high positive cross elasticities
Complements: negative cross-price elasticities
Unrelated goods: zero cross-price elasticity
*
© 2012 Cengage Learning. All Rights Reserved. May not be
copied, scanned, or duplicated, in whole or in part, except for
use as permitted in a license distributed with a certain product
or service or otherwise on a password-protected website for
classroom use.
© 2012 Cengage Learning. All Rights Reserved. May not be
copied, scanned, or duplicated, in whole or in part, except for
use as permitted in a license distributed with a certain product
or service or otherwise on a password-protected website for
classroom use.
Elasticity EstimatesComputer technology
Much better information about customers and the elasticities of
demand
Enabling many “low-margin” industries to improve their
margins
By knowing their customers better
Firms are increasing profits because they better understand the
customer
*
© 2012 Cengage Learning. All Rights Reserved. May not be
copied, scanned, or duplicated, in whole or in part, except for
use as permitted in a license distributed with a certain product
or service or otherwise on a password-protected website for
classroom use.
© 2012 Cengage Learning. All Rights Reserved. May not be
copied, scanned, or duplicated, in whole or in part, except for
use as permitted in a license distributed with a certain product
or service or otherwise on a password-protected website for
classroom use.
Elasticity EstimatesElasticity models
Daily evaluation of pricing factors
Site by site
That are stored on a running database
Historical price, volume, and competitive data
Continual fine-tuning accomplished through daily data updates
*
© 2012 Cengage Learning. All Rights Reserved. May not be
copied, scanned, or duplicated, in whole or in part, except for
use as permitted in a license distributed with a certain product
or service or otherwise on a password-protected website for
classroom use.
© 2012 Cengage Learning. All Rights Reserved. May not be
copied, scanned, or duplicated, in whole or in part, except for
use as permitted in a license distributed with a certain product
or service or otherwise on a password-protected website for
classroom use.
Elasticity EstimatesGasoline - typical elasticity estimates
For a single retailer
According to the pricing company MPSI Systems Inc.
6 for regular
4.5 for mid-grade
3 for premium
*
© 2012 Cengage Learning. All Rights Reserved. May not be
copied, scanned, or duplicated, in whole or in part, except for
use as permitted in a license distributed with a certain product
or service or otherwise on a password-protected website for
classroom use.
© 2012 Cengage Learning. All Rights Reserved. May not be
copied, scanned, or duplicated, in whole or in part, except for
use as permitted in a license distributed with a certain product
or service or otherwise on a password-protected website for
classroom use.
Melissa Buehrlen
Business Economics
Instructor Somers
06/03/2013
Business Economics: Chp. 12
Directions: Answer all seven (7) questions; underneath all the
questions already listed. Use this document to answer the
following questions. Do not type a separate word document to
answer the following questions. Answer using complete
sentences and explain.
1.) For each of the following pairs of goods or services, identify
the one for which the price elasticity of demand is greater and
explain why.
· Coffee/Starbucks coffee.
· Tuition at a public university/tuition at a private university.
· Emergency room medical services/annual physical exam.
· Movies in the afternoon/movies at night.
· Prescription medicine/over the counter medicine.
2.) Although water is essential to life no matter where one lives,
the demand for water differs across regions. In one study, it
was found that the price elasticity of demand for water in all
regions of the United States ranged from 0.39 to 0.69.
a.) Why is the demand for water price-inelastic?
b.) In those regions where outdoor use of water makes up
relatively large portion of total use, the price elasticity is high.
Why?
c.) The demand for water in the summer months is greater than
in the winter months. Explain why.
3.) The income elasticity of demand for automobiles in the
United States was estimated by a government agency to be
between 2.5 and 3.9.
a.) What does this mean?
b.) If incomes rise by 10 percent, what happens to the purchase
of automobiles?
4.) Explain why the demand curve is a horizontal line in the
situation called perfect competition.
5.) The demand curve slopes downward. Explain.
6.) What would happen to the demand curve in each of the
following cases:
a.) Income rises.
b.) The number of customer rises.
c.) The number of substitutes increases.
d.) People expect that the price of the good will decline in the
near future.
e.) People expect that the price of the good will rise in the near
future.
7.) Using elasticity, explain what “market power” means.

More Related Content

Similar to 1. Why does rent control result in a shortage of rental units..docx

8. Relationships among Inflation, Interest Rates and Exchange Rates.pptx
8. Relationships among Inflation, Interest Rates and Exchange Rates.pptx8. Relationships among Inflation, Interest Rates and Exchange Rates.pptx
8. Relationships among Inflation, Interest Rates and Exchange Rates.pptxchallbhag
 
Essen ch04-presentation6e(2012)
Essen ch04-presentation6e(2012)Essen ch04-presentation6e(2012)
Essen ch04-presentation6e(2012)DAI NGUYEN
 
Pricing and costing Midterm Lesson 3 for
Pricing and costing Midterm Lesson 3  forPricing and costing Midterm Lesson 3  for
Pricing and costing Midterm Lesson 3 forcathyrabadon01
 
Chapter 10 imperfect comp
Chapter 10 imperfect compChapter 10 imperfect comp
Chapter 10 imperfect compUconn Stamford
 
Pricing and Costing Midterm Lesson 2....
Pricing and Costing Midterm Lesson 2....Pricing and Costing Midterm Lesson 2....
Pricing and Costing Midterm Lesson 2....cathyrabadon01
 
Premium Ch 5 Elasticity and Its Application.pptx
Premium Ch 5 Elasticity and Its Application.pptxPremium Ch 5 Elasticity and Its Application.pptx
Premium Ch 5 Elasticity and Its Application.pptxcadeyare1201
 
princ-ch01-presentation6e(2012).pptx
princ-ch01-presentation6e(2012).pptxprinc-ch01-presentation6e(2012).pptx
princ-ch01-presentation6e(2012).pptx/ /
 
Chapter 25 aggregate demand and the powerful consumer
Chapter 25 aggregate demand and the powerful consumerChapter 25 aggregate demand and the powerful consumer
Chapter 25 aggregate demand and the powerful consumerThegohst Alithy
 
Chapter 2: Basic Managerial Accounting Concepts.pptx
Chapter 2: Basic Managerial Accounting Concepts.pptxChapter 2: Basic Managerial Accounting Concepts.pptx
Chapter 2: Basic Managerial Accounting Concepts.pptxCacaSmart
 
Financial Options and Applications in Corporate FinanceCHAPTER
Financial Options and Applications in Corporate FinanceCHAPTERFinancial Options and Applications in Corporate FinanceCHAPTER
Financial Options and Applications in Corporate FinanceCHAPTERChereCheek752
 
Financial Options and Applications in Corporate FinanceCHAPTER.docx
Financial Options and Applications in Corporate FinanceCHAPTER.docxFinancial Options and Applications in Corporate FinanceCHAPTER.docx
Financial Options and Applications in Corporate FinanceCHAPTER.docxlmelaine
 

Similar to 1. Why does rent control result in a shortage of rental units..docx (20)

8. Relationships among Inflation, Interest Rates and Exchange Rates.pptx
8. Relationships among Inflation, Interest Rates and Exchange Rates.pptx8. Relationships among Inflation, Interest Rates and Exchange Rates.pptx
8. Relationships among Inflation, Interest Rates and Exchange Rates.pptx
 
Essen ch04-presentation6e(2012)
Essen ch04-presentation6e(2012)Essen ch04-presentation6e(2012)
Essen ch04-presentation6e(2012)
 
Pricing and costing Midterm Lesson 3 for
Pricing and costing Midterm Lesson 3  forPricing and costing Midterm Lesson 3  for
Pricing and costing Midterm Lesson 3 for
 
Chapter 10 imperfect comp
Chapter 10 imperfect compChapter 10 imperfect comp
Chapter 10 imperfect comp
 
Chapter 13 pp notes
Chapter 13 pp notesChapter 13 pp notes
Chapter 13 pp notes
 
Pricing and Costing Midterm Lesson 2....
Pricing and Costing Midterm Lesson 2....Pricing and Costing Midterm Lesson 2....
Pricing and Costing Midterm Lesson 2....
 
ACCT230_Ch11.ppt
ACCT230_Ch11.pptACCT230_Ch11.ppt
ACCT230_Ch11.ppt
 
Premium Ch 5 Elasticity and Its Application.pptx
Premium Ch 5 Elasticity and Its Application.pptxPremium Ch 5 Elasticity and Its Application.pptx
Premium Ch 5 Elasticity and Its Application.pptx
 
princ-ch01-presentation6e(2012).pptx
princ-ch01-presentation6e(2012).pptxprinc-ch01-presentation6e(2012).pptx
princ-ch01-presentation6e(2012).pptx
 
Ch4
Ch4Ch4
Ch4
 
Ch13
Ch13Ch13
Ch13
 
Chapter 25 aggregate demand and the powerful consumer
Chapter 25 aggregate demand and the powerful consumerChapter 25 aggregate demand and the powerful consumer
Chapter 25 aggregate demand and the powerful consumer
 
Fmi10e abr ch08
Fmi10e abr ch08Fmi10e abr ch08
Fmi10e abr ch08
 
Ch12
Ch12Ch12
Ch12
 
Ch10
Ch10Ch10
Ch10
 
Ch12
Ch12Ch12
Ch12
 
Chapter 2: Basic Managerial Accounting Concepts.pptx
Chapter 2: Basic Managerial Accounting Concepts.pptxChapter 2: Basic Managerial Accounting Concepts.pptx
Chapter 2: Basic Managerial Accounting Concepts.pptx
 
Ch11
Ch11Ch11
Ch11
 
Financial Options and Applications in Corporate FinanceCHAPTER
Financial Options and Applications in Corporate FinanceCHAPTERFinancial Options and Applications in Corporate FinanceCHAPTER
Financial Options and Applications in Corporate FinanceCHAPTER
 
Financial Options and Applications in Corporate FinanceCHAPTER.docx
Financial Options and Applications in Corporate FinanceCHAPTER.docxFinancial Options and Applications in Corporate FinanceCHAPTER.docx
Financial Options and Applications in Corporate FinanceCHAPTER.docx
 

More from jackiewalcutt

briefly summarize how the Electoral College works. Explain some of t.docx
briefly summarize how the Electoral College works. Explain some of t.docxbriefly summarize how the Electoral College works. Explain some of t.docx
briefly summarize how the Electoral College works. Explain some of t.docxjackiewalcutt
 
Briefly summarize and analyze two primary sources, identifying their.docx
Briefly summarize and analyze two primary sources, identifying their.docxBriefly summarize and analyze two primary sources, identifying their.docx
Briefly summarize and analyze two primary sources, identifying their.docxjackiewalcutt
 
Briefly respond to the following questions. Use facts and examples t.docx
Briefly respond to the following questions. Use facts and examples t.docxBriefly respond to the following questions. Use facts and examples t.docx
Briefly respond to the following questions. Use facts and examples t.docxjackiewalcutt
 
Briefly in your own words describe the distinction between explicit .docx
Briefly in your own words describe the distinction between explicit .docxBriefly in your own words describe the distinction between explicit .docx
Briefly in your own words describe the distinction between explicit .docxjackiewalcutt
 
Briefly explain   Victoria Australia Covid19 update and impact.docx
Briefly explain   Victoria Australia Covid19 update and impact.docxBriefly explain   Victoria Australia Covid19 update and impact.docx
Briefly explain   Victoria Australia Covid19 update and impact.docxjackiewalcutt
 
Briefly introduce the détente policies of the early 1970s, and des.docx
Briefly introduce the détente policies of the early 1970s, and des.docxBriefly introduce the détente policies of the early 1970s, and des.docx
Briefly introduce the détente policies of the early 1970s, and des.docxjackiewalcutt
 
Briefly explain the role of information systems in an organization.docx
Briefly explain the role of information systems in an organization.docxBriefly explain the role of information systems in an organization.docx
Briefly explain the role of information systems in an organization.docxjackiewalcutt
 
briefly describe, in 2-3 pages, the problemissue and the proble.docx
briefly describe, in 2-3 pages, the problemissue and the proble.docxbriefly describe, in 2-3 pages, the problemissue and the proble.docx
briefly describe, in 2-3 pages, the problemissue and the proble.docxjackiewalcutt
 
Briefly explain the mission of the OSH Act. What is the rationale be.docx
Briefly explain the mission of the OSH Act. What is the rationale be.docxBriefly explain the mission of the OSH Act. What is the rationale be.docx
Briefly explain the mission of the OSH Act. What is the rationale be.docxjackiewalcutt
 
Briefly discuss the various organizational approaches to managing .docx
Briefly discuss the various organizational approaches to managing .docxBriefly discuss the various organizational approaches to managing .docx
Briefly discuss the various organizational approaches to managing .docxjackiewalcutt
 
Briefly explain the identified security issues during Risk Assessmen.docx
Briefly explain the identified security issues during Risk Assessmen.docxBriefly explain the identified security issues during Risk Assessmen.docx
Briefly explain the identified security issues during Risk Assessmen.docxjackiewalcutt
 
Briefly discuss some KSAs for Fighting Cybercrime and submit in a wo.docx
Briefly discuss some KSAs for Fighting Cybercrime and submit in a wo.docxBriefly discuss some KSAs for Fighting Cybercrime and submit in a wo.docx
Briefly discuss some KSAs for Fighting Cybercrime and submit in a wo.docxjackiewalcutt
 
Briefly describe what a monopoly is and give an example using the ch.docx
Briefly describe what a monopoly is and give an example using the ch.docxBriefly describe what a monopoly is and give an example using the ch.docx
Briefly describe what a monopoly is and give an example using the ch.docxjackiewalcutt
 
Briefly describe the spread of industry throughout Europe and into.docx
Briefly describe the spread of industry throughout Europe and into.docxBriefly describe the spread of industry throughout Europe and into.docx
Briefly describe the spread of industry throughout Europe and into.docxjackiewalcutt
 
Briefly describe the path of food through the digestive system and e.docx
Briefly describe the path of food through the digestive system and e.docxBriefly describe the path of food through the digestive system and e.docx
Briefly describe the path of food through the digestive system and e.docxjackiewalcutt
 
Briefly describe the different parenting styles discussed in this we.docx
Briefly describe the different parenting styles discussed in this we.docxBriefly describe the different parenting styles discussed in this we.docx
Briefly describe the different parenting styles discussed in this we.docxjackiewalcutt
 
Briefly describe how the BIOS boots or starts the computer and.docx
Briefly describe how the BIOS boots or starts the computer and.docxBriefly describe how the BIOS boots or starts the computer and.docx
Briefly describe how the BIOS boots or starts the computer and.docxjackiewalcutt
 
Briefly describe how to deploy a Continuous Improvement effort.W.docx
Briefly describe how to deploy a Continuous Improvement effort.W.docxBriefly describe how to deploy a Continuous Improvement effort.W.docx
Briefly describe how to deploy a Continuous Improvement effort.W.docxjackiewalcutt
 
briefly define democracy and evaluate in detail THREE of.docx
briefly define democracy and evaluate in detail THREE of.docxbriefly define democracy and evaluate in detail THREE of.docx
briefly define democracy and evaluate in detail THREE of.docxjackiewalcutt
 
Briefly define, listcontrast, identify the significance of, or .docx
Briefly define, listcontrast, identify the significance of, or .docxBriefly define, listcontrast, identify the significance of, or .docx
Briefly define, listcontrast, identify the significance of, or .docxjackiewalcutt
 

More from jackiewalcutt (20)

briefly summarize how the Electoral College works. Explain some of t.docx
briefly summarize how the Electoral College works. Explain some of t.docxbriefly summarize how the Electoral College works. Explain some of t.docx
briefly summarize how the Electoral College works. Explain some of t.docx
 
Briefly summarize and analyze two primary sources, identifying their.docx
Briefly summarize and analyze two primary sources, identifying their.docxBriefly summarize and analyze two primary sources, identifying their.docx
Briefly summarize and analyze two primary sources, identifying their.docx
 
Briefly respond to the following questions. Use facts and examples t.docx
Briefly respond to the following questions. Use facts and examples t.docxBriefly respond to the following questions. Use facts and examples t.docx
Briefly respond to the following questions. Use facts and examples t.docx
 
Briefly in your own words describe the distinction between explicit .docx
Briefly in your own words describe the distinction between explicit .docxBriefly in your own words describe the distinction between explicit .docx
Briefly in your own words describe the distinction between explicit .docx
 
Briefly explain   Victoria Australia Covid19 update and impact.docx
Briefly explain   Victoria Australia Covid19 update and impact.docxBriefly explain   Victoria Australia Covid19 update and impact.docx
Briefly explain   Victoria Australia Covid19 update and impact.docx
 
Briefly introduce the détente policies of the early 1970s, and des.docx
Briefly introduce the détente policies of the early 1970s, and des.docxBriefly introduce the détente policies of the early 1970s, and des.docx
Briefly introduce the détente policies of the early 1970s, and des.docx
 
Briefly explain the role of information systems in an organization.docx
Briefly explain the role of information systems in an organization.docxBriefly explain the role of information systems in an organization.docx
Briefly explain the role of information systems in an organization.docx
 
briefly describe, in 2-3 pages, the problemissue and the proble.docx
briefly describe, in 2-3 pages, the problemissue and the proble.docxbriefly describe, in 2-3 pages, the problemissue and the proble.docx
briefly describe, in 2-3 pages, the problemissue and the proble.docx
 
Briefly explain the mission of the OSH Act. What is the rationale be.docx
Briefly explain the mission of the OSH Act. What is the rationale be.docxBriefly explain the mission of the OSH Act. What is the rationale be.docx
Briefly explain the mission of the OSH Act. What is the rationale be.docx
 
Briefly discuss the various organizational approaches to managing .docx
Briefly discuss the various organizational approaches to managing .docxBriefly discuss the various organizational approaches to managing .docx
Briefly discuss the various organizational approaches to managing .docx
 
Briefly explain the identified security issues during Risk Assessmen.docx
Briefly explain the identified security issues during Risk Assessmen.docxBriefly explain the identified security issues during Risk Assessmen.docx
Briefly explain the identified security issues during Risk Assessmen.docx
 
Briefly discuss some KSAs for Fighting Cybercrime and submit in a wo.docx
Briefly discuss some KSAs for Fighting Cybercrime and submit in a wo.docxBriefly discuss some KSAs for Fighting Cybercrime and submit in a wo.docx
Briefly discuss some KSAs for Fighting Cybercrime and submit in a wo.docx
 
Briefly describe what a monopoly is and give an example using the ch.docx
Briefly describe what a monopoly is and give an example using the ch.docxBriefly describe what a monopoly is and give an example using the ch.docx
Briefly describe what a monopoly is and give an example using the ch.docx
 
Briefly describe the spread of industry throughout Europe and into.docx
Briefly describe the spread of industry throughout Europe and into.docxBriefly describe the spread of industry throughout Europe and into.docx
Briefly describe the spread of industry throughout Europe and into.docx
 
Briefly describe the path of food through the digestive system and e.docx
Briefly describe the path of food through the digestive system and e.docxBriefly describe the path of food through the digestive system and e.docx
Briefly describe the path of food through the digestive system and e.docx
 
Briefly describe the different parenting styles discussed in this we.docx
Briefly describe the different parenting styles discussed in this we.docxBriefly describe the different parenting styles discussed in this we.docx
Briefly describe the different parenting styles discussed in this we.docx
 
Briefly describe how the BIOS boots or starts the computer and.docx
Briefly describe how the BIOS boots or starts the computer and.docxBriefly describe how the BIOS boots or starts the computer and.docx
Briefly describe how the BIOS boots or starts the computer and.docx
 
Briefly describe how to deploy a Continuous Improvement effort.W.docx
Briefly describe how to deploy a Continuous Improvement effort.W.docxBriefly describe how to deploy a Continuous Improvement effort.W.docx
Briefly describe how to deploy a Continuous Improvement effort.W.docx
 
briefly define democracy and evaluate in detail THREE of.docx
briefly define democracy and evaluate in detail THREE of.docxbriefly define democracy and evaluate in detail THREE of.docx
briefly define democracy and evaluate in detail THREE of.docx
 
Briefly define, listcontrast, identify the significance of, or .docx
Briefly define, listcontrast, identify the significance of, or .docxBriefly define, listcontrast, identify the significance of, or .docx
Briefly define, listcontrast, identify the significance of, or .docx
 

Recently uploaded

Activity 01 - Artificial Culture (1).pdf
Activity 01 - Artificial Culture (1).pdfActivity 01 - Artificial Culture (1).pdf
Activity 01 - Artificial Culture (1).pdfciinovamais
 
Interactive Powerpoint_How to Master effective communication
Interactive Powerpoint_How to Master effective communicationInteractive Powerpoint_How to Master effective communication
Interactive Powerpoint_How to Master effective communicationnomboosow
 
Holdier Curriculum Vitae (April 2024).pdf
Holdier Curriculum Vitae (April 2024).pdfHoldier Curriculum Vitae (April 2024).pdf
Holdier Curriculum Vitae (April 2024).pdfagholdier
 
Sanyam Choudhary Chemistry practical.pdf
Sanyam Choudhary Chemistry practical.pdfSanyam Choudhary Chemistry practical.pdf
Sanyam Choudhary Chemistry practical.pdfsanyamsingh5019
 
General AI for Medical Educators April 2024
General AI for Medical Educators April 2024General AI for Medical Educators April 2024
General AI for Medical Educators April 2024Janet Corral
 
Unit-IV- Pharma. Marketing Channels.pptx
Unit-IV- Pharma. Marketing Channels.pptxUnit-IV- Pharma. Marketing Channels.pptx
Unit-IV- Pharma. Marketing Channels.pptxVishalSingh1417
 
Z Score,T Score, Percential Rank and Box Plot Graph
Z Score,T Score, Percential Rank and Box Plot GraphZ Score,T Score, Percential Rank and Box Plot Graph
Z Score,T Score, Percential Rank and Box Plot GraphThiyagu K
 
BASLIQ CURRENT LOOKBOOK LOOKBOOK(1) (1).pdf
BASLIQ CURRENT LOOKBOOK  LOOKBOOK(1) (1).pdfBASLIQ CURRENT LOOKBOOK  LOOKBOOK(1) (1).pdf
BASLIQ CURRENT LOOKBOOK LOOKBOOK(1) (1).pdfSoniaTolstoy
 
Advanced Views - Calendar View in Odoo 17
Advanced Views - Calendar View in Odoo 17Advanced Views - Calendar View in Odoo 17
Advanced Views - Calendar View in Odoo 17Celine George
 
Student login on Anyboli platform.helpin
Student login on Anyboli platform.helpinStudent login on Anyboli platform.helpin
Student login on Anyboli platform.helpinRaunakKeshri1
 
Grant Readiness 101 TechSoup and Remy Consulting
Grant Readiness 101 TechSoup and Remy ConsultingGrant Readiness 101 TechSoup and Remy Consulting
Grant Readiness 101 TechSoup and Remy ConsultingTechSoup
 
social pharmacy d-pharm 1st year by Pragati K. Mahajan
social pharmacy d-pharm 1st year by Pragati K. Mahajansocial pharmacy d-pharm 1st year by Pragati K. Mahajan
social pharmacy d-pharm 1st year by Pragati K. Mahajanpragatimahajan3
 
Measures of Dispersion and Variability: Range, QD, AD and SD
Measures of Dispersion and Variability: Range, QD, AD and SDMeasures of Dispersion and Variability: Range, QD, AD and SD
Measures of Dispersion and Variability: Range, QD, AD and SDThiyagu K
 
A Critique of the Proposed National Education Policy Reform
A Critique of the Proposed National Education Policy ReformA Critique of the Proposed National Education Policy Reform
A Critique of the Proposed National Education Policy ReformChameera Dedduwage
 
Ecosystem Interactions Class Discussion Presentation in Blue Green Lined Styl...
Ecosystem Interactions Class Discussion Presentation in Blue Green Lined Styl...Ecosystem Interactions Class Discussion Presentation in Blue Green Lined Styl...
Ecosystem Interactions Class Discussion Presentation in Blue Green Lined Styl...fonyou31
 
APM Welcome, APM North West Network Conference, Synergies Across Sectors
APM Welcome, APM North West Network Conference, Synergies Across SectorsAPM Welcome, APM North West Network Conference, Synergies Across Sectors
APM Welcome, APM North West Network Conference, Synergies Across SectorsAssociation for Project Management
 
Call Girls in Dwarka Mor Delhi Contact Us 9654467111
Call Girls in Dwarka Mor Delhi Contact Us 9654467111Call Girls in Dwarka Mor Delhi Contact Us 9654467111
Call Girls in Dwarka Mor Delhi Contact Us 9654467111Sapana Sha
 

Recently uploaded (20)

Código Creativo y Arte de Software | Unidad 1
Código Creativo y Arte de Software | Unidad 1Código Creativo y Arte de Software | Unidad 1
Código Creativo y Arte de Software | Unidad 1
 
Activity 01 - Artificial Culture (1).pdf
Activity 01 - Artificial Culture (1).pdfActivity 01 - Artificial Culture (1).pdf
Activity 01 - Artificial Culture (1).pdf
 
Interactive Powerpoint_How to Master effective communication
Interactive Powerpoint_How to Master effective communicationInteractive Powerpoint_How to Master effective communication
Interactive Powerpoint_How to Master effective communication
 
Holdier Curriculum Vitae (April 2024).pdf
Holdier Curriculum Vitae (April 2024).pdfHoldier Curriculum Vitae (April 2024).pdf
Holdier Curriculum Vitae (April 2024).pdf
 
Sanyam Choudhary Chemistry practical.pdf
Sanyam Choudhary Chemistry practical.pdfSanyam Choudhary Chemistry practical.pdf
Sanyam Choudhary Chemistry practical.pdf
 
General AI for Medical Educators April 2024
General AI for Medical Educators April 2024General AI for Medical Educators April 2024
General AI for Medical Educators April 2024
 
Unit-IV- Pharma. Marketing Channels.pptx
Unit-IV- Pharma. Marketing Channels.pptxUnit-IV- Pharma. Marketing Channels.pptx
Unit-IV- Pharma. Marketing Channels.pptx
 
Z Score,T Score, Percential Rank and Box Plot Graph
Z Score,T Score, Percential Rank and Box Plot GraphZ Score,T Score, Percential Rank and Box Plot Graph
Z Score,T Score, Percential Rank and Box Plot Graph
 
BASLIQ CURRENT LOOKBOOK LOOKBOOK(1) (1).pdf
BASLIQ CURRENT LOOKBOOK  LOOKBOOK(1) (1).pdfBASLIQ CURRENT LOOKBOOK  LOOKBOOK(1) (1).pdf
BASLIQ CURRENT LOOKBOOK LOOKBOOK(1) (1).pdf
 
Advanced Views - Calendar View in Odoo 17
Advanced Views - Calendar View in Odoo 17Advanced Views - Calendar View in Odoo 17
Advanced Views - Calendar View in Odoo 17
 
Student login on Anyboli platform.helpin
Student login on Anyboli platform.helpinStudent login on Anyboli platform.helpin
Student login on Anyboli platform.helpin
 
Grant Readiness 101 TechSoup and Remy Consulting
Grant Readiness 101 TechSoup and Remy ConsultingGrant Readiness 101 TechSoup and Remy Consulting
Grant Readiness 101 TechSoup and Remy Consulting
 
social pharmacy d-pharm 1st year by Pragati K. Mahajan
social pharmacy d-pharm 1st year by Pragati K. Mahajansocial pharmacy d-pharm 1st year by Pragati K. Mahajan
social pharmacy d-pharm 1st year by Pragati K. Mahajan
 
Measures of Dispersion and Variability: Range, QD, AD and SD
Measures of Dispersion and Variability: Range, QD, AD and SDMeasures of Dispersion and Variability: Range, QD, AD and SD
Measures of Dispersion and Variability: Range, QD, AD and SD
 
A Critique of the Proposed National Education Policy Reform
A Critique of the Proposed National Education Policy ReformA Critique of the Proposed National Education Policy Reform
A Critique of the Proposed National Education Policy Reform
 
Advance Mobile Application Development class 07
Advance Mobile Application Development class 07Advance Mobile Application Development class 07
Advance Mobile Application Development class 07
 
Ecosystem Interactions Class Discussion Presentation in Blue Green Lined Styl...
Ecosystem Interactions Class Discussion Presentation in Blue Green Lined Styl...Ecosystem Interactions Class Discussion Presentation in Blue Green Lined Styl...
Ecosystem Interactions Class Discussion Presentation in Blue Green Lined Styl...
 
APM Welcome, APM North West Network Conference, Synergies Across Sectors
APM Welcome, APM North West Network Conference, Synergies Across SectorsAPM Welcome, APM North West Network Conference, Synergies Across Sectors
APM Welcome, APM North West Network Conference, Synergies Across Sectors
 
Mattingly "AI & Prompt Design: The Basics of Prompt Design"
Mattingly "AI & Prompt Design: The Basics of Prompt Design"Mattingly "AI & Prompt Design: The Basics of Prompt Design"
Mattingly "AI & Prompt Design: The Basics of Prompt Design"
 
Call Girls in Dwarka Mor Delhi Contact Us 9654467111
Call Girls in Dwarka Mor Delhi Contact Us 9654467111Call Girls in Dwarka Mor Delhi Contact Us 9654467111
Call Girls in Dwarka Mor Delhi Contact Us 9654467111
 

1. Why does rent control result in a shortage of rental units..docx

  • 1. 1. Why does rent control result in a shortage of rental units. 2. How does price elasticity of demand affect how much of a tax is passed on to the consumer and how much is absorbed by the seller. Show the effect with graphs. 3. Why can monopolistic firms make economic profit in the short run bot not in the long run. Explain and show graphically. 4. Your brother-in-law wants to borrow $1000 from you but he has a fit when you tell him he will have to pay you the same interest on the loan that the bank gives you. Are you justified? Why or Why not? 5. During the 1930s Jewish fighters dominated boxing. From the around 1975 until the present, blacks have dominated basketball. Explain the cause(s) underlying these two situations. PowerPoint Slides prepared by: Andreea CHIRITESCU Eastern Illinois University Demand and Revenue Management * © 2012 Cengage Learning. All Rights Reserved. May not be copied, scanned, or duplicated, in whole or in part, except for use as permitted in a license distributed with a certain product or service or otherwise on a password-protected website for classroom use.
  • 2. CHAPTER 12 © 2012 Cengage Learning. All Rights Reserved. May not be copied, scanned, or duplicated, in whole or in part, except for use as permitted in a license distributed with a certain product or service or otherwise on a password-protected website for classroom use. Price, Sales, and Consumer ChoiceProfit Revenue minus costRevenue Depends on the customer Consumer behavior - making choices Choices reveal preferences If people spend money on something and not on something else Revealing their preferences * © 2012 Cengage Learning. All Rights Reserved. May not be copied, scanned, or duplicated, in whole or in part, except for use as permitted in a license distributed with a certain product or service or otherwise on a password-protected website for classroom use. © 2012 Cengage Learning. All Rights Reserved. May not be copied, scanned, or duplicated, in whole or in part, except for use as permitted in a license distributed with a certain product or service or otherwise on a password-protected website for classroom use. Price, Sales, and Consumer ChoiceLaw of demand The quantity of a good or service that is purchased Will decline as the price of that good or service rises Everything else unchanged * © 2012 Cengage Learning. All Rights Reserved. May not be copied, scanned, or duplicated, in whole or in part, except for
  • 3. use as permitted in a license distributed with a certain product or service or otherwise on a password-protected website for classroom use. © 2012 Cengage Learning. All Rights Reserved. May not be copied, scanned, or duplicated, in whole or in part, except for use as permitted in a license distributed with a certain product or service or otherwise on a password-protected website for classroom use. ElasticityPrice elasticity of demand Magnitude by which consumers alter the quantity of some product they purchase In response to a change in the price of that productThe more price-elastic demand is The more responsive consumers are to a price change * © 2012 Cengage Learning. All Rights Reserved. May not be copied, scanned, or duplicated, in whole or in part, except for use as permitted in a license distributed with a certain product or service or otherwise on a password-protected website for classroom use. © 2012 Cengage Learning. All Rights Reserved. May not be copied, scanned, or duplicated, in whole or in part, except for use as permitted in a license distributed with a certain product or service or otherwise on a password-protected website for classroom use. ElasticityPrice elasticity of demand Percentage change in the quantity demanded of a product Divided by the percentage change in the price of that producted = %ΔQ / %ΔP %ΔQ = percentage change in quantity demanded
  • 4. %ΔP = percentage change in price * © 2012 Cengage Learning. All Rights Reserved. May not be copied, scanned, or duplicated, in whole or in part, except for use as permitted in a license distributed with a certain product or service or otherwise on a password-protected website for classroom use. © 2012 Cengage Learning. All Rights Reserved. May not be copied, scanned, or duplicated, in whole or in part, except for use as permitted in a license distributed with a certain product or service or otherwise on a password-protected website for classroom use. ElasticityPrice elasticity of demand If between -1 and - ∞: elastic demand If = -1: unit elastic demand If between -1 and 0: inelastic demand Demand curve Illustrates the quantity of an item that will be purchased at each price Relationship between the price and quantity demanded of a good or service * © 2012 Cengage Learning. All Rights Reserved. May not be copied, scanned, or duplicated, in whole or in part, except for use as permitted in a license distributed with a certain product or service or otherwise on a password-protected website for classroom use. © 2012 Cengage Learning. All Rights Reserved. May not be copied, scanned, or duplicated, in whole or in part, except for use as permitted in a license distributed with a certain product or service or otherwise on a password-protected website for classroom use.
  • 5. ElasticityShape of a demand curve Depends on the price elasticity of demandPerfectly elastic demand curve Horizontal line Consumers can purchase any quantity they want at the single prevailing price Even the smallest price change Consumers switch to the producer with the lowest price * © 2012 Cengage Learning. All Rights Reserved. May not be copied, scanned, or duplicated, in whole or in part, except for use as permitted in a license distributed with a certain product or service or otherwise on a password-protected website for classroom use. © 2012 Cengage Learning. All Rights Reserved. May not be copied, scanned, or duplicated, in whole or in part, except for use as permitted in a license distributed with a certain product or service or otherwise on a password-protected website for classroom use. ElasticityPerfectly inelastic demand curve Vertical line Consumers cannot or will not change the quantity of a good they purchase when the price of that good is changedDownward sloping demand curve The steeper – the less elastic * © 2012 Cengage Learning. All Rights Reserved. May not be copied, scanned, or duplicated, in whole or in part, except for use as permitted in a license distributed with a certain product or service or otherwise on a password-protected website for classroom use. © 2012 Cengage Learning. All Rights Reserved. May not be
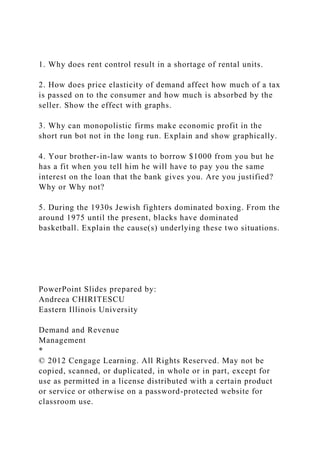
  • 6. copied, scanned, or duplicated, in whole or in part, except for use as permitted in a license distributed with a certain product or service or otherwise on a password-protected website for classroom use. Figure 12.1 The demand curve is a graphic relationship between quantity demanded and price. The graph is drawn with price on the vertical axis and quantity on the horizontal axis. (a) Perfectly elastic demand: Demand is so sensitive to price that even an infinitesimal change leads to a total change in quantity demanded. (b) Perfectly inelastic demand: The quantity demanded is the same no matter the price. Demand is completely insensitive to price. (c) Alternative demand curves: and D2 represents straight downward-sloping demand curves. D2 is said to be more elastic than D1 because at every single price the elasticity of demand is higher at D2 than D1. Demand Curves * © 2012 Cengage Learning. All Rights Reserved. May not be copied, scanned, or duplicated, in whole or in part, except for use as permitted in a license distributed with a certain product or service or otherwise on a password-protected website for classroom use. © 2012 Cengage Learning. All Rights Reserved. May not be copied, scanned, or duplicated, in whole or in part, except for use as permitted in a license distributed with a certain product or service or otherwise on a password-protected website for classroom use. ElasticityPrice Elasticity and Revenue Total revenue, TR = P × Q
  • 7. Dollar value of sales Price of a product multiplied by the quantity sold As price is increased, total revenue: Increases if demand is inelastic Decreases if demand is elastic Does not change if demand is unit-elastic * © 2012 Cengage Learning. All Rights Reserved. May not be copied, scanned, or duplicated, in whole or in part, except for use as permitted in a license distributed with a certain product or service or otherwise on a password-protected website for classroom use. © 2012 Cengage Learning. All Rights Reserved. May not be copied, scanned, or duplicated, in whole or in part, except for use as permitted in a license distributed with a certain product or service or otherwise on a password-protected website for classroom use. ElasticityElasticity of demand depends on How many substitutes and how good of substitutes they are More substitutes – more elastic demand Commoditization – price elasticity of demand is very large Period over which we measure the price elasticity Longer – more elastic demand * © 2012 Cengage Learning. All Rights Reserved. May not be copied, scanned, or duplicated, in whole or in part, except for use as permitted in a license distributed with a certain product or service or otherwise on a password-protected website for classroom use. © 2012 Cengage Learning. All Rights Reserved. May not be copied, scanned, or duplicated, in whole or in part, except for use as permitted in a license distributed with a certain product or service or otherwise on a password-protected website for
  • 8. classroom use. Figure 12.2 Demand is perfectly elastic for Demand1. The firm cannot charge more without losing all of its customers because the product is a commodity—there are many perfect substitutes. The firm undertakes an advertising campaign to change the image of the product. If successful, consumers begin to think the product is not a commodity, that there are not lots of perfect substitutes. The demand curve then becomes steeper, as with Demand2. Changing Price Elasticity * © 2012 Cengage Learning. All Rights Reserved. May not be copied, scanned, or duplicated, in whole or in part, except for use as permitted in a license distributed with a certain product or service or otherwise on a password-protected website for classroom use. © 2012 Cengage Learning. All Rights Reserved. May not be copied, scanned, or duplicated, in whole or in part, except for use as permitted in a license distributed with a certain product or service or otherwise on a password-protected website for classroom use. Business Insight Price Elasticity of Demand for GasolinePrice elasticity of demand for gasoline, US Over a period of one year or less = −0.26 10% hike in the price of gasoline lowers quantity demanded by 2.6% Long-run = −0.58
  • 9. 10% hike in gasoline causes quantity demanded to decline by 5.8% * © 2012 Cengage Learning. All Rights Reserved. May not be copied, scanned, or duplicated, in whole or in part, except for use as permitted in a license distributed with a certain product or service or otherwise on a password-protected website for classroom use. © 2012 Cengage Learning. All Rights Reserved. May not be copied, scanned, or duplicated, in whole or in part, except for use as permitted in a license distributed with a certain product or service or otherwise on a password-protected website for classroom use. Business Insight Price Elasticity of Demand for Gasoline10% increase in real price of fuel Volume of traffic decline By 1% within a year By 3% in longer run (5 years) Volume of fuel consumed decreases By 2.5% within a year By 6% in the longer run Efficiency of use of fuel increases By 1.5% within a year By 4% in the longer run * © 2012 Cengage Learning. All Rights Reserved. May not be copied, scanned, or duplicated, in whole or in part, except for use as permitted in a license distributed with a certain product or service or otherwise on a password-protected website for classroom use. © 2012 Cengage Learning. All Rights Reserved. May not be
  • 10. copied, scanned, or duplicated, in whole or in part, except for use as permitted in a license distributed with a certain product or service or otherwise on a password-protected website for classroom use. Other Demand ElasticitiesOther elasticity measures Income elasticity of demand Cross price elasticity of demand Advertising elasticity Promotion elasticity * © 2012 Cengage Learning. All Rights Reserved. May not be copied, scanned, or duplicated, in whole or in part, except for use as permitted in a license distributed with a certain product or service or otherwise on a password-protected website for classroom use. © 2012 Cengage Learning. All Rights Reserved. May not be copied, scanned, or duplicated, in whole or in part, except for use as permitted in a license distributed with a certain product or service or otherwise on a password-protected website for classroom use. Figure 12.3 The demand curve is a relation between price and quantity demanded, everything else held constant. The things held constant are income, advertising, expectations, tastes, preference, and anything else that could affect demand. When one of these changes, the demand curve shifts. For instance, Demand2 represents demand following an increased income. The distance the demand curve shifts is reflective of the income elasticity of demand. Changes Other than Price
  • 11. * © 2012 Cengage Learning. All Rights Reserved. May not be copied, scanned, or duplicated, in whole or in part, except for use as permitted in a license distributed with a certain product or service or otherwise on a password-protected website for classroom use. © 2012 Cengage Learning. All Rights Reserved. May not be copied, scanned, or duplicated, in whole or in part, except for use as permitted in a license distributed with a certain product or service or otherwise on a password-protected website for classroom use. Other Demand ElasticitiesU.S. economy Has grown over the years The growth has not been at a steady paceBusiness cycles Upswing in business activity Incomes are growing Sales of many products are rising Downswing Incomes are not rising Sales may be declining * © 2012 Cengage Learning. All Rights Reserved. May not be copied, scanned, or duplicated, in whole or in part, except for use as permitted in a license distributed with a certain product or service or otherwise on a password-protected website for classroom use. © 2012 Cengage Learning. All Rights Reserved. May not be copied, scanned, or duplicated, in whole or in part, except for use as permitted in a license distributed with a certain product or service or otherwise on a password-protected website for classroom use.
  • 12. Figure 12.4 The real output or GDP of the U.S. economy each year is pictured. The picture points out two things: The total output has grown over the years, and the growth has not been a steady rise. Economic Growth and the Business Cycle * © 2012 Cengage Learning. All Rights Reserved. May not be copied, scanned, or duplicated, in whole or in part, except for use as permitted in a license distributed with a certain product or service or otherwise on a password-protected website for classroom use. © 2012 Cengage Learning. All Rights Reserved. May not be copied, scanned, or duplicated, in whole or in part, except for use as permitted in a license distributed with a certain product or service or otherwise on a password-protected website for classroom use. Figure 12.5 Taking out the growth part of Figure 12.4 leaves just the cycles. Business Cycle * © 2012 Cengage Learning. All Rights Reserved. May not be copied, scanned, or duplicated, in whole or in part, except for use as permitted in a license distributed with a certain product or service or otherwise on a password-protected website for classroom use. © 2012 Cengage Learning. All Rights Reserved. May not be copied, scanned, or duplicated, in whole or in part, except for use as permitted in a license distributed with a certain product or service or otherwise on a password-protected website for classroom use.
  • 13. Other Demand ElasticitiesIncome Elasticity of Demand Responsiveness of consumer purchases to income changes Percentage change in demand Divided by the percentage change in income Everything else held constant * © 2012 Cengage Learning. All Rights Reserved. May not be copied, scanned, or duplicated, in whole or in part, except for use as permitted in a license distributed with a certain product or service or otherwise on a password-protected website for classroom use. © 2012 Cengage Learning. All Rights Reserved. May not be copied, scanned, or duplicated, in whole or in part, except for use as permitted in a license distributed with a certain product or service or otherwise on a password-protected website for classroom use. Other Demand ElasticitiesLuxury good Very high income elasticity (>1.0) 1% increase in income will lead to a greater than 1% rise in demand As long as the economy is growing And incomes are rising Sales are rising * © 2012 Cengage Learning. All Rights Reserved. May not be copied, scanned, or duplicated, in whole or in part, except for use as permitted in a license distributed with a certain product or service or otherwise on a password-protected website for classroom use. © 2012 Cengage Learning. All Rights Reserved. May not be copied, scanned, or duplicated, in whole or in part, except for use as permitted in a license distributed with a certain product
  • 14. or service or otherwise on a password-protected website for classroom use. Other Demand ElasticitiesNormal good Positive but <1 income elasticity As income rises, demand rises Cyclical goodsInferior good Negative income elasticity As income rises, demand falls Countercyclical goods * © 2012 Cengage Learning. All Rights Reserved. May not be copied, scanned, or duplicated, in whole or in part, except for use as permitted in a license distributed with a certain product or service or otherwise on a password-protected website for classroom use. © 2012 Cengage Learning. All Rights Reserved. May not be copied, scanned, or duplicated, in whole or in part, except for use as permitted in a license distributed with a certain product or service or otherwise on a password-protected website for classroom use. Other Demand ElasticitiesComplements Items used together Substitutes Items used in place of each otherCross elasticity of demand Measures whether goods and services are complements or substitutes * © 2012 Cengage Learning. All Rights Reserved. May not be copied, scanned, or duplicated, in whole or in part, except for use as permitted in a license distributed with a certain product or service or otherwise on a password-protected website for
  • 15. classroom use. © 2012 Cengage Learning. All Rights Reserved. May not be copied, scanned, or duplicated, in whole or in part, except for use as permitted in a license distributed with a certain product or service or otherwise on a password-protected website for classroom use. Other Demand ElasticitiesCross elasticity of demand Percentage change in demand of one good Divided by the percentage change in the price of a related good Close substitutes: high positive cross elasticities Complements: negative cross-price elasticities Unrelated goods: zero cross-price elasticity * © 2012 Cengage Learning. All Rights Reserved. May not be copied, scanned, or duplicated, in whole or in part, except for use as permitted in a license distributed with a certain product or service or otherwise on a password-protected website for classroom use. © 2012 Cengage Learning. All Rights Reserved. May not be copied, scanned, or duplicated, in whole or in part, except for use as permitted in a license distributed with a certain product or service or otherwise on a password-protected website for classroom use. Elasticity EstimatesComputer technology Much better information about customers and the elasticities of demand Enabling many “low-margin” industries to improve their margins By knowing their customers better Firms are increasing profits because they better understand the
  • 16. customer * © 2012 Cengage Learning. All Rights Reserved. May not be copied, scanned, or duplicated, in whole or in part, except for use as permitted in a license distributed with a certain product or service or otherwise on a password-protected website for classroom use. © 2012 Cengage Learning. All Rights Reserved. May not be copied, scanned, or duplicated, in whole or in part, except for use as permitted in a license distributed with a certain product or service or otherwise on a password-protected website for classroom use. Elasticity EstimatesElasticity models Daily evaluation of pricing factors Site by site That are stored on a running database Historical price, volume, and competitive data Continual fine-tuning accomplished through daily data updates * © 2012 Cengage Learning. All Rights Reserved. May not be copied, scanned, or duplicated, in whole or in part, except for use as permitted in a license distributed with a certain product or service or otherwise on a password-protected website for classroom use. © 2012 Cengage Learning. All Rights Reserved. May not be copied, scanned, or duplicated, in whole or in part, except for use as permitted in a license distributed with a certain product or service or otherwise on a password-protected website for classroom use. Elasticity EstimatesGasoline - typical elasticity estimates
  • 17. For a single retailer According to the pricing company MPSI Systems Inc. 6 for regular 4.5 for mid-grade 3 for premium * © 2012 Cengage Learning. All Rights Reserved. May not be copied, scanned, or duplicated, in whole or in part, except for use as permitted in a license distributed with a certain product or service or otherwise on a password-protected website for classroom use. © 2012 Cengage Learning. All Rights Reserved. May not be copied, scanned, or duplicated, in whole or in part, except for use as permitted in a license distributed with a certain product or service or otherwise on a password-protected website for classroom use. Melissa Buehrlen Business Economics Instructor Somers 06/03/2013 Business Economics: Chp. 12 Directions: Answer all seven (7) questions; underneath all the questions already listed. Use this document to answer the following questions. Do not type a separate word document to answer the following questions. Answer using complete sentences and explain. 1.) For each of the following pairs of goods or services, identify the one for which the price elasticity of demand is greater and explain why. · Coffee/Starbucks coffee. · Tuition at a public university/tuition at a private university. · Emergency room medical services/annual physical exam. · Movies in the afternoon/movies at night.
  • 18. · Prescription medicine/over the counter medicine. 2.) Although water is essential to life no matter where one lives, the demand for water differs across regions. In one study, it was found that the price elasticity of demand for water in all regions of the United States ranged from 0.39 to 0.69. a.) Why is the demand for water price-inelastic? b.) In those regions where outdoor use of water makes up relatively large portion of total use, the price elasticity is high. Why? c.) The demand for water in the summer months is greater than in the winter months. Explain why. 3.) The income elasticity of demand for automobiles in the United States was estimated by a government agency to be between 2.5 and 3.9. a.) What does this mean? b.) If incomes rise by 10 percent, what happens to the purchase of automobiles? 4.) Explain why the demand curve is a horizontal line in the situation called perfect competition. 5.) The demand curve slopes downward. Explain. 6.) What would happen to the demand curve in each of the following cases: a.) Income rises. b.) The number of customer rises. c.) The number of substitutes increases. d.) People expect that the price of the good will decline in the near future.
  • 19. e.) People expect that the price of the good will rise in the near future. 7.) Using elasticity, explain what “market power” means.