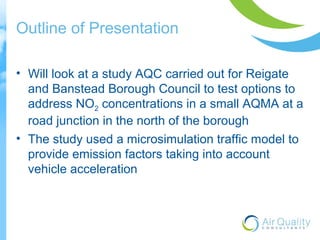
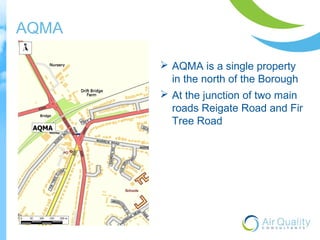
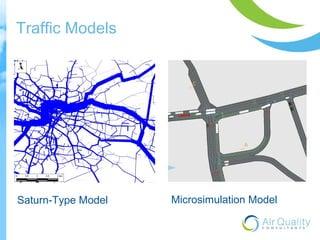
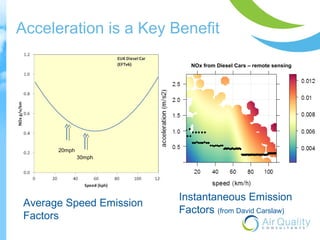
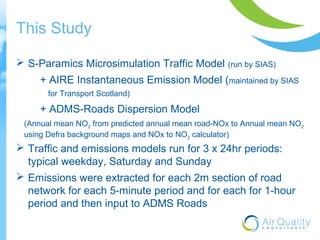
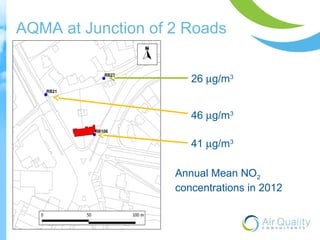
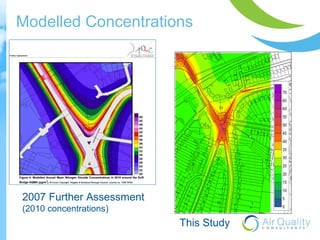
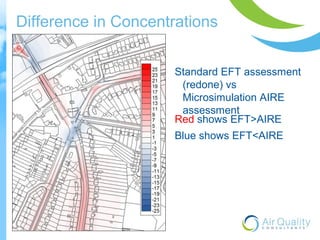
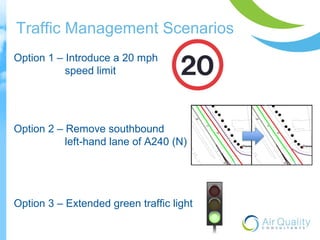
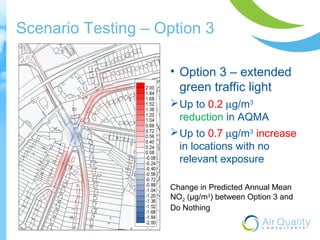
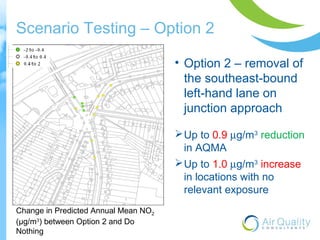
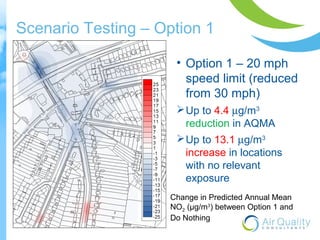
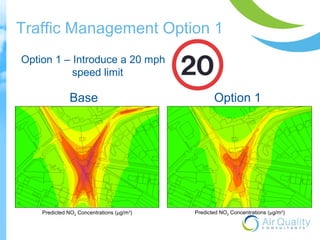
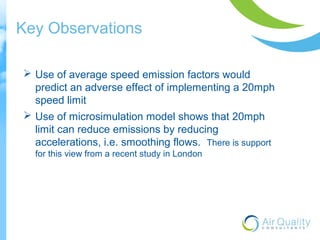
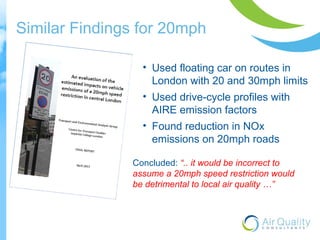
Linking ADMS with 
Microsimulation Models 
Prof. Duncan Laxen 
and 
Dr Ben Marner
Outline of Presentation 
• Will look at a study AQC carried out for Reigate 
and Banstead Borough Council to test options to 
address NO2 concentrations in a small AQMA at a 
road junction in the north of the borough 
• The study used a microsimulation traffic model to 
provide emission factors taking into account 
vehicle acceleration
AQMA 
 AQMA is a single property 
in the north of the Borough 
 At the junction of two main 
roads Reigate Road and Fir 
Tree Road
Benefits of Microsimulation 
Traffic Models 
• A conventional traffic model produces 
 Link-average speeds and flows 
• A microsimulation traffic model 
 Can provide details of flows, speeds and 
acceleration for individual lanes in great spatial 
detail 
 But resource intensive, so mainly applied to 
smaller sets of links and usually to peak hours
Traffic Models 
Saturn-Type Model Microsimulation Model
Acceleration is a Key Benefit 
Instantaneous Emission 
Factors (from David Carslaw) 
Average Speed Emission 
Factors 
NOx from Diesel Cars – remote sensing 
20mph 
30mph
This Study 
 S-Paramics Microsimulation Traffic Model (run by SIAS) 
+ AIRE Instantaneous Emission Model (maintained by SIAS 
for Transport Scotland) 
+ ADMS-Roads Dispersion Model 
(Annual mean NO2 from predicted annual mean road-NOx to Annual mean NO2 
using Defra background maps and NOx to NO2 calculator) 
 Traffic and emissions models run for 3 x 24hr periods: 
typical weekday, Saturday and Sunday 
 Emissions were extracted for each 2m section of road 
network for each 5-minute period and for each for 1-hour 
period and then input to ADMS Roads
AQMA at Junction of 2 Roads 
26 mg/m3 
46 mg/m3 
41 mg/m3 
Annual Mean NO2 
concentrations in 2012
Network broken down into 3,500 
2m line sources 
High degree of automation, 
taking the data from S-Paramics 
to AIRE to 
ADMS, and then collating 
the results 
In ADMS, all emissions set 
to 1g/km/s, and then the 
AIRE data entered as .hfc 
files 
Also modelled the same network using 1-hour 
link-average speeds for each 2m link but using 
EFT emissions for comparison
Modelled Roads 
58 road lane sections modelled 
S-Paramics: 
•Traffic counts 
•Traffic speeds 
•Vehicle mix 
AIRE: 
•1-hour emission profiles 
•5-minute emission profiles
AIRE vs EFT Comparison 
Predicted Annual Mean Road-NOx Based on AIRE vs EFT 
(EFT used 2m link speeds) 
 Modelled 109 
receptors 
 Much Greater 
Range in AIRE-Based 
Predictions 
than in EFT-Based 
Predictions 
EFT 
AIRE
Results on One Link (EFT vs AIRE) 
 Different Movements Compare Differently 
 Large Variation in Concentrations Along a 
Relatively Short Road-Section (depend on 
acceleration and idle time)
Modelled Concentrations 
2007 Further Assessment 
(2010 concentrations) 
This Study
Difference in Concentrations 
Standard EFT assessment 
(redone) vs 
Microsimulation AIRE 
assessment 
Red shows EFT>AIRE 
Blue shows EFT<AIRE
Traffic Management Scenarios 
Option 1 – Introduce a 20 mph 
speed limit 
Option 2 – Remove southbound 
left-hand lane of A240 (N) 
Option 3 – Extended green traffic light
Scenario Testing – Option 3 
• Option 3 – extended 
green traffic light 
Up to 0.2 mg/m3 
reduction in AQMA 
Up to 0.7 mg/m3 increase 
in locations with no 
relevant exposure 
Change in Predicted Annual Mean 
NO2 (μg/m3) between Option 3 and 
Do Nothing
Scenario Testing – Option 2 
Change in Predicted Annual Mean NO2 
(μg/m3) between Option 2 and Do 
Nothing 
• Option 2 – removal of 
the southeast-bound 
left-hand lane on 
junction approach 
Up to 0.9 mg/m3 reduction 
in AQMA 
Up to 1.0 mg/m3 increase 
in locations with no 
relevant exposure
Scenario Testing – Option 1 
• Option 1 – 20 mph 
speed limit (reduced 
from 30 mph) 
Up to 4.4 mg/m3 
reduction in AQMA 
Up to 13.1 mg/m3 
increase in locations 
with no relevant 
exposure 
Change in Predicted Annual Mean 
NO2 (μg/m3) between Option 1 and 
Do Nothing
Traffic Management Option 1 
Option 1 – Introduce a 20 mph 
speed limit 
Base Option 1 
Predicted NO2 Concentrations (μg/m3) Predicted NO2 Concentrations (μg/m3)
Study Limitations 
 The local monitoring was insufficient to fully verify 
the findings of the microsimulation modelling 
 The findings depend on the accuracy of the 
microsimulation model especially how acceleration 
is presented (it is understood that there are differences 
between microsimulation models and that S-Paramics 
handles acceleration more accurately)
Other Observations 
 2m links potentially over-kill for emissions 
subdivision, but facilitated automated link with ADMS 
source-geometry 
 Automation meant that a larger study area could 
have been modelled in ADMS relatively easily once 
systems in place 
 Even with this small network, volume of emissions 
data made QA onerous (1/4 million different emissions 
values per scenario)
Key Observations 
 Use of average speed emission factors would 
predict an adverse effect of implementing a 20mph 
speed limit 
 Use of microsimulation model shows that 20mph 
limit can reduce emissions by reducing 
accelerations, i.e. smoothing flows. There is support 
for this view from a recent study in London
Similar Findings for 20mph 
• Used floating car on routes in 
London with 20 and 30mph limits 
• Used drive-cycle profiles with 
AIRE emission factors 
• Found reduction in NOx 
emissions on 20mph roads 
Concluded: “.. it would be incorrect to 
assume a 20mph speed restriction would 
be detrimental to local air quality …”
Wide-scale Rollout of 20mph Zones
Thanks to 
• Dr Leon Hibbs at Reigate and Banstead BC 
• SIAS Transport Planners 
• Defra (for grant funding) 
• and Dr Austin Cogan at AQC
Head Office 
23 Coldharbour Road, Bristol BS6 7JT 
Tel: 0117 974 1086 
London Office 
12 Airedale Road, London SW12 8SF 
Tel/Fax: 020 8673 4313

Duncan Laxen - DMUG 2014

  • 1.
    Linking ADMS with Microsimulation Models Prof. Duncan Laxen and Dr Ben Marner
  • 2.
    Outline of Presentation • Will look at a study AQC carried out for Reigate and Banstead Borough Council to test options to address NO2 concentrations in a small AQMA at a road junction in the north of the borough • The study used a microsimulation traffic model to provide emission factors taking into account vehicle acceleration
  • 3.
    AQMA  AQMAis a single property in the north of the Borough  At the junction of two main roads Reigate Road and Fir Tree Road
  • 4.
    Benefits of Microsimulation Traffic Models • A conventional traffic model produces  Link-average speeds and flows • A microsimulation traffic model  Can provide details of flows, speeds and acceleration for individual lanes in great spatial detail  But resource intensive, so mainly applied to smaller sets of links and usually to peak hours
  • 5.
    Traffic Models Saturn-TypeModel Microsimulation Model
  • 6.
    Acceleration is aKey Benefit Instantaneous Emission Factors (from David Carslaw) Average Speed Emission Factors NOx from Diesel Cars – remote sensing 20mph 30mph
  • 7.
    This Study S-Paramics Microsimulation Traffic Model (run by SIAS) + AIRE Instantaneous Emission Model (maintained by SIAS for Transport Scotland) + ADMS-Roads Dispersion Model (Annual mean NO2 from predicted annual mean road-NOx to Annual mean NO2 using Defra background maps and NOx to NO2 calculator)  Traffic and emissions models run for 3 x 24hr periods: typical weekday, Saturday and Sunday  Emissions were extracted for each 2m section of road network for each 5-minute period and for each for 1-hour period and then input to ADMS Roads
  • 8.
    AQMA at Junctionof 2 Roads 26 mg/m3 46 mg/m3 41 mg/m3 Annual Mean NO2 concentrations in 2012
  • 9.
    Network broken downinto 3,500 2m line sources High degree of automation, taking the data from S-Paramics to AIRE to ADMS, and then collating the results In ADMS, all emissions set to 1g/km/s, and then the AIRE data entered as .hfc files Also modelled the same network using 1-hour link-average speeds for each 2m link but using EFT emissions for comparison
  • 10.
    Modelled Roads 58road lane sections modelled S-Paramics: •Traffic counts •Traffic speeds •Vehicle mix AIRE: •1-hour emission profiles •5-minute emission profiles
  • 11.
    AIRE vs EFTComparison Predicted Annual Mean Road-NOx Based on AIRE vs EFT (EFT used 2m link speeds)  Modelled 109 receptors  Much Greater Range in AIRE-Based Predictions than in EFT-Based Predictions EFT AIRE
  • 12.
    Results on OneLink (EFT vs AIRE)  Different Movements Compare Differently  Large Variation in Concentrations Along a Relatively Short Road-Section (depend on acceleration and idle time)
  • 13.
    Modelled Concentrations 2007Further Assessment (2010 concentrations) This Study
  • 14.
    Difference in Concentrations Standard EFT assessment (redone) vs Microsimulation AIRE assessment Red shows EFT>AIRE Blue shows EFT<AIRE
  • 15.
    Traffic Management Scenarios Option 1 – Introduce a 20 mph speed limit Option 2 – Remove southbound left-hand lane of A240 (N) Option 3 – Extended green traffic light
  • 16.
    Scenario Testing –Option 3 • Option 3 – extended green traffic light Up to 0.2 mg/m3 reduction in AQMA Up to 0.7 mg/m3 increase in locations with no relevant exposure Change in Predicted Annual Mean NO2 (μg/m3) between Option 3 and Do Nothing
  • 17.
    Scenario Testing –Option 2 Change in Predicted Annual Mean NO2 (μg/m3) between Option 2 and Do Nothing • Option 2 – removal of the southeast-bound left-hand lane on junction approach Up to 0.9 mg/m3 reduction in AQMA Up to 1.0 mg/m3 increase in locations with no relevant exposure
  • 18.
    Scenario Testing –Option 1 • Option 1 – 20 mph speed limit (reduced from 30 mph) Up to 4.4 mg/m3 reduction in AQMA Up to 13.1 mg/m3 increase in locations with no relevant exposure Change in Predicted Annual Mean NO2 (μg/m3) between Option 1 and Do Nothing
  • 19.
    Traffic Management Option1 Option 1 – Introduce a 20 mph speed limit Base Option 1 Predicted NO2 Concentrations (μg/m3) Predicted NO2 Concentrations (μg/m3)
  • 20.
    Study Limitations The local monitoring was insufficient to fully verify the findings of the microsimulation modelling  The findings depend on the accuracy of the microsimulation model especially how acceleration is presented (it is understood that there are differences between microsimulation models and that S-Paramics handles acceleration more accurately)
  • 21.
    Other Observations 2m links potentially over-kill for emissions subdivision, but facilitated automated link with ADMS source-geometry  Automation meant that a larger study area could have been modelled in ADMS relatively easily once systems in place  Even with this small network, volume of emissions data made QA onerous (1/4 million different emissions values per scenario)
  • 22.
    Key Observations Use of average speed emission factors would predict an adverse effect of implementing a 20mph speed limit  Use of microsimulation model shows that 20mph limit can reduce emissions by reducing accelerations, i.e. smoothing flows. There is support for this view from a recent study in London
  • 23.
    Similar Findings for20mph • Used floating car on routes in London with 20 and 30mph limits • Used drive-cycle profiles with AIRE emission factors • Found reduction in NOx emissions on 20mph roads Concluded: “.. it would be incorrect to assume a 20mph speed restriction would be detrimental to local air quality …”
  • 24.
  • 25.
    Thanks to •Dr Leon Hibbs at Reigate and Banstead BC • SIAS Transport Planners • Defra (for grant funding) • and Dr Austin Cogan at AQC
  • 26.
    Head Office 23Coldharbour Road, Bristol BS6 7JT Tel: 0117 974 1086 London Office 12 Airedale Road, London SW12 8SF Tel/Fax: 020 8673 4313