Recommended

Recommended
More Related Content
What's hot
What's hot (20)
Similar to Ascb 2010 poster
Similar to Ascb 2010 poster (20)
Recently uploaded
Recently uploaded (20)
Ascb 2010 poster
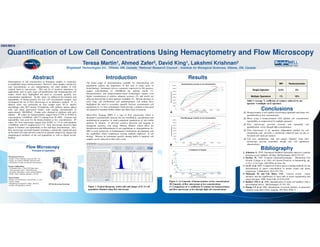
- 1. Determination of cell concentration in biological samples is commonly accomplished using a hemacytometer. However, when samples contain low total concentrations, or rare subpopulations, the small number of cells counted leads to inaccuracies. This can be of practical importance in applications such as early stage cell proliferation and stem/progenitor cell studies which have highlighted the need to accurately quantify low concentration populations. In this study we addressed the linearity and repeatability of hemacytometry for low cell concentration samples, and investigated the use of flow microscopy as an alternative method. A 1:3 dilution series was performed on four sample types (IC-21 murine macrophage cells, EL4 murine T-lymphoma cells, primary murine spleen cells, and 10µm polystyrene beads), with starting concentrations of approximately 300,000/ml. Counts were obtained in triplicate with each method. R² values for hemacytometry ranged from 0.7705 to 0.9926 at concentrations <16,000/ml, with CV ranging from 28-108%. Linearity and repeatability were poor for the hemacytometer at low concentrations. R² values for flow microscopy ranged from 0.9997 to 1.0 at concentrations Introduction Quantification of Low Cell Concentrations Using Hemacytometry and Flow Microscopy Teresa Martin¹, Ahmed Zafer², David King¹, Lakshmi Krishnan² ¹Brightwell Technologies Inc., Ottawa, ON, Canada; ²National Research Council – Institute for Biological Sciences, Ottawa, ON, Canada The broad range of instrumentation available for characterizing cell populations reflects the importance of this task in many areas of biotechnology. Automated devices commonly employed for this purpose, require concentrations of >50,000/ml for optimal results (1). Hemacytometers and hemacytometry-based technologies require even higher concentrations to achieve adequate accuracy (2), and results are often inconsistent due to inter-operator variability (3). Recent advances in early stage cell proliferation and stem/progenitor cell studies have highlighted the need to accurately quantify low/rare concentration cell populations (4, 5). New technologies which provide a solution to this need are required to facilitate further studies into these areas of research. Micro-Flow Imaging (MFI) is a type of flow microscopy which is designed to automatically measure the size distribution, concentration and morphological properties of multi-component populations of sub-visible particles in solution. It provides sensitive detection and imaging of Hemacytometry is not capable of providing repeatable and linear cell quantification at low concentrations When using a hemacytometer with optimal cell concentration, repeatability is compromised by multiple operators Flow microscopy provides accurate and repeatable cell Abstract A Conclusions MFI Hemacytometer Single Operator 0.5% 5% Multiple Operators 1% 10% Table 1: Average % coefficient of variance achieved by one operator vs multiple (n=3) operators Results 2303/B819 Hemacytometry Linearity at Low Concentrations Flow Microscopy Linearity at Low Concentrations values for flow microscopy ranged from 0.9997 to 1.0 at concentrations <16,000/ml, with CV ranging from 2-7%. Flow microscopy showed a high degree of linearity and repeatability at low and high concentrations. Also, flow microscopy provided benefits including a statistically significant data set for both cell count and size, removal of operator subjectivity, images and morphological attributes of the cell populations as well as digital record- keeping. particles in solution. It provides sensitive detection and imaging of transparent particles, and image filtering abilities which allow for identification and differentiation of rare populations or subpopulations (6). MFI is used extensively in biotherapeutic formulation development, and has capabilities which complement existing methods employed in cell biology. Because no instrument specific running buffer is required, cell samples can be analyzed in their native state. 1. Johnston, G. 2010. Automated handheld instrument improves counting precision across multiple cell lines. BioTechniques 48(4):325-327. 2. Strober, W. 1997. Common ImmunolTechniques - Monitoring Cell Growth. Coligan et al. (Eds.) In Current Protocols in Immunology, pp. A.3A.1-A.3A.2ogic. John Wiley & Sons, Inc. 3. Lu JC et al. 2007. Comparison of three sperm counting methods for the determination of sperm concentration in human semen and sperm suspensions. LabMedicine 38(4):232-236. 4. Mimeault, M. and S.K. Batra. 2006. Concise review: recent advances and the significance of stem cells in tissue regeneration and cancer therapies. 2006. Stem Cells 24:2319-2345. 5. Badders NM et al. 2008. Quantification of small cell numbers with a microchannel device. BioTechniques 45:321-325. 6. Huang CT et al. 2009. Quantitation of protein particles in parenteral solutions using Micro-Flow Imaging. JPS 98(9):3058-71. Flow microscopy provides accurate and repeatable cell quantification at low through high concentrations Flow microscopy is an operator independent method for cell enumeration and provides a statistically enhanced data set due to increased cell count per analysis Cell size, morphology data and images obtained using flow microscopy provide immediate insight into cell population characteristics Bibliography Measurement Process: • Sample is drawn through a precision flow cell • Images are acquired (multiple frames/second) • All particles in frame are detected and measured System Configuration: • 5X Magnification, 475nm LED light source • 10 bit grayscale sensor, 1280x1024 pixels • Automatic illumination control and thresholding • Small volume sampling apparatus (<0.5ml) System Output: • Particle size distributions (concentration vs. size) • Particle images • Morphological parameters (shape, intensity) • Particle sub-population isolation Flow Microscopy Principle of Operation Detection Zone MFI Flow MicroscopyTechnology B Figure 2: (A) Linearity of hemacytometer at low concentrations (B) Linearity of flow microscope at low concentrations (C) Comparison of % coefficient of variance for hemacytometer and flow microscope at low through high cell concentrations Figure 1: Typical histogram, scatter plot and images of IC-21 cell population obtained using flow microscopy C % Coefficient of Variance