Kodo Millet PPT made by Ghanshyam bairwa college of Agriculture kumher bhara...
Research
1. A Comparative Analysis of the Health of the Ni River and
Massaponax Creek in Spotsylvania County!
Erin E. Stewart, Ashley T. Elliott, Holly E. Richters and Dr. Michael L. Bass — Department of Earth &
Environmental Sciences, University of Mary Washington!
Introduction!
The main focus of this research project is to determine the health of both
the Ni River and Massaponax Creek in Spotsylvania County, VA. As
good representations of a rural and urban tributary respectively, the two
streams provide a good demonstration of the effects of urban
development. The Ni River was also examined in anticipation of the Ni
Village development and will be monitored during the building process
to determine the impacts of construction on stream ecology. !
! There are four sample sites located on Massaponax Creek and
three sites on the Ni River. Each stream includes sites of either high or
low human influence. The following maps show the locations of each
sample site. At each site, water and macrobenthic samples were taken
for evaluations of both aquatic insect diversity and chemical variations. !
The vacuum and filter system used for TSS was also applied to test for
Fecal Coliform. Samples were collected in sanitized whirlbags and
placed on ice. Once at the lab, EPA Method 1603 was used. Afterwards,
the colony forming units (CFUs) were counted and recorded. !
Discussion and Conclusion!
Results!
I. Macrobenthic!
Good quality streams typically have higher percentages of the Orders
Ephemeroptera (Mayflies), Plecoptera (Stoneflies) and Trichoptera
(Caddisflies), also known as %EPT. These three orders are bioindicators of pollution levels in a stream and are less tolerant of
pollutants and are sensitive to variance in dissolved oxygen levels. !
!
Figure 8. shows
the % EPT for
each sample site
on the Ni River. !
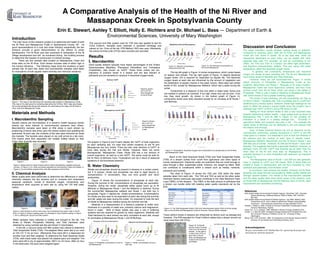
Figure 1. The map on the left shows the sampling sites located on Massaponax Creek.
The map on the right gives the sampling sites along the Ni River. Both maps also display
the human development along both streams. As confirmed by the maps, the Ni River is
more rural than Massaponax Creek. !
Figure 13. The Hardness concentrations on
the Ni and Massaponax!
Figure 12. Alkalinity concentrations
measured at each site!
!The top left graph in Figure 14 shows temperature, which varies based
on season and climate. The top right graph of Figure 14 depicts dissolved
oxygen levels. DO is required for respiration by aquatic life. The dissolved
oxygen levels at each site are influenced by the amount of vegetation and
the distribution of aquatic insects in the water column. Most sites had similar
levels of DO, except for Massaponax Wetland, which had a spike during the
winter. !
!Conductivity is a measure of the ions within a water body. Some ions
are needed in streams as nutrients. If too high, these ions can be toxic. If too
low, they stunt growth. As shown in the bottom graph of Figure 14,
conductivity levels were fairly standard except for an increase at Ni Route 1
and McEwan. !
Materials and Methods!
I. Macrobenthic Sampling!
Aquatic insects are bio-indicators of a stream’s health because certain
insects are more tolerant to environmental stressors than others.
Macrobenthic samples were taken at riffle areas in each stream by
positioning D-frame nets firmly upon the stream bottom and upsetting the
sediments. At each site, the contents of the nets were removed six times
into buckets. The buckets were placed on ice until arrival at a lab room.
The insects were then separated into smaller bottles based on their
Order; their diversity was recorded.!
!
Figure 2!
Figure 3!
Figure 4!
Figure 2. Ashley and Erin using D-frame nets to collect macrobenthic samples during the
summer. In Figure 3, Erin, Holly and Ashley separate the macrobenthic Orders into bottles. In
Figure 4, Erin and Ashley examine their nets after sampling in the Ni River. !
II. Chemical Analysis!
Water quality tests were performed to determine the differences in water
chemistry between the two streams and to compare and understand
seasonal variations. Levels of dissolved oxygen, conductivity, and
temperature were acquired at each site by using the YSI 556 water
meters. !
Figure 5!
Figure 6!
Figure 7!
Figure 5. Holly Richters is shown here using the Professional Plus water meter in the Ni
River. In Figure 6, Ashley is getting water in a whirlbag for Fecal Coliform testing. In Figure
7. Erin is utilizing the vacuum and filter system. !
Water samples were collected in bottles and brought to the lab. The
levels of Nitrate, Phosphate, Alkalinity, and Total Hardness were
obtained by using Lamotte test kits and Smart 3 Colorimeters. !
!In the lab, a vacuum pump and filter system was utilized to determine
Total Suspended Solids (TSS). Pre-weighed filters were laid in an oven
at 105-110 °C for an hour. Afterwards, they were left in a desiccator for
another hour and then weighed. To determine the Total Dissolved Solids
(TDS), well-mixed water was placed into labeled pans and weighed. The
pans were left to dry at approximately 180°C for 24 hours. After an hour
in the desiccator, the pans were weighed again. !
! !
Figure 9. shows
the % EPT for
each sample site
on Massaponax
Creek!
The graphs in Figure 8 and 9 each display the %EPT of total organisms
for each sampling site. It’s clear that certain locations on the Ni and
Massaponax are very similar. There are also clear declines of %EPT at
most sites during the Fall and Winter. However, there are some
discrepancies. Massaponax Creek, Route 208 has a low amount of
overall organisms, as well as a low %EPT. The same could be said for
the Ni River at McEwan Farm. Fluctuations can be a result of seasonal
variations or environmental stressors. !
!!
II. Water Chemistry!
Nitrate and phosphate should be present in streams to a certain extent,
but if in excess, nitrate and phosphate can lead to algal blooms or
eutrophication. If nonexistent, they can limit growth and stunt
productivity.!
! Figure 10 shows the concentrations of phosphate at each site.
During the summer & fall, concentrations of phosphate are equivalent.
However, during the winter, phosphate either peaks (such as at Ni
McEwan or Massaponax Route 1 and the Wetland) or declines. During
the summer/fall, Massaponax wetland and Route 1 are both low in
phosphate. Figure 11 depicts the nitrate concentrations. Concentrations
for nitrate are also seen to be equivalent at each site during the summer
and fall; peaks are seen during the winter. It’s important to note the lack
of nitrate at Massaponax wetland during the summer and fall. !
! Alkalinity is a measurement of a stream’s potential to buffer acid.
Hardness is a quantity of metal ions, primarily calcium and magnesium,
found in water. Both of these metals also play a role in buffering
systems and are required for growth by many organisms. Alkalinity and
Total Hardness for each stream are fairly consistent at each site, except
for anomalies at Massaponax Route 1 and Ni McEwan. !
Figure 10. Phosphate concentrations on the Ni
and Massaponax!
Figure 11. Nitrate concentrations found at
each site. !
Figure 14. Temperature, Dissolved Oxygen and Conductivity of all sample sites on the Ni River
and Massaponax Creek.!
!Much of the Total Dissolved Solids (TDS) and Total Suspended Solids
(TSS) of a stream comes from runoff from agriculture and other types of
human development. Dissolved solids are pollutants that are small enough to
pass through a filter; suspended solids, however, are caught by filters. Both
can contribute to constituents within a stream such as metals, nutrients,
pollutants and turbidity. !!
! The chart in Figure 15 shows the TSS and TDS within the water
samples taken from each site. The TSS and TDS as well as the other water
chemistry factors previously discussed contribute to the Total Maximum Daily
Load (TMDL) of the streams. The TMDL is the total amount of pollutants that
a stream can handle while still meeting water quality standards set by the
EPA. !
Total Suspended Solids (TSS)
Total Dissolved Solids (TDS)
!!
Summer
Mass.
Wetland
Winter
Summer
Winter
10
ND
Mass.
Wetland
110mg/L
1.3mg/L
Mass.
Benchmark
3
0.5
Mass.
Benchmark
105mg/L
1.1mg/L
Mass.
Rte
208
2
ND
Mass.
Rte
208
100mg/L
1.1mg/L
Mass.
Rte
1
10
ND
Mass.
Rte
1
90mg/L
1.3mg/L
Ni
Rte
208
5
ND
Ni
Rte
208
100mg/L
1mg/L
Ni
Rte
1
9
ND
Ni
Rte
1
110mg/L
1.1mg/L
Ni
McEwan
1
0.5
Ni
McEwan
170mg/L
1.2mg/L
Figure 15. The Total Suspended Solids (TSS) and Total Dissolved Solids (TDS) of all the sample
sites on the Ni River and Massaponax Creek for Summer, Fall and Winter samples. !
Fecal coliform levels in streams are influenced by factors such as sewage and
livestock. The EPA standard for Fecal Coliform states that a stream should not
have more than 235 CFUs. !
Figure 16. To the left
are the Colony Forming
Units from the Summer
sample. To the right is
a chart of the CFUs of
each site on the Ni
River and Massaponax
Creek for the Summer
and Winter !
The water chemistry results showed varying levels of pollution.
Compared to previous years, both the Ni River and Massaponax
Creek are now closer in health. All of the data sets, while not
necessarily dependent on each other, can be related with other
collected data sets. For example, as well as contributing to the
TMDL, the TSS and TDS of a stream can effect light penetration,
and therefore photosynthetic abilities. This can, along with water
temperature, affect the dissolved oxygen levels. !
! In general, the conductivity, temperature and dissolved
oxygen are similar at each sampling site. The Ni and Massaponax
have similar levels of Alkalinity and Total Hardness. !
! However, there are still inconsistencies. Figure 11 shows
higher amounts of Phosphate in Massaponax Creek at two
locations: Benchmark and Route 1. Because of its urban location,
Massaponax Creek has more impervious surfaces, and thus more
surface runoff, than the Ni River, which can result in the spikes of
Phosphate. There is also a spike in Alkalinity at Massaponax Route
208, which means it has a greater buffering capacity. !
!The levels of total hardness, pH and conductivity are high at
Ni River’s Route 1 sampling site. This is probably due to runoff from
weathering at a nearby quarry. However, these high readings do not
seem to affect the stream’s overall health since the location has a
relatively high %EPT of 90.5% and a FBI score of 4.09. !
! Testing for fecal coliform levels is also a very important step
towards determining stream health. Large spikes such as those at
Massaponax Rte. 1 and Ni 208 in Figure 13 can possibly be
indicators of a break in a nearby sewage line.
Proximity to
agricultural fields and livestock also play a roll. For example the
higher levels at McEwan can be attributed to the cow pasture that
the stream runs through. !
! Each of these chemical factors can act as stressors on the
macrobenthic community, causing fluctuations in %EPT or the FBI
value given to a stream. It is essential to look at both the diversity of
the streams and the number of each type of aquatic insect.
Massaponax Wetland, Benchmark and the Ni River’s Route 1 and
208 sites are all similar. However, Ni 208 and Ni Route 1 have more
diversity. This suggests that the Ni is generally healthier. However, at
McEwan Farm, the FBI, %EPT and diversity are all lower than the
other sites on the Ni and most sites on Massaponax. This is
probably because it is more embedded with sediment, as indicated
by Figure 13. !
! The Massaponax sites at Route 1 and 208 are also generally
lower in regards to %EPT and FBI values. Both of these sites are
located in areas of development, and are thus impacted by more
sediment and potentially more fertilizer runoff. !
!In conclusion, both streams are healthy. However, the Ni River
generally has areas that are surrounded by better quality habitat and
stronger riparian buffers. The results of the macrobenthic samples
and the water quality tests show which areas of the streams, such
as Route 208 on Massaponax and the McEwan farm on the Ni, need
improvement and consistent monitoring. !
References!
EPA (United States Environmental Protection Agency). November 1997. Volunteer
!Stream Monitoring: A Methods Manual. Office of Water, 1997, EPA 841!B97-003. !
EPA (United States Environmental Protection Agency). July 2006. Method 1603:
!Escherichia coli (E. coli) in Water by Membrane Filtration Using Modified
!membrane – Thermotolerant Escherichia coli Agar (Modified mTEC) !
Voshell, J. Reese Jr. 2002. A Guide to Common Freshwater Invertebrates of North
!America. Blacksburg, Virginia.!
Hauer, R.F., G. A, Lamberti. 1996. Methods in Stream Ecology, Academic Pres. !
Jordan, T. A. April 29, 2005. Ecological Damage Assessment of England Run and
!the Unnamed Tributary of Stafford County, VA. University of Mary
!Washington. !
Merrit, R.W., K.W. Cummins. 1996. An Introduction to the Aquatic Insects of North
!America, 3rd ed. Kendal Hunt Publishing Company, Iowa. !
!
Acknowledgments!
We give warm thanks to Dr. Michael Bass for sponsoring the project and
answering our numerous questions.