1. Biological Survey of EPT on Mormon Coulee Creek
Cale Carlin, Robert Gerszik
Dr. Roger Haro (Freshwater Invertebrate Zoology)
University of Wisconsin, La Crosse
Collection Data
References
Indicator species are collected in order to assess water quality of
water bodies. Ephemeroptera, Plecoptera, and Trichoptera are
three species that typically require stenotypic environmental
requirements that if disturbed, will result in a decrease in total
number of organisms residing there. If a stream is lacking EPT, this
could indicate the cumulative impacts of physical or chemical
changes occurring in the stream. These show possible habitat loss
not detected by normal water quality assessments (Ricker 1979).
As a result of this, they are commonly collected for biomonitoring
surveys. We collected EPT along different portions of the Mormon
Coulee Creek, located in La Crosse County Wisconsin. Assessing
how many of the target organisms were collected at these specific
locations along the creek, in proximity to the mouth and
headwaters, were used to interpret the water quality along
different portions of the creek. This data indicates a higher number
of EPT organisms will be trapped and collected further away from
the mouth, with the highest number being collected near the
headwaters.
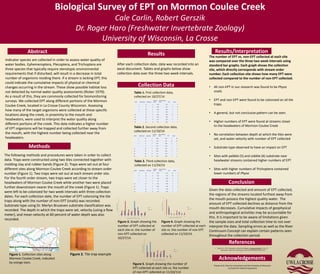
After each collection date, data was recorded into an
excel document. Tables and graphs below show
collection data over the three two week intervals.
The following methods and procedures were taken in order to collect
data. Traps were constructed using two tiles connected together with
molding clay and rubber bands (Figure 2). Traps were set out at four
different sites along Mormon Coulee Creek according to stream order
number (Figure 1). Two traps were set out at each stream order site.
For the fourth order stream, two traps were set closer to the
headwaters of Mormon Coulee Creek while another two were placed
further downstream nearer the mouth of the creek (Figure 1). Traps
were left to be colonized for two week intervals with three collection
dates. For each collection date, the number of EPT colonizing the tile
traps along with the number of non-EPT (snails) was recorded.
Substrate type using Dr. Merlyn Bruseven substrate classification was
recorded. The depth in which the traps were set, velocity (using a flow
meter), and mean velocity at 60 percent of water depth was also
recorded.
The number of EPT vs. non-EPT collected at each site
was compared over the three two week intervals using
standard bar graphs. Each graph shows the collection
site, which directly corresponds with stream order
number. Each collection site shows how many EPT were
collected compared to the number of non-EPT collected.
• All non-EPT in our research was found to be Physa
snails
• EPT and non-EPT were found to be colonized on all tile
traps.
• A general, but not conclusize pattern can be seen.
• Higher numbers of EPT were found at streams closer
to the headwaters of Mormon Coulee Creek
• No correlation between depth at which the tiles were
set, and water velocity with number of EPT collected
• Substrate type observed to have an impact on EPT
• Sites with pebble (5) and cobble (6) substrate near
headwater streams contained higher numbers of EPT
• Sites with higher numbers of Trichoptera contained
lower numbers of Physa
Given the data collected and amount of EPT collected,
the regions of the streams located furthest away from
the mouth possess the highest quality water. The
amount of EPT collected declines as distance from the
mouth decreases. Cumulative impacts of geophysical
and anthropological activities may be accountable for
this. It is important to be aware of limitations given
the sample sizes and total collection time to not over
interpret the data. Sampling errors as well as the River
Continuum Concept can explain certain patterns seen
throughout the collection period.
• Ricker, W. E. 1979. Plecoptera. In Ward and Whipple, Freshwater Biology 2nd ed., W. T.
Edmondson, editor John Wiley & Sons, New Tork and London. pp. 941-957
• .
Acknowledgements
Thanks to Dr. Haro for instructions and the University of Wisconsin-
La Crosse for research equipment.
Conclusion
Results/InterpretationResults
Methods
Abstract
Figure 1. Collection sites along
Mormon Coulee Creek, indicated
by orange stars.
Figure 2. Tile trap example
Order Depth (cm) Substrate
Velocity
(m/s)
Mean Velocity
(m/s) EPT Snails
2 12 6 0.08 0.16 0 28
2 10 6 0.19 0.31 16 12
3 6 5 0.31 0.39 3 1
3 9 5 0.26 0.28 1 2
4a 16 5 0.16 0.54 2 8
4a 15 5 0.33 0.46 5 5
4b 28 8 0.1 0.18 3 2
4b 25 8 0.12 0.26 2 4
Table 2. Second collection data,
collected on 11/10/14
Order Depth (cm) Substrate
Velocity
(m/s)
Mean Velocity
(m/s) EPT Snails
2 10 6 0.08 0.16 2 4
2 11 6 0.18 0.31 4 12
3 10 5 0.23 0.29 2 5
3 13 5 0.3 0.36 3 4
4a 14 5 0.16 0.54 12 6
4a 18 5 0.31 0.48 7 4
4b 23 8 0.12 0.18 2 2
4b 25 8 0.15 0.26 2 3
Table 1. First collection data,
collected on 10/27/14
Order Depth (cm) Substrate
Velocity
(m/s)
Mean Velocity
(m/s) EPT Snails
2 12 6 0.08 0.15 14 6
2 10 6 0.19 0.31 18 6
3 6 5 0.26 0.39 6 6
3 9 5 0.3 0.33 3 8
4a 16 5 0.15 0.48 4 7
4a 15 5 0.28 0.44 8 8
4b 28 8 0.1 0.18 2 1
4b 25 8 0.12 0.23 3 1
Table 3. Third collection data,
collected on 11/24/14
0
5
10
15
20
25
30
2 2 3 3 4a 4a 4b 4b
NumberCollected
Stream order (Collection site)
EPT
Non-EPT
Figure 4. Graph showing the
number of EPT collected at each
site vs. the number of non-EPT
collected on 11/10/14.
0
2
4
6
8
10
12
14
2 2 3 3 4a 4a 4b 4b
NumberCollected
Stream Order (Colelction site)
EPT
Non-EPT
Figure 3. Graph showing the
number of EPT collected at
each site vs. the number of
non-EPT collected on
10/27/14.
0
2
4
6
8
10
12
14
16
18
20
2 2 3 3 4a 4a 4b 4b
NumberCollected
Stream Order (Collection Site)
EPT
Non-EPT
Figure 5. Graph showing the number of
EPT collected at each site vs. the number
of non-EPT collected on 11/24/114
http://dnr.wi.gov/topic/fishing/documents/trout/trout
_maps/LaCrosse_color_landscape.pdf