Distribution of macrophytes in river narmada near water intake point
Assessing a marine biomonitor using invasive crabs and ammonia
1. Assessment of the Multispecies Freshwater BiomonitorÔ (MFB) in a marine
context: the Green crab (Carcinus maenas) as an early warning indicator
Sharon C. Stewart,*a
Jaimie T. A. Dick,a
Peter R. Laminga
and Almut Gerhardtb
Received 3rd December 2009, Accepted 7th June 2010
DOI: 10.1039/b925474a
The Multispecies Freshwater BiomonitorÔ is an online continuous biomonitor which utilises
impedance conversion to quantitatively record behavioural responses of vertebrates and invertebrates
to environmental change. Here, we extend the use of the MFB into the marine aquaculture environment
using the Green crab (Carcinus maenas) as a biological monitor. As a ubiquitous and abundant species,
C. maenas can be used in applications such as aquaculture and monitoring of diffuse and point source
marine pollution. Four experiments were undertaken to establish: (1) if the electrical field generated by
the apparatus had any effect on C. maenas; (2) if the behaviour of C. maenas was altered by the presence
of ammonia; (3) if the behaviour of C. maenas was affected by the electrical field when ammonia was
present and (4) if defined behaviours could be detected by the MFB. There was no significant effect of
the current on C. maenas in the MFB. There was a significant difference in overall expression of
behaviour in response to an increasing gradient of ammonia and activity of the chamber. Five
behaviours, ‘walking’, ‘climbing’, ‘leg stretch’, ‘cleaning’ and ‘inactivity’ were detected by the MFB.
C. maenas appears to be a suitable candidate for use in the MFB in a marine context. Further testing of
the biomonitor and C. maenas is required using other toxicants to establish alarm thresholds that could
be used in situ for water quality monitoring.
1. Introduction
Manual biomonitoring techniques can be subjective, time
consuming and laborious.1,2
As a result, various methods for
automating the process have been developed. For example, the
WRc (Water Research centre) has a fish monitor technique3
that
reduces subjectivity and allows long term online biomonitoring
using ventilation behaviour of fish as the response variable.
Biomonitors have been used based on a variety of methods,
including light beam disruption using invertebrates such as
Daphnia sp. and mussels.4,5
A recent development is the Multispecies Freshwater Bio-
monitorÔ (MFB), which is based on the quadropole impedance
conversion technique and is a novel biological early warning
system (BEWS) for online water quality biomonitoring.1,2,6,7
The
MFB is based on impedance conversion,6
with organisms placed
in flow-through chambers. Online biomonitors register the effects
of toxic pollutants on indicator species and therefore allow for
fast, continuous and relevant water quality control. BEWS
continuously registers sensitive stress responses (behaviour,
physiology) of selected indicator species in order to detect pollu-
tion pulses. The chambers have two pairs of electrodes, one pair is
currentcarrying (100 kHz) and the other pair senses the changes of
impedance caused by the movements of the organism, with the
different signals being attributed to different types of behav-
iours.7,8
The MFB quantitatively measures changes in the behav-
ioural pattern of both aquatic vertebrates and invertebrates.1,2,6,9
Biomonitors rely on rapid and sensitive changes in the
behaviour of the indicator species, often recorded as locomotion
and/or ventilation.25
A number of authors have explored the
preference or avoidance behaviour of organisms to various
toxicants or stimulants.10,11
Cherry and Cairns10
in 1982 discov-
ered that two contrasting situations were found: the first appears
to be a preference for the organism to enter into a lethal
concentration of a toxicant, while the second was where the
organism showed neither preference nor avoidance behaviour in
the presence of a toxicant. McNicol and Scherer11
in 1991 carried
a
School of Biological Sciences, Queen’s University Belfast, Medical
Biology Centre, 97 Lisburn Road, Belfast, BT9 7BL, Northern Ireland,
UK. E-mail: sharonstewart26@gmail.com; Tel: +44 (0)28 28272402
b
LimCo International, An der Aa 5, 49477 Ibbenbueren, Germany
Environmental impact
We describe a new marine biomonitoring system using large crabs in the Multispecies Freshwater BiomonitorÔ (MFB). Carcinus
maenas, native in Europe, impacts as invasive marine invertebrate fisheries and maricultures. Both as bait and for human
consumption the crab has been fished in Europe, hence being of high ecological and economical importance. The EU Marine
Strategy Directive demands a good environmental status for marine environments until 2021. The new biomonitoring system
represents an important tool, e.g. allowing online surveillance of the crab’s fitness as indicator in mariculture systems and along
polluted coasts. Extending the MFB to marine biomonitoring, using invasive, widely distributed species, which are also of economic
importance represents a new approach in applied ecotoxicological research and risk assessment.
1566 | J. Environ. Monit., 2010, 12, 1566–1574 This journal is ª The Royal Society of Chemistry 2010
PAPER www.rsc.org/jem | Journal of Environmental Monitoring
2. out a study on lake whitefish, Coregonus clupeaformis, and found
their reaction to various cadmium concentrations to be bimodal,
in that they reacted to low and high concentrations, but showed
little reaction to intermediate levels, with the fish showing both
preference and avoidance to the cadmium solution. These issues
need to be addressed in the development of the MFB in a marine
context.
In this study, therefore, our aim was to examine the merits and
suitability of a marine organism, the Green crab C. maenas, as
a potential new early warning system species in conjunction with
the MFB. C. maenas is a common and widely distributed crus-
tacean native to North West Europe.12
More recently, they have
been found on N. American coasts.12
They are found along all
British coasts, making them the most widespread of all British
crab species,13
and they can be found hiding under rocks or
buried in the sand during low tide. They are commercially
important species that are routinely collected and cultured for
Bait.14
They are also widely collected for human consumption in
many parts of mainland Europe and increasingly so in some
areas of Britain.14
As the worldwide demand for seafood
increases, aquaculture production has also increased to help meet
the demand.15
Aquaculture facilities are subjected to exogenous
and endogenous sources of pollution and these crabs could
potentially be used for BEWS in these systems. Ammonia is an
important toxicant in these conditions as it can build up in the
system from the excretion of the animals and can be brought into
the system with the water supply. We thus use ammonia in the
present study to examine the use of the MFB for marine aqua-
culture and water quality monitoring. The MFB has only been
used once before with a marine organism in sediment assays with
Corophium volutator.2
The aims of this study were to determine:
(1) does the Green crab (C. maenas) show preference or avoid-
ance behaviour in response to the current in the MFB chambers?
(2) Does the presence of ammonia (mg NH3N lÀ1
) have an effect
on the behaviour of the Green crab in MFB chambers? (3) Does
the MFB have an effect on the behaviour of the Green crab due
to the current passing through the chambers when ammonia is
present? (4) Can individual behaviours exhibited by the Green
crab be quantified and qualitatively assessed using the MFB
without continual direct observations in a control solution and
different concentrations of ammonia?
2. Materials and methods
2.1 Test species
C. maenas were collected from Ballyhenry Island (OS J680055),
Strangford Lough, Northern Ireland on several dates spanning
two weeks during June 2003. They were manually collected at
low tide from under rocks and in rock pools and were of
a uniform size (carapace width 3 cm (Æ0.6 cm)), males and
females were collected at a ratio of 50 : 50. Crabs were then
transferred to outdoor holding tanks with flow through systems
and aeration for 24 hours. The seawater was pumped from
Strangford Lough and through a filter before entering the tanks.
2.2 Toxicant
Ammonia can exist in two chemical forms and both are highly
soluble in water, with the non-toxic ammonium ions (NH4
+
)
predominantly in acidic (low pH) conditions and the highly toxic
unionized ammonia (NH3) (high pH).16
Together they are
referred to as ‘total ammonia’. In this study, ammonium chloride
(NH4Cl) solutions were formulated using UV filtered seawater.
Average pH and temperature were used to calculate the
proportion of unionised ammonia (mg NH3N lÀ1
) (Trussell,
1972).
2.3 The Multispecies Freshwater BiomonitorÔ
The test organisms were placed individually in a cylindrical flow-
through clear acrylic plastic test chamber with nylon nets (0.5 cm
mesh size) screwed on both ends. The chambers (17 cm in length
 6 cm in diameter) were attached to the MFB, and channel
information, noise level (40 mV) and frequency bands (Band 1,
0.5–4.0 Hz for locomotory activity and Band 2, 4.0–8.0 Hz for
ventilation and small movements) programmed prior to
recording. Recording occurred over 4 minute durations with 6
minute intervals between recording periods (see drawing of MFB
in Fig. 1a and b by Kirkpatrick et al. in 2006).1
2.4 Experimental setup
2.4.1 The quantification and qualification of individual
behaviours exhibited by the Green crab (C. maenas) using the
MFB. The direct observation of individual behaviour with the
MFB in a previous experiment enabled the MFB trace to be
characterised for each of the specific behaviours; ‘walking’,
‘climbing’, ‘leg stretch’, ‘cleaning’ and ‘inactivity’.
2.4.2 Preference/avoidance response to current passing
through the MFB chamber. Two MFB chambers were attached to
each other using an intermediate rubber tubing of 5 cm length.
The ends of the ‘‘dual chamber’’ were sealed using the mesh caps
provided. Each chamber that was part of the dual chamber was
then attached to the MFB. One crab was placed into the dual
chamber and the mesh end replaced. The chamber was then
lowered into a solution ensuring that all air bubbles were
removed and the crab was allowed for 15 minutes to acclimatise.
The ‘dual chamber’ was then placed into a 6 L tank which con-
tained 5 L of solution (see below) at pH 7.3 Æ 0.3 and 10.8
C Æ
0.2, then one randomly chosen chamber was activated for 7
minutes before the next chamber was activated and the first
chamber became inactive. The location of the crab was recorded
visually at 2, 6, 10 and 14 minutes. There were five experimental
dilution groups: (1) standard seawater; (2) 2.3 mg NH3N lÀ1
; (3)
6.9 mg NH3N lÀ1
; (4) 9.2 mg NH3N lÀ1
and (5) 11.5 mg NH3N lÀ1
.
These concentrations were chosen as they were above and below
the 96 hour LC50 (6.88 mg NH3N lÀ1
) for the crab.16
Forty
individuals were used in all the groups, i.e. 40 per treatment. The
animals used were placed in a chamber for 15 minutes before
recording to allow for acclimatising then after 24 hours, the same
forty individuals were used in experimental group 2, this was
repeated for experimental groups 3–5.
2.4.3 The effect of ammonia (mg NH3N lÀ1
) on the behaviour
of the Green crab (C. maenas) in MFB chambers. Individual
chambers were used for this test. A crab was placed into each
chamber and the chamber was then lowered into 5 L of solution
This journal is ª The Royal Society of Chemistry 2010 J. Environ. Monit., 2010, 12, 1566–1574 | 1567
3. (see above) in a 6 L tank and the crab was allowed for 15
minutes to acclimatise. Crab behaviour was visually recorded
using a Psion II hand-held computer (Psion PLC, London,
England), programmed using the Observer (4.0) package
(Noldus Information Technology, Wageningen, The Nether-
lands) for five predefined behavioural components: walking,
climbing, leg stretch, cleaning and inactivity, obtained from
qualitative observations17
for 15 minutes. This direct
observation of the individual behaviour enabled a determina-
tion of the effect of the ammonia whilst the crabs were in the
chambers, twenty crabs were observed for each experimental
group (as above).
2.4.4 The effect of the current passing through the chambers of
the MFB on the behaviour of the Green crab (C. maenas) when
ammonia is present. An individual crab was placed into each
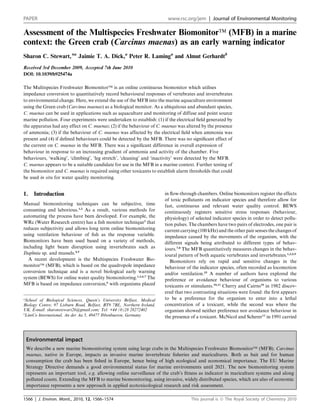
Fig. 1 MFB traces showing characteristic waveforms for C. maenas behaviours.
1568 | J. Environ. Monit., 2010, 12, 1566–1574 This journal is ª The Royal Society of Chemistry 2010
4. chamber which was then lowered into one of the solutions (see
above). Each 6 L tank contained two chambers with a crab in
each chamber; the crabs were allowed for 15 minutes to accli-
matise. The chambers were attached to the MFB and at random
one of the two chambers was activated. The behaviour of the
crabs was also recorded using the Psion II hand-held computer
(Psion PLC, London, England), programmed using the Observer
(4.0) package (Noldus Information Technology, Wageningen,
The Netherlands) for five predefined behavioural components,
walking, climbing, leg stretch, cleaning and inactivity, obtained
from qualitative observations17
for 15 minutes. Twenty crabs
were observed for each experimental group.
2.5 Statistical analyses
2.5.1 Preference/avoidance response to current passing
through the MFB chamber. The distribution of crabs between the
active/inactive chambers was assessed by Chi-squared analysis
(Statview version 5) (c2
). There were four tests (i.e. 2, 6, 10 and 14
minutes) undertaken on each dataset, so to avoid type 1 errors
(erroneous rejection of a true null hypothesis) we used the
Bonferroni adjustment, giving the level of significance as P
0.0125.18
2.5.2 The effect of ammonia (mg NH3N lÀ1
) on the behaviour
of the Green crab (C. maenas) in MFB chambers. The file created
on the Psion was downloaded onto the observer system (described
below). The data recorded on the Observer system were sum-
marised to produce a total duration for each of the behaviours
recorded for each crab over the study time (15 minutes). These
data were entered into Statview (version 5) and a one-factor
MANOVA (Multivariate Analysis of Variance) was undertaken
on the dependent variables (log10(x + 1) data), that is, ‘inactivity’,
‘walking’, ‘climbing’, ‘leg stretch’ and ‘cleaning’. The between
subject factor was concentration of ammonia (mg NH3N lÀ1
).1,2,9
2.5.3 The effect of the current passing through the chambers of
the MFB on the behaviour of the Green crab (C. maenas) when
ammonia is present. The data recorded on the Observer system
produced a total duration for each of the behaviours recorded for
each crab over the study time (15 minutes). These data were
entered into Statview (version 5) and a MANOVA (Multivariate
Analysis of Variance) was undertaken on the dependent vari-
ables (log10(x + 1)) for ‘no movement’, ‘walking’, ‘climbing’, and
‘leg stretch’. The between subject factors were the concentration
of ammonia (mg NH3N lÀ1
) and whether the chamber was active
or inactive. The MANOVA generates a 2-factor ANOVA, with
concentration and chamber activity as the between subject
factors for each separate behaviour.
3. Results
3.1 The quantification and qualitative assessment of individual
behaviours exhibited by the Green crab (C. maenas) using the MFB
‘Ventilation’ has an average frequency of 1.5 Hz (range 1–2 Hz).
‘Ventilation’ traces have regular peaks and troughs (Fig. 1a).
‘Ventilation’ is not always so distinctive from direct observation,
thus the time for ‘ventilation’ was considered to be the duration
when the organism was ‘inactive’, i.e., when the organism is
inactive the only behaviour that can be registered is ventilation.
‘Cleaning’ and ‘leg stretch’ have an average frequency of 3 Hz
(range 2.5–3.5 Hz) and have a very similar trace on the MFB,
which is characterised by small peaks with additional areas of
‘inactivity’ (Fig. 1b). Of all the behaviours, ‘walking’ and
‘climbing’ (Fig. 1c) have the greatest amplitude. ‘Walking’ has an
average frequency of 6.5 Hz (range 5.5–7.5 Hz) and ‘climbing’
has an average frequency of 4.5 Hz (range 4–5 Hz).
3.2 Preference/avoidance response to current passing through
the MFB chamber
The Chi-squared value for each time interval showed no signifi-
cant difference (Tables 1 and 2) except for 6.9 mg NH3N lÀ1
at the
14 minute interval (c2
¼ 8.1, df ¼ 1).
Overall, there was no significant effect on the behaviour of C.
maenas when the MFB is switched on, that is, there was neither
preference nor avoidance of a chamber with current passing
through it.
3.3 The effect of ammonia (mg NH3N lÀ1
) on the behaviour of
the Green crab (C. maenas) in MFB chambers
There was a significant difference in overall expression of
behaviour among the experimental dilution groups (PF20,176 ¼
3.04, P 0.0001, Fig. 2). The individual one factor ANOVA
results showed that there was a significant difference in time spent
‘walking’ among groups (F4,45 ¼ 3.8, P 0.01), although this
shows no discernible pattern with increasing concentration
(Fig. 2). Fisher’s PLSD showed significant differences between the
control and 2.3 mg NH3N lÀ1
; control and 9.2 mg NH3N lÀ1
; 2.3
mg NH3N lÀ1
and 6.9 mg NH3N lÀ1
; 2.3 mg NH3N lÀ1
and 11.5 mg
NH3N lÀ1
; 9.2 mg NH3N lÀ1
and 11.5 mg NH3N lÀ1
(Table 3).
‘Cleaning’ also showed a significant difference in time spent among
groups (F4,45 ¼ 12.2, P 0.0001) over the range of ammonia
concentrations (Fig. 2 and Table 3). The amount of time spent on
‘cleaning’ decreased with increasing ammonia (Fig. 2). Fisher’s
PLSD showed significant differences between the control and 6.9,
Table 1 c2
results for preference/avoidance experiment
Solution Time/min c2
df P Value
Control 2 0 1 NS
6 0.4 1 NS
10 0.4 1 NS
14 2.5 1 NS
2.3 mg NH3N lÀ1
2 1.6 1 NS
6 2.5 1 NS
10 3.6 1 NS
14 0.9 1 NS
6.9 mg NH3N lÀ1
2 1.6 1 NS
6 0.4 1 NS
10 0.1 1 NS
14 8.1 1 0.01
9.2 mg NH3N lÀ1
2 1.6 1 NS
6 0.9 1 NS
10 0.4 1 NS
14 1.6 1 NS
11.5 mg NH3N lÀ1
2 3.6 1 NS
6 2.5 1 NS
10 3.6 1 NS
14 6.4 1 NS
This journal is ª The Royal Society of Chemistry 2010 J. Environ. Monit., 2010, 12, 1566–1574 | 1569
5. 9.2, and 11.5 mg NH3N lÀ1
; 2.3 and 9.2 mg NH3N lÀ1
; 11.5 mg
NH3N lÀ1
and 6.9 and 11.5 mg NH3N lÀ1
(Table 3). The other
behaviours showed no overall significant difference over the
concentrations of ammonia, although Post hoc tests (Fisher’s
PLSD) carried out on ‘no movement’ and ‘climbing’ showed
significant differences between the control and 9.2 mg NH3N lÀ1
for ‘no movement’ and between 2.3 and 11.5 mg NH3N lÀ1
for
‘climbing’.
Table 2 Number of crabs (C. maenas, n ¼ 40) recorded as located at
consecutive time intervals (2, 6, 10 and 14 minutes), in an MFB chamber
when the MFB was ‘on’ compared with when the MFB was ‘off’ in
control (filtered seawater) and several concentrations of ammonia (mg
NH3N lÀ1
)
Time intervals
2 6 10 14
Control on 20 22 22 25
Control off 20 18 18 15
2.3 mg on 24 25 14 17
2.3 mg off 16 15 16 23
6.9 mg on 24 22 19 29
6.9 mg off 16 18 21 11
9.2 mg on 24 23 18 16
9.2 mg off 16 17 22 24
11.5 mg on 26 25 14 13
11.5 mg off 14 15 26 27
Fig. 2 Log mean time (ÆSE) spent on each behaviour with increasing concentrations of ammonia (mg NH3N lÀ1
).
Table 3 Fisher’s PLSD results for the effect of unionised ammonia
concentration (mg NH3N lÀ1
) on the behaviour of the Green crab (C.
maenas)
Behaviour Significant result Mean difference P Value
Inactive None, 9.2 mg À0.155 0.0322
Walking None, 2.3 mg 0.272 0.0029
None, 9.2 mg 0.228 0.0115
2.3 mg, 6.9 mg À0.202 0.0238
2.3 mg, 11.5 mg À0.221 0.0141
9.2 mg, 11.5 mg À0.177 0.0468
Climbing 2.3 mg, 11.5 mg À0.293 0.0350
Cleaning None, 6.9 mg 0.608 0.0006
None, 9.2 mg 0.892 0.0001
None, 11.5 mg 0.963 0.0001
2.3 mg, 9.2 mg 0.606 0.0006
2.3 mg, 11.5 mg 0.678 0.0002
6.9 mg, 11.5 mg 0.355 0.0367
1570 | J. Environ. Monit., 2010, 12, 1566–1574 This journal is ª The Royal Society of Chemistry 2010
6. 3.4 The effect of the current passing through the chambers of
the MFB on the behaviour of the Green crab (C. maenas) when
ammonia is present
The majority of time during the observations in the ammonia
solutions regardless of the MFB state (on/off) was spent ‘inac-
tive’ or on ‘leg stretch’ (Fig. 3a and b). There was a significant
difference in expression of behaviour among the experimental
dilution groups (PF16,760 ¼ 16.8, P 0.001) and activity of the
chambers (PF4,187 ¼ 5.06, P 0.001). There was also a significant
interaction effect between the presence of ammonia and the
activity of the chamber (PF16,760 ¼ 7.59, P 0.001).
The 2-factor ANOVAs showed significantly more time doing
nothing when ammonia was present as compared to the control
(F4,190 ¼ 289.7, P 0.001). There was a small difference between
the means for ‘no movement’ when the chamber was active (2.77)
compared with when the chamber was inactive (2.82). This may
explain the significant difference between the chamber being on
Fig. 3 Duration (+SE) spent per behaviour (in seconds as recorded by the Observer) in filtered seawater and four concentrations of ammonia (mg
NH3N lÀ1
) (n ¼ 20 per solution) when the MFB was switched (a) off and (b) on.
This journal is ª The Royal Society of Chemistry 2010 J. Environ. Monit., 2010, 12, 1566–1574 | 1571
7. and off even though it is not obvious from looking at the figures
(Fig. 3a and b). The Post Hoc test, Fisher’s PLSD, showed
significant differences between the control solution and 2.3, 6.9,
9.2 and 11.5 mg NH3N lÀ1
(Table 4). There was a significant
decrease in time spent ‘walking’ with increasing concentrations
of ammonia (F4,190 ¼ 62.5, P 0.001). However, the presence of
the current in the chamber had no significant effect. Post Hoc
tests, Fisher’s PLSD, showed significant differences between the
control solution and all the experimental dilutions, 2.3 and
9.2 mg NH3N lÀ1
, 6.9 and 9.2 mg NH3N lÀ1
and 9.2 and 11.5 mg
NH3N lÀ1
(Table 4). There was a significant decrease in time
spent ‘climbing’ over the range of experimental dilutions
(F4,190 ¼ 115.7, P 0.001) and the presence of the current had no
significant impact on the behaviour. The Post Hoc tests showed
significant differences between the same solutions as the results
for ‘walking’ (Table 4). There were significant decreases in time
spent on ‘leg stretch’ with increasing concentrations of ammonia
(F4,190 ¼ 65.7, P 0.0002). Post Hoc tests showed significant
differences between the control solution and 6.9 and 9.2 mg
NH3N lÀ1
, also 2.3 and 9.2 mg NH3N lÀ1
, 6.9 and 11.5 mg NH3N
lÀ1
, and 9.2 and 11.5 mg NH3N lÀ1
(Table 4).
Individual behaviours are affected to different extents, with
a general decline in behaviours with increasing ammonia
concentration, except for ‘no movement’.
4. Discussion
In this study, our aim was to examine the merits and suitability of
the Green crab, C. maenas, as a potential new ‘early warning
system’ species in conjunction with the MFB in a marine context.
The first experiment assessed if the monitoring system imposed
any restrictions on the test species’ normal behaviour. There was
no significant avoidance of, or attraction to, active/inactive test
chambers. This indicates that the current passing through the
chambers was not affecting the location of crabs in the chamber.
This has been observed before for other crustacean species1
and
fish.9
The addition of ammonia at different concentrations was to
determine if there was a behavioural change in response to
increasing concentrations of toxicant and the presence or absence
of the current. There was no preference for, or avoidance of,
a current passing through a chamber when ammonia is present.
The second experiment was designed to assess the effect that
the presence of ammonia had on the behaviour of the test crabs.
Total ammonia is usually measured in tests, however, the toxicity
is primarily attributable to the unionised form (NH3). Most
animals immediately convert the toxic ammonia to a less harmful
substance such as urea in fish which continually excrete meta-
bolic ammonia into the surrounding environment via cells in the
gills.19
In rivers, lakes and seas this is normally diluted to a safe
level, however, in aquaculture systems the levels can rise
dangerously.19
This rise in ammonia is also exacerbated by the
decomposition of fish food, fish waste and detritus left in the
cages or tanks. With increasing concentration of ammonia, there
was a significant difference in some of the behaviours (such as
walking and cleaning). In addition, ‘inactivity’, ‘climbing’ and
‘leg stretch’ did not change significantly with increasing ammonia
concentration. However, ‘inactivity’ did increase as the other
behaviours decreased, showing a causal relationship. Low levels
of ammonia act as an irritant to gills, prolonged exposure to sub-
lethal levels can cause skin and gill hyperplasia (this is where the
gill lamellae swell and thicken restricting the water flow over the
gills20
). At high levels even short exposure leads to skin, eye and
gill damage.20
It can also suppress the normal excretion of
ammonia causing ammonia poisoning which results in organ
damage and eventually death.20
The third experiment was designed to assess the effect of the
current passing through the chambers of the MFB on the
behaviour of the Green crab when ammonia was present.
Behaviours were significantly affected by the presence of
ammonia, but not by the electrical current. When examining the
traces formed by the MFB, there was oscillation even when the
crab was classified as being ‘inactive’. These oscillations are
caused by ventilation which is not easily manually observed, but
is picked up by the MFB.
Kirkpatrick (2006b)2
showed that the MFB could be used in
sediment toxicity assays with C. volutator as well as the fresh-
water Crangonyx pseudogracilis.1
The MFB has been used
successfully with a variety of freshwater crustacean and fish
species (e.g. Gammarus pulex,8,21
Macrobrachium nipponense,23
and fish:9
Daphnia magna and Gambusia holbrooki23
). During in
situ MFB tests in Sweden using G. pulex exposed to a copper
pulse, it was found that there was an overall increase in activity
which correlated with the changing copper concentration.8
Overall activity in this case involved significant increases in leg
movements, body stretches and ventilation, with response times
between 30 and 60 minutes occurring at sub-lethal concentra-
tions. During the current investigation, there were significant
increases in leg movement, and periods of inactivity (ventilation)
with increasing concentrations of ammonia. Gerhardt (1996)22
carried out another study using G. pulex and the MFB, and
found that it again reacted within 1 hour to a combination of
heavy metals and organic xenobiotics from a factory effluent.
Table 4 Fisher’s PLSD results for the effect of unionised ammonia
concentration (mg NH3N lÀ1
) on the behaviour of the Green crab (C.
maenas)
Behaviour Significant result Mean difference P Value
Inactive None, 2.3 mg À0.562 0.0001
None, 6.9 mg À0.542 0.0001
None, 9.2 mg À0.568 0.0001
None, 11.5 mg À0.581 0.0001
Walking None, 2.3 mg 1.376 0.0001
None, 6.9 mg 1.248 0.0001
None, 9.2 mg 1.7 0.0001
None, 11.5 mg 1.463 0.0001
2.3 mg, 9.2 mg 0.323 0.0074
6.9 mg, 9.2 mg 0.451 0.0002
9.2 mg, 11.5 mg À0.237 0.0485
Climbing None, 2.3 mg 2.098 0.0001
None, 6.9 mg 1.797 0.0001
None, 9.2 mg 2.131 0.0001
None, 11.5 2.103 0.0001
2.3 mg, 6.9 mg À0.302 0.0133
6.9 mg, 9.2 mg 0.334 0.0062
6.9 mg, 11.5 mg 0.306 0.0121
Leg stretch None, 6.9 mg À0.214 0.0036
None, 9.2 mg À0.264 0.0003
2.3 mg, 9.2 mg À0.174 0.0173
6.9 mg, 11.5 mg 0.217 0.0032
9.2 mg, 11.5 mg 0.267 0.0003
1572 | J. Environ. Monit., 2010, 12, 1566–1574 This journal is ª The Royal Society of Chemistry 2010
8. The initially high levels of activity decreased as the duration of
the exposure increased. The response variable in that study was
overall activity. In the same study, Hydropsyche angustipennis
showed increased locomotion, but only at night. It also showed
a decrease in ventilation, which has been suggested to be
a mechanism to try to delay exposure to toxicants until they had
passed downstream, a technique which has been suggested by
other authors for semi-sessile organisms.21
Ventilation has been
used as a response variable by many researchers.3
In fish, the
responses include gill purging (coughing), ventilatory frequency
and amplitude.24
Some authors only used ventilatory frequency
in their biomonitoring systems26,27
as frequency is easily moni-
tored and was the most sensitive indicator of fish health.
There are a number of advantages of the MFB over other
biomonitors, for example, it can record in sediment, cloudy,
turbid or coloured water samples or using pale coloured organ-
isms.8
Problems have been found when using pale coloured
organisms, especially with detection systems that utilise video
recordings. This was overcome by feeding organisms such as
Daphnia with a dark coloured food and by only using large
Daphnia in the investigation28
or even using fluorescent food. The
colour of the organisms, sample colour or time of day are irrel-
evant in the MFB as this system does not depend on visual
detection, but rather measures the change in impedance due to
changes in the electrical field.8
The MFB can also be utilised
without affecting the photoperiod to which the organism is
acclimitatised.28
Overall, BEWS can complement but not replace existing water
quality monitoring.29
The use of organisms enables the detection
of anything toxic or detrimental as the organisms react auto-
matically, whereas water quality monitors and toxicity tests can
only examine for the toxicant for which they are designed or
investigating. Field applied BEWS have two applications: (1) to
protect drinking water supplies by detecting toxicants within it
and (2) to protect the aquatic environment from the toxicants.29
The protection of aquatic ecosystem health is more reliable than
determining the effects to human health. Some studies have
shown that BEWS only detected levels of some chemicals, such as
cadmium, ammonia and zinc that were too high to protect
human health.29
For example, Morgan et al.30,31
carried out
a study on the guppy, Poecilia reticulate, and found that the
detection of chronically toxic levels of chemicals was poor.
Individual behaviours were characterised using the MFB and
this was fundamental in the investigations to assess the impact of
toxicants on specific behavioural components. For the Green
crab (C. maenas) there was a reduction in the number of
behavioural components recorded when compared with the
manual observations undertaken. This arose from the subjec-
tivity of the direct observations with the human eye able to
distinguish factors such as ‘cleaning’, and the objective
measurements taken by the automated technique. The MFB was
investigated as a relatively new biomonitor that is little used with
marine species. From an operational point of view, the system
was easy to set up, run and obtain information from. This
equipment would take little specialist knowledge to run once
installed as an online biomonitor system. Whilst the system was
only used with one test species in the present study, it would be
possible to use it with a variety of other marine species simul-
taneously, e.g. with a crab and benthic Corophium sp. The MFB
can be used in saltwater. It is a portable system and could be
installed on site for continuous monitoring. The MFB at present
requires further work, such as the remote access, e.g. in offshore
situations, before it is ready for sea cages and widespread marine
application, but could now be used to monitor water quality in
crustacean aquaculture and holding facilities.
5. Conclusions
The Green crab (C. maenas) appears to be a suitable candidate
for biological monitoring using the MFB in marine aquaculture
facilities.
Their behaviour is not adversely affected by the passage of the
current through the chambers.
Future widespread studies are required to assess sensitivity to
other toxicants and using multiple species to increase the sensi-
tivity of the MFB.
The MFB can be used in a marine setting but requires further
research on remote access operation so that it could be used in
sea cages, e.g. in offshore mariculture.
Acknowledgements
This research was funded by an ESF studentship award to
Sharon Stewart. Thanks to Arthur Stewart for assistance and to
Miriam Langer for photography.
References
1 A. J. Kirkpatrick, A. Gerhardt, J. T. A. Dick, P. Laming and
J. A. Berges, Suitability of Crangonyx pseudogracilis (Crustacea:
amphipoda) as an early warning indicator in the Multispecies
Freshwater Biomonitor, Environ. Sci. Pollut. Res., 2006, 13, 242–250.
2 A. J. Kirkpatrick, A. Gerhardt, J. T. A. Dick, M. McKenna and
J. A. Berges, Use of the Multispecies Freshwater Biomonitor to
assess behavioral changes of Corophium volutator (Pallas, 1766)
(Crustacea, Amphipoda) in response to toxicant exposure in
sediment, Ecotoxicol. Environ. Saf., 2006, 64, 298–303.
3 G. P. Evans and J. F. Wallwork, The WRc Fish Monitor and other
Biomonitor Methods, in Automated Biomonitoring: Living Sensors
as Environmental Monitors, ed. D. Gruber and J. Diamond, Ellis
Horwood Limited, Chichester, 1988, p. 7590.
4 W. T. Waller and J. Cairns, Use of fish movement patterns to monitor
zinc in water, Water Res., 1972, 6, 257.
5 K. J. M. Kramer and J. Botterweg, Aquatic Biological Early Warning
System: an Overview, in Bioindicators and Environment Management,
ed. D. W. Jeffrey and B. Madden, Academic Press, London, 1991, pp.
95–126.
6 A. Gerhardt, E. Svensson, M. Glostermann and B. Fridlund,
Monitoring of behaviour patterns of aquatic organisms with an
impedance conversion technique, Environ. Int., 1994, 20(2), 209–219.
7 A. Gerhardt, A New Multispecies Freshwater Biomonitor for
Ecologically Relevant Surveillance of Surface Waters, in
Biomonitors and Biomarkers as Indicators of Environmental Change,
ed. F. Butterworth et al., Kluywer-Plenum Press, 2000/1, vol. II,
508 pp, 301–317.
8 A. Gerhardt, A. Carlsson, C. Ressemann and K. P. Stich, New online
biomonitoring system for Gammarus pulex (L.) (Crustacea): in situ
test below a copper effluent in south Sweden, Environ. Sci. Technol.,
1998, 32, 150–156.
9 S. Craig and P. Laming, Behaviour of the 3 spined stickleback,
Gasterosteous aculeatus (Gasterosteidae, Teleostei) in the
Multispecies Freshwater Biomonitor: a validation of automated
recordings at 3 levels of ammonia pollution, Water Res., 2004, 38,
2144–2154.
10 D. S. Cherry and J. Cairns, Jr, Biological monitoring. Part V.
Preference and avoidance studies, Water Res., 1982, 16, 263–301.
This journal is ª The Royal Society of Chemistry 2010 J. Environ. Monit., 2010, 12, 1566–1574 | 1573
9. 11 R. E. McNicol and E. Scherer, Behavioural responses of lake
whitefish (Coregonus clupeaformis) to cadmium during preference
avoidance testing, Environ. Toxicol. Chem., 1991, 10, 225–234.
12 MarLIN, http:www.MarLIN.ac.uk, accessed 2003.
13 M. Cuculescu, D. Hyde and K. Bowler, Thermal tolerance of two
species of marine crab, Cancer pagurus and Carcinus maenas, J.
Therm. Biol., 1998, 23(2), 107–110.
14 UK MARINE SACs Project, www.ukmarinesac.org.uk, accessed
2002.
15 FAO (Food and Aquaculture Organisation of the United Nations),
The State of World Fisheries and Aquaculture 2000, FAO, Rome, 2001.
16 K. Emerson, R. C. Russo and R. E. Lund, Aqueous ammonia
equilibrium calculations—effect of pH and temperature, J. Fish.
Res. Board Can., 1975, 32, 2379–2383.
17 S. C. Stewart, The Development of Automated Biomonitors in the
Optimisation of Aquaculture Productions and Environmental
Protection, PhD thesis, The Queen’s University of Belfast, 2006
(unpublished).
18 R. Sokal and F. J. Rohlf, Biometry. The Principles and Practice of
Statistics in Biological Research, Freeman and Company, New
York, 3 edn, 1995, p. 871.
19 W. A. Wurts, Daily pH cycle and ammonia toxicity, J. World
Aquacult. Soc., 2003, 34(2), 20–21.
20 T. R. Martin, Effects of Water Quality on the Biology of Freshwater
Peracarids, University of Nottingham, Nottingham, 1986.
21 A. Gerhardt, Monitoring behavioural responses to metals in
Gammarus pulex (L.) with impedance conversion, Environ. Sci.
Pollut. Res., 1995, 2(1), 15–23.
22 A. Gerhardt, Behavioural early warning responses to polluted water -
performance of Gammarus pulex L. (Crustacea) and Hydropsyche
angustipenis (Curtis) (instecta) to a complex industrial effluent,
Environ. Sci. Pollut. Res., 1996, 3, 63–70.
23 A. Gerhardt, L. Janssens de Bisthoven, Z. Mo, C. Wang and
Z. Wang, Short-term responses of Oryzias latipes (Temminck
Schlegel, 1846) (Pisces) and Macrobrachium nipponense (De Haan,
1849) (Crustacea) to municipal and pharmaceutical waste water in
Beijing, China: survival, behaviour, biochemical biomarkers,
Chemosphere, 2002, 47(1), 35–47.
24 A. Gerhardt, L. Janssens de Bisthoven and A. M. V. M. Soares,
Evidence for the stepwise stress model: Gambusia holbrooki and
Daphnia magna under AMD and ACID stress, Environ. Sci.
Technol., 2005, 39(11), 4150–4158.
25 D. Gruber and J. Cairns, Jr, Data acquisition and evaluation in
biological monitoring systems, Hydrobiologia, 1981, 83, 387–393.
26 D. Gruber and J. Cairns, Jr, Industrial effluent monitoring
incorporating a recent automated fish biomonitor system, Water,
Air, Soil Pollut., 1981, 15, 471.
27 D. Gruber, J. Cairns, Jr and A. C. Hendricks, Computerised
biological monitoring demonstrating wastewater discharge
compliance, J. - Water Pollut. Control Fed., 1981, 53, 505–511.
28 E. H. Smith and H. C. Bailey, Development of a System for
Continuous Biomonitoring of a Domestic Water Source for Early
Warning of Contaminants, in Automated Biomonitoring: Living
Sensors as Environmental Monitors, ed. D. Gruber and J. Diamond,
Ellis Horwood Limited, Chichester, 1988, pp. 182–205.
29 W. H. Van der Schalie, Can Biological Monitoring Early Warning
Systems be Useful in Detecting Toxic Material in Water?, in
Aquatic Toxicology and Environmental Fate, ed. T. M. Poston and
R. Purdy, American Society for Testing and Materials,
Philadelphia, 1986, vol. 9, pp. 107–121.
30 W. S. G. Morgan, P. H. Kuhn, B. Allais and G. Wallis, An appraisal
of the performance of a continuous automatic fish biomonitoring
system at an industrial site, Water Sci. Technol., 1982, 14, 151–161.
31 E. L. Morgan, R. C. Young and C. M. Crane, Automated
Mulitspecies Biomonitoring Employing Fish and Aquatic
Invertebrates of Various Trophic Levels, in Freshwater Biological
Monitoring, ed. D. Pascoe and R. W. Edwards, Pergamon Press,
Oxford, 1984, pp. 75–80.
1574 | J. Environ. Monit., 2010, 12, 1566–1574 This journal is ª The Royal Society of Chemistry 2010