

Recommended
Recommended
More Related Content
What's hot
What's hot (20)
Similar to Distribution of virus aem00050 0269
Similar to Distribution of virus aem00050 0269 (20)
More from 528Hz TRUTH
More from 528Hz TRUTH (20)
Recently uploaded
Recently uploaded (20)
Distribution of virus aem00050 0269
- 1. Vol. 58, No. 9APPLIED AND ENVIRONMENTAL MICROBIOLOGY, Sept. 1992, p. 2965-2970 0099-2240/92/092965-06$02.00/0 Copyright ©) 1992, American Society for Microbiology Distribution of Viruses in the Chesapeake Bayt K. ERIC WOMMACK,1 RUSSELL T. HILL,1 MARTIN KESSEL,l ESTELLE RUSSEK-COHEN,2 AND RITA R. COLWELL'* Center ofMarine Biotechnology, University ofMaryland, 600 East Lombard Street, Baltimore, Maryland 21202,1 and Department ofAnimal Sciences, University ofMaryland, College Park, Maryland 207422 Received 2 March 1992/Accepted 7 July 1992 High virus counts were found in water samples collected from the Chesapeake Bay. Viruses were enumerated by ultracentrifugation ofwater samples onto grids which were visualized by transmission electron microscopy. Virus counts in September 1990, April 1991, June 1991, August 1991, and October 1991 ranged between 2.6 x 10⁶ and 1.4 x 10⁸ viruses ml-' with a mean of 2.5 x 10⁷ viruses ml-'. Virus counts were usually at least three times higher than direct bacterial counts in corresponding samples. Virus counts in August and October were significantly higher than at the other sampling times, whereas bacterial counts were significantly lower at that time, yielding mean virus-to-bacterium ratios of 12.6 and 25.6, respectively. From analysis ofmorphology of the virus particles, it is concluded that a large proportion of the viruses are bacteriophages. The high virus counts obtained in this study suggest that viruses may be an important factor affecting bacterial populations in the Chesapeake Bay, with implications for gene transfer in natural aquatic bacterial populations and release of genetically engineered microorganisms to estuarine and coastal environments. Viruses in natural waters have recently become a subject of renewed interest, owing to results of direct electron microscopic observations showing abundances of 103 to 108 viruses ml-' in marine waters (2, 16). The high viral counts reported within the last 2 years suggest that viral infection may be an important factor controlling bacterial populations in natural waters. The results of B0rsheim et al. (3) indicate this possibility, based on the demonstration of high viral proliferation rates in marine water samples. Also, the pres- ence of mature phage particles in marine bacteria and cyanobacteria has been directly demonstrated (16). There is, therefore, a growing body of evidence that viruses may have an important trophic role in aquatic ecosystems. The presence in seawater of viruses capable of infecting marine bacteria was demonstrated in 1955 by Spencer (19), whose findings were followed by isolations of bacterio- phages from marine sediment (18, 25) and shellfish (1). The structure of a marine bacteriophage was studied in detail by Valentine et al. (24), and parameters associated with repli- cation of two marine bacteriophages were reported by Chen et al. (6). Isolation of marine bacteriophages and their distribution have been reviewed by Moebus (14). The recent resurgence of interest in marine viruses is primarily a result of the large numbers of marine viruses reported to be present in natural waters. Enumeration of viruses in marine ecosys- tems has taken on special significance because of problems associated with pollution of the marine environment by ocean dumping of domestic and industrial wastes. High viral abundance in natural waters also has important implications for the release of genetically engineered microorganisms (7). Prior information on viral abundance, reviewed by Moebus (14), and the conclusion drawn by Wiggins and Alexander (26) that bacteriophages are unlikely to have any impact on bacteria in natural environments if concentrations of individ- ual bacterial populations are low were consistent with the prevailing view that the role ofviruses in exchange of genetic material in aquatic ecosystems was insignificant. However, * Corresponding author. t Contribution no. 194 from the Center of Marine Biotechnology. the high viral counts in freshwater and marine ecosystems that have been reported now strongly indicate that genetic transduction by bacteriophages may be very important in natural waters, notably in gene transfer between autochtho- nous bacteria and genetically engineered microorganisms released to the estuarine, coastal, and marine environments. The Chesapeake Bay is a well-characterized aquatic eco- system, where an understanding of factors affecting bacterial populations is critical to effective environmental manage- ment. Bacterial production rates (11) and the relationships between bacteria and organic carbon (10) and nitrogen (9) transformations have been well studied in the Chesapeake Bay. In addition to the role of heterotrophic bacteria in nutrient cycling and secondary production and the role of cyanobacteria in primary production, bacteria are consid- ered to be responsible for most of the oxygen consumption that results in destructive seasonal deep-water oxygen defi- cits (23). There have been no investigations on the effects of bacte- riophages on bacterial populations, and the abundance of viruses in the Chesapeake Bay has, heretofore, not been studied in detail. There is a single report of high virus numbers, 1.0 x 10⁷ virus particles ml-' (2), from a Chesa- peake Bay surface water sample. The objective of the study reported here was to investigate the presence of bacterio- phages in the Chesapeake Bay and their role in that ecosys- tem. Viruses could be an important and previously neglected factor controlling bacterial populations in the Chesapeake Bay. In addition, knowledge of the interactions between bacteriophages and bacteria in natural waters is essential to understanding the importance of transduction as a mecha- nism of exchange of genetic material in aquatic ecosystems and to evaluate the risks of genetic transduction of geneti- cally engineered microorganisms, a subject of extensive study in our laboratory. As a first step in elucidating the role of viruses in the Chesapeake Bay, the number of virus particles present in Chesapeake Bay water samples was determined. Also, vari- ations in virus counts related to sampling depth, degree of stratification of the water column, and season were deter- 2965
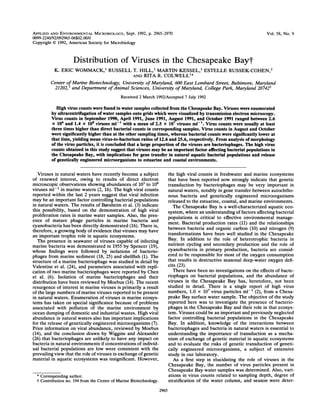
- 2. 2966 WOMMACK ET AL. FIG. 1. Locations of sample stations in Chesapeake Bay. mined. From this study, a relationship between viral and bacterial numbers was able to be determined. MATERIALS AND METHODS Sample collection. Water samples were collected on 19 September 1990, 4 April 1991, 1 June 1991, 10 August 1991, and 8 October 1991 at six stations along the midstem axis of the Chesapeake Bay at latitudes 39°08'N, 38°58'N, 38°45'N, 38018'N, 38°04'N, and 37056'N. These stations are desig- nated 908, 858, 845, 818, 804, and 756, respectively, and their locations are shown in Fig. 1. Water samples were collected 1 m below the surface and 1 m above the bottom at all stations, using 10-liter Niskin bottles attached to a General Oceanics rosette (General Oceanics, Miami, Fla.). In all cases, samples from the surface are designated T and sam- ples from the bottom are designated B. Water samples were fixed immediately after collection with glutaraldehyde (final concentration, 2%) for electron microscopy and formaldehyde (final concentration, 2%) for epifluorescence microscopy and stored at 4°C until process- ing. Vertical profiles of temperature, salinity, dissolved oxygen, and fluorescence were determined by using an EG&G Neal Brown NK III CTD system (EG&G, Calaumet, Mass.). Dissolved oxygen was measured with a Beckman polarographic oxygen probe (Beckman Instruments, Palo Alto, Calif.). Fluorescence and attenuation were measured with a SeaTech fluorometer and a 25-cm path length trans- missometer (SeaTech, Corvallis, Oreg.). These profiles es- tablished the presence or absence of stratification in the water column. Enumeration ofviruses. Viruses in the water samples were enumerated as described by B0rsheim et al. (3) and Bratbak et al. (5), with slight modification as follows. Viruses were collected by ultracentrifugation onto a 400-mesh, Formvar- coated Cu electron microscopy grid (Bio-Rad Microscience Division, Cambridge, Mass.). Ten ml of each fixed water sample was centrifuged at 100,000 x g for 2.5 h in a Beckman L8-80M ultracentrifuge in an SW 41 swing-out rotor (Beckman Instruments, Palo Alto, Calif.). Grids were stained for 2 to 3 min with 2% uranyl acetate. The grids were photographed at a magnification of x 14,000 and an acceler- ating voltage of 80 kV with a JEOL 100CX transmission electron microscope (JEOL USA Inc., Peabody, Mass.). Negatives of the photomicrographs were enlarged and printed to give a final magnification of x36,600. Viruses, enumerated on the enlarged prints, were identi- fied on the basis of size and shape. Grids were photographed randomly; however, in a few instances view fields were obstructed by large, amorphous, dark-staining material and were omitted. Five to 13 fields were counted for each sample. The number of viruses counted in each case ex- ceeded 200, except for samples 818, 845B, and 804B from 19 September 1990, in which the number of viruses counted exceeded 150. Enumeration of bacteria. Bacteria were counted by epi- fluorescence microscopy of acridine orange-stained prepara- tions by the method of Hobbie et al. (8). Formaldehyde-fixed water samples (1 ml) were mixed with 100 ,ul of 0.025% (wt/vol) acridine orange, held for 3 min, and filtered onto dyed 0.2-,um-pore-size filters (Poretics Corp., Livermore, Calif.). Acridine orange direct counts were done by using an Olympus AH-2 microscope at x 1,000 magnification (Olym- pus Optical Co. Ltd., Lake Success, N.Y.). Six fields, each containing 80 to 200 cells, were counted on each filter. In all cases, six counts were adequate to obtain a standard devia- tion within 15% of the mean. Statistical analysis. Log transformed viral and bacterial count data were analyzed by analysis of variance by using Statview II and Super ANOVA software packages (Abacus Concepts, Inc., Berkeley, Calif.). RESULTS Hydrographic conditions. The hydrographic data for each sampling station are presented in Fig. 2. The general trends found were as follows. During the September 1990, April 1991, and June 1991 cruises, the water column was notice- ably stratified with respect to salinity. In August 1991, the water column was similarly stratified by salinity for the three mid-bay sites. The three upper-bay sites in August and all sites in October 1991 showed little change in salinity through the water column. September and June results showed marked stratification in dissolved oxygen with nearly anoxic conditions near the APPL. ENVIRON. MICROBIOL.
- 3. DISTRIBUTION OF VIRUSES IN THE CHESAPEAKE BAY 2967 908 Salinity(PSU) i 13...Ir Oxygen(ml ) 6,5 1I TaUn. (C) 2 .5 3 g 8 20 30 Salinity(PSU) 5 3._. _& 2 Oxygenlm/I) 2 . . Temp. ('°C j 10- - 2 C. 20- 30J Salty (PSU)j 32. Oxygn (mL) . 6,5.S Temp. ('C) AO i .~10- 20- 30-J Salinity (PSU)j .j.. ,.. 32 Oxygenm(MI) 9 I1 Temp. (OC) S 3, ri g 10 X 2 2 20- 30- SalinTy (PSU) .. 32 Temip. ('C) ,S 2.5 4 10 g t20 30- 908 858 i . 1,3. 12 9 .. .65.S52 m.4....-~ 20( 20 30 30- 4 13 22 4 10 20- 30 . . . le . v p. .2?-... -A 10- 5 25 20- 858 3Oj 845 818 .3 . r~. ;2 X 6I5. It, 2.5. .O 10- 20 30I 205 845 30 .,. . Irl., 22 I 65. 1, ....6..... 5 10 20 30 1 5. R18 804 ; tr3 2I 6j5. ;2 j i 10- 20- t S s~~ 30j 10- 20- 30i 7S6 Ir,l . __226fi5 I . . Y. -.... 5. . .2. . 756 FIG. 2. Vertical profiles of salinity (*), dissolved oxygen (+), and temperature (A) of sampling stations in Chesapeake Bay. bottom. The reduction of dissolved oxygen with depth was less dramatic in April and August. Dissolved oxygen data were not available for the October 1991 cruise. Temperature stratification was widespread during September and June. In contrast, during April, August, and October, water temper- ature changed little with respect to depth. Viral distributions. The mean virus counts for the entire period of the study and for all stations ranged between 2.6 x 10⁶ and 1.4 x 10Tviruses ml-', with a mean of 2.5 x 10⁷ viruses ml-1 (7.1 x 10⁵ standard error). The virus count data are presented in Fig. 3. Statistical analysis of the virus count data showed that viral abundance varied only seasonally. Variability in viral abundance could not be attributed to either the water column or the sample site. Viral counts were greatest in August and October and lowest in April and September. Bacterial distributions. Direct bacterial counts ranged from 2.5 x 10⁵ to 1.4 x 10⁷ cells ml-' and are presented in Fig. 3. The overall mean of the mean bacterial counts was 3.1 x 10⁶ cells ml-1 (1.2 x 10⁵ standard error). Bacterial numbers during September 1990 and June 1991 samplings were at similar levels; however, both September and June counts were significantly greater than counts obtained during April 1991 (P < 0.05). April counts were greater than August 1991 VOL. 58, 1992 II'l. --.-F 5. ..IP y -1
- 4. 2968 WOMMACK ET AL. September 19, 1990 10- W-=l8 1 4 =L ._. I I il on908 858 845 818 804 756 April 4, 1991 11, iI[l June 1, .¢t 11 I n908 858 845 818 804 756 4, 908 858 845 818 804 756 ,1991 908 858 845 818 804 756 TABLE 1. VBR for each site and date of this study VBR for sample date Site Sept. 19, April 4, June 1, Aug. 10, Oct. 8, 1990 1991 1991 1991 1991 908T 3.9 10.9 3.4 17.8 9.0 908B 4.9 6.6 4.3 11.4 9.0 858T 3.6 10.3 2.3 11.2 14.4 858B 4.6 12.8 NDa 7.9 9.0 845T 1.2 2.4 3.6 11.8 12.5 845B 3.7 12.6 9.7 7.4 18.3 818T 0.6 5.3 3.5 20.6 11.7 818B 3.1 10.7 2.1 11.1 51.4 804T 1.9 8.6 7.1 11.9 47.8 804B 4.8 13.0 13.8 8.5 19.1 756T ND ND 10.2 22.3 41.0 756B ND ND 36.7 10.1 64.3 Total mean 3.2 9.2 8.8 12.6 25.6 VBR a ND, not determined. IL- !R b UH 1 October 7, 1991 4C- , 4 , .I anBe908s non 845 818 80W4 756°w t FIG. 3. Bacterial and viral abundances in water samples from Chesapeake Bay (N.D., not determined; U, top water sample; El, bottom water sample). Error bars represent standard errors. counts, and August counts were greater than October 1991 counts (P < 0.05). Samples from September 1990, June 1991, and August 1991 showed significantly greater bacterial counts in surface water samples than bottom water samples (P < 0.05). Bacterial counts from April 1991 and October 1991 showed no variation between surface and bottom water (P < 0.05). Bacteria were significantly more numerous at upper-bay stations during April, June, and October. Septem- ber and August samplings showed no site variation (P < 0.05). VBR. On each date, the ratio of mean virus count to mean bacterial count for each site was computed; these numbers are presented in Table 1 as the virus-to-bacterium ratios (VBRs). The VBRs for each sampling date were compared. The VBRs for September 1990, April 1991, and June 1991 were not statistically different (P < 0.05). The VBR ratio of 25.6 (5.7 standard error) during October 1991 was the highest ratio and was statistically greater than all the other sampling dates (P < 0.05). Morphology of viruses. Viruses were separated into three groups based on the diameter of the phage head: 30 nm and less, 30 to 60 nm; and 60 nm and greater. The most abundant size class was the 30- to 60-nm group. The percentages of viruses in each size group and percentages of tailed and nontailed viruses are given in Table 2. No distinction was made between bacteriophages and other viruses. Particles in the micrographs were counted as viruses on the basis of staining properties, size, and icosahedral morphology. DISCUSSION Early investigations of marine bacteriophages were depen- dent on the detection of plaque-forming units for the enu- meration of bacteriophages and, although numerous marine phage host systems were isolated during the 1960s and 1970s (see the work of Moebus [14] for a review), there were very few estimates of bacteriophage concentrations. Factors af- fecting marine bacteriophage replication and stability were examined by Chen et al. (6). Spencer (20) detected four phage strains in concentrations of between 0.1 and 10 PFU ml-1 in water from the North Sea. Torrella and Morita (22) presented the first semiquantitative evidence from electron microscopy for the high incidence of viral particles in TABLE 2. Size and morphology data of virus particles in Chesapeake Bay water samples Size class % of total % % Tailedcount' Nontailed <30 nm 4.5 77 23 30 to 60 nm 64.7 66 34 >60 nm 31.8 38 62 Total 100 57 43 a Total count = 33,086. 908 858 845 818 804 756 10) August 10. 1991 9L0 85LL908 858 845 818 804 756 APPL. ENVIRON. MICROBIOL. 1- .a .v 4:_
- 5. DISTRIBUTION OF VIRUSES IN THE CHESAPEAKE BAY 2969 seawater and indicated that the number of phage particles observed in their seawater samples was at least 104 ml-'. The presence of large numbers of viruses in a number of aquatic environments was confirmed a decade later (2, 16). Results of this study show that virus counts in the Ches- apeake Bay are consistently high and usually at least three times higher than total direct bacterial counts in correspond- ing samples. The virus particles observed by electron mi- croscopy were morphologically similar and grouped into size classes similar to those observed by Bergh et al. (2). Many of the viruses demonstrated polygonal heads with tail struc- tures typical of double-stranded DNA bacteriophages and were similar to the marine phage described by Valentine et al. (24). In the largest size category of viruses, where tails were most easily discernible, 62% of the viruses were tailed. Viruses with no discernible tail structure could be either bacteriophages that have lost their tails during the prepara- tion procedure, prior to electron microscopic visualization, or bacteriophages without tail structures, such as those in Bradley groups C, D, and E (4). It cannot be concluded, however, that all the virus parti- cles visualized are bacteriophages. Some of the viruses may have eukaryote hosts, such as phytoplankton, or represent human and animal viruses. Eukaryotic viruses in Chesa- peake Bay most probably represent a mixture of phytoplank- ton viruses, animal viruses (either of autochthonous origin or derived from agricultural waste), and human viruses, enter- ing Chesapeake Bay via domestic waste discharge, either directly or from tributaries. Suttle et al. (21) have shown that viruses which are pathogens of marine phytoplankton can be readily isolated from marine ecosystems. Phytoplankton densities during April 1991 were generally below 5 x 10³ cells ml-1, com- prising mainly dinoflagellates and flagellates (17). It is likely that some of the viruses present in the Chesapeake Bay infect phytoplankton, but because of the large numbers of viruses present relative to phytoplankton numbers and the morphology of these viruses, we conclude that the majority of these viruses are likely to be bacteriophages. Further enumeration of viruses, bacteria, and phytoplankton is being done to elucidate those virus-host relationships. It is interesting to speculate that bacteriophages were responsible, at least in part, for the lower direct bacterial counts measured during the April, August, and October cruises, i.e., coinciding with higher virus numbers. This relationship of lower bacterial counts and higher viral counts was observed during the spring (April), midsummer (Au- gust), and early fall (October), when changes associated with mixing of the water column are known to occur. Hydro- graphic data indicate that the water column was only slightly stratified on these cruise dates. Ogunseitan et al. (15) demonstrated establishment of an equilibrium between phage and bacteria in freshwater micro- cosm experiments with Pseudomonas aeruginosa as the host. It is possible that the equilibrium between viruses and bacteria fluctuates in response to changing seasonal condi- tions and the formation and breakdown of water column stratification. Equally likely is the possible relationship of viruses to blooms of planktonic bacterial species occurring in the late summer months, as observed for Vibioparahae- molyticus in Chesapeake Bay (12). Additional sampling is required to determine whether the increase in virus numbers observed in spring, midsummer, and early fall represents an annual cycle of abundance or transiently elevated counts. There were no significant differences in bacterial abun- dance within the water column, i.e., top versus bottom water, on the spring and early-fall sampling dates, whereas the late-spring and late-summer samplings (June and Sep- tember, respectively) showed appreciable water column differences in bacterial abundance, with surface counts being greater than subpycnocline counts. These data are in general agreement with the findings of Jonas and Tuttle for seasonal fluctuations in bacterial abundance (10). Virus counts did not vary with depth of collection or sample site, indicating that viral populations may not be as strongly affected as bacterial populations by changing water column conditions. Replicate counts of water samples from sites 818 and 804 on the April 1991 cruise demonstrate the difficulty of count- ing viruses in turbid estuarine water samples. Two separate transmission electron microscopy preparations of water samples 818T, 818B, 804T, and 804B were counted. The means of these counts were compared by using the Fisher's protected least-significant-difference technique. Three pairs were identical (P < 0.05) (818B, 818T, and 804T), and one (818B) was significantly different (P < 0.01). We are inves- tigating various modifications of the method used in this study to obtain consistency in virus counts from water samples containing significant amounts ofparticulate matter, e.g., cellular debris and silt. We are presently unable to obtain reliable virus counts in samples collected from the northern reaches of Chesapeake Bay, near the mouth of the Susquehanna River, because of the silt content of this water. The large numbers of viruses and the indication of sea- sonal changes in virus numbers suggest that viruses may, indeed, be an important trophic factor in Chesapeake Bay. Microcosm studies by Kokjohn et al. (13), employing envi- ronmental isolates ofPseudomonas aeruginosa, have shown that efficient attachment and replication of bacteriophages are possible at host densities as low as 102 culturable cells ml- and phage concentrations of 102 ml-l. Such concen- trations should be exceeded for many naturally occurring phage host systems in Chesapeake Bay, given the consis- tently large numbers of bacteria and phage found to be present in Chesapeake Bay water samples collected during different times of the year. There is no question but that the revitalized interest in viruses in the marine environment triggered by recent reports in the literature (3) will engender fascinating new discoveries about these microorganisms in the near future. ACKNOWLEDGMENTS The crews of the R/V Ridgely Warfield and R/V Cape Henlopen provided valuable assistance during sampling cruises. This work was supported by Office of Naval Research URI grant N00014-86-K-0696, Cooperative Agreement no. CR 817791-01 be- tween the Environmental Protection Agency and the University of Maryland, and Maryland Sea Grant Program Development Fund grant RP75PD. REFERENCES 1. Baross, J. A., J. Liston, and R. Y. Morita. 1978. Incidence of Vibrioparahaemolyticus bacteriophages and other Vibiio bac- teriophages in marine samples. Appl. Environ. Microbiol. 36: 492-499. 2. Bergh, 0., K. Y. B0rsheim, G. Bratbak, and M. Heldal. 1989. High abundance of viruses found in aquatic environments. Nature (London) 340:467-468. 3. Borsheim, K. Y., G. Bratbak, and M. Heldal. 1990. Enumeration and biomass estimation of planktonic bacteria and viruses by transmission electron microscopy. Appl. Environ. Microbiol. 56:352-356. 4. Bradley, D. E. 1967. Ultrastructure of bacteriophages and bacteriocins. Bacteriol. Rev. 31:230-314. VOL. 58, 1992
- 6. 2970 WOMMACK ET AL. 5. Bratbak, G., M. Heldal, S. Norland, and T. F. Thingstad. 1990. Viruses as partners in spring bloom microbial trophodynamics. Appl. Environ. Microbiol. 56:1400-1405. 6. Chen, P. K., R. V. Citarella, 0. Salazar, and R. R. Colwell. 1966. Properties of two marine bacteriophages. J. Bacteriol. 91:1136- 1139. 7. Colwell, R. R., and D. J. Grimes. 1985. Genetic modification of microorganisms occurring in the natural environment. Proc. American Society for Testing and Materials, Philadelphia, 15 April 1985. 8. Hobbie, J. E., R. J. Daley, and S. Jasper. 1977. Use of Nuclepore filters for counting bacteria by fluorescence micros- copy. Appl. Environ. Microbiol. 33:1225-1228. 9. Horrigan, S. G., J. P. Montoya, J. L. Nevins, J. J. McCarthy, H. Ducklow, R. Goericke, and T. Malone. 1990. Nitrogenous nutri- ent transformations in the spring and fall in the Chesapeake Bay. Estuarine Coastal Shelf Sci. 30:369-391. 10. Jonas, R. B., and J. H. Tuttle. 1990. Bacterioplankton and organic carbon dynamics in the lower mesohaline Chesapeake Bay. Appl. Environ. Microbiol. 56:747-757. 11. Jonas, R. B., J. H. Tuttle, D. L. Stoner, and H. W. Ducklow. 1988. Dual-label radioisotope method for simultaneously mea- suring bacterial production and metabolism in natural waters. Appl. Environ. Microbiol. 54:791-798. 12. Kaneko, T., and R. R. Colwell. 1978. The annual cycle of Vibrio parahaemolyticus in Chesapeake Bay. Microb. Ecol. 4:135-155. 13. Kokjohn, T. A., G. S. Sayler, and R. V. Miller. 1991. Attach- ment and replication of Pseudomonas aeruginosa bacterio- phages under conditions simulating aquatic environments. J. Gen. Microbiol. 137:661-666. 14. Moebus, K. 1987. Ecology of marine bacteriophages, p. 136- 156. In S. M. Goyal, C. P. Gerba, and G. Bitton (ed.), Phage ecology. John Wiley & Sons, Inc., New York. 15. Ogunseitan, 0. A., G. S. Sayler, and R. V. Miller. 1990. Dynamic interactions of Pseudomonas aeruginosa and bacteri- ophages in lake water. Microb. Ecol. 19:171-185. 16. Proctor, L. M., and J. A. Fuhrman. 1990. Viral mortality of marine bacteria and cyanobacteria. Nature (London) 343:60-62. 17. Sellner, K. (Benedict Estuarine Research Laboratory). 1991. Personal communication. 18. Sklarow, S. S., R. R. Colwell, G. B. Chapman, and S. F. Zane. 1973. Characterization of a Vibrio parahaemolyticus bacterio- phage isolated from Atlantic coastal sediments. Can. J. Micro- biol. 19:1519-1520. 19. Spencer, R. 1955. A marine bacteriophage. Nature (London) 175:690. 20. Spencer, R. 1960. Indigenous marine bacteriophages. J. Bacte- riol. 79:614. 21. Suttle, C. A., A. M. Chan, and M. T. Cottrell. 1991. Infection of phytoplankton by viruses and reduction of primary productiv- ity. Nature (London) 347:467-469. 22. Torrella, F., and R. Y. Morita. 1979. Evidence by electron micrographs for a high incidence of bacteriophage particles in the waters of Yaquina Bay, Oregon: ecological and taxonomical implications. Appl. Environ. Microbiol. 37:774-778. 23. Tuttle, J. H., R. B. Jonas, and T. C. Malone. 1987. Origin, development and significance of Chesapeake Bay anoxia, p. 442-472. In S. K. Majumdar, L. W. Hall, Jr., and H. M. Austin (ed.), Contaminant problems and management of living Chesa- peake Bay resources. Pennsylvania Academy of Sciences Press, Philadelphia. 24. Valentine, A. F., P. K. Chen, R. R. Colwell, and G. B. Chapman. 1966. Structure of a marine bacteriophage as revealed by the negative-staining technique. J. Bacteriol. 91:819-822. 25. Wiebe, W. J., and J. Liston. 1968. Isolation and characterization of a marine bacteriophage. Mar. Biol. 1:244-249. 26. Wiggins, B. A., and M. Alexander. 1985. Minimum bacterial density for bacteriophage replication: implications for signifi- cance of bacteriophages in natural ecosystems. Appl. Environ. Microbiol. 49:19-23. APPL. ENVIRON. MICROBIOL.