
Recommended
More Related Content
What's hot
What's hot (20)
Viewers also liked
Viewers also liked (13)
Similar to Seasonal Variation of Microbial Communities in Fraser River Sediments
Similar to Seasonal Variation of Microbial Communities in Fraser River Sediments (20)
Seasonal Variation of Microbial Communities in Fraser River Sediments
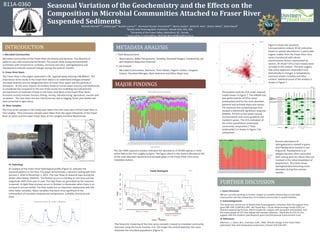
- 1. Seasonal Variation of the Geochemistry and the Effects on the Composition in Microbial Communities Attached to Fraser River Suspended SedimentsMichelle Bennett*a,b , Audrey Eppa,b Rosalie Luymesa,b , Bernhard Peucker-Ehrenbrinka,b , Marco Coolena , Britta M. Vossa , Sharon Gilliesb , Steve Marshb a Woods Hole Oceanographic Institution, Woods Hole, MA, USA b University of the Fraser Valley, Abbotsford, BC, Canada * Lead author. E-mail address: Michelle.Bennett@student.ufv.ca INTRODUCTION I. Microbial Communities Microbial communities of the Fraser River are diverse and dynamic. The diversity of patterns vary with environmental factors. The results show strong environmental correlation with temperature, turbidity, ammonia and silica. Sphingobacteria and Flavobacteria indicate seasonal changes during the summer months. II. Fraser River Basin The Fraser River is the largest watershed in BC, approximately draining 248,000km². The importance of the study in the Fraser River Basin is to understand linkages between microbial diversity and the biogeochemistry of Fraser River water and the particles it transports. At this time, impacts of incident threat to human water security and biodiversity is considered low compared to the rest of the world, but modelling has indicated the encroachment of moderate threats to the lower East-West of the Fraser River Basin. Economic activity includes forestry, fishing, mining, manufacturing, agriculture, tourism and recreation. The river basin has also had forest loss due to logging, forest pine beetle and land converted to agriculture. III. River Samples The time series samples in this study were taken from the main stem of the Fraser River in Fort Langley. Time and space samples were taken from the upper tributaries of the Fraser River at Lytton and the lower Fraser River at Fort Langley and New Westminster. IV. Hydrology An analysis of the Fraser River hydrological profile (Figure 3), indicates the seasonal patterns in the flow. The graph demonstrates a dynamic hydrograph from January 1, 2010 to November 1, 2013. The river flows at seasonal lows during the winter often below 1000m³/s. The freshet occurs in mid May to mid June and the magnitude shifts from year to year. The high flows are generated by the seasonal snowmelt. A slight flow increase occurs in October to November when there is an increase in annual rainfall. The flow model has an important relationship with the other water variables. Water variables that were most significant to the communities of microbes analyzed was temperature, turbidity, ammonia and silica. METADATA ANALYSIS I. Field Measurements • Observations, Water Temperature, Turbidity, Dissolved Oxygen, Conductivity, pH and Oxidation Reduction Potential. II. Lab Analysis • Microbial Communities, Nutrients, Trace Metals, Organic Carbon, Inorganic Carbon, Dissolved Nitrogen, Bank Sediment and Other Major Ions. . MAJOR FINDINGS FURTHER DISCUSSION I. Future Directions We are currently working on further insights on variable relationships to microbial communities and the comparison of microbial communities in spatial habitats. II. Acknowledgements This study was carried out at Woods Hole Oceanographic Institution with the support from grant NSF-EAR 1226818 to BPE. We Thank Roy J. Carver Biotechnology Center (CBC) for Illumina sequencing services, Marco Coolen for support with extraction and analysis, and the many people at UFV that helped with sample collection. Thank-you to UFV for the support with the Student Lead Research grant and Educational Enhancement Fund. III. References Morrison, J., Quick, M.C., Foreman, G.M., 2002. Climate change in the Fraser River watershed: flow and temperature projections. Elsevier 263:230-244. J. Morrison et al. / Journal of Hydrology Bacteria Affected by Environmental Factors PercentAbundanceofMostDominatePhylaGroup Sample Identification The 16s rDNA sequence analysis indicated the abundance of 39,000 species in time series data at the Fort Langley location. The figure above is the relative abundance (%) of the most abundant bacterial and archaeal phyla in the Fraser River time series metadata analysis. The hierarchic clustering of the time series samples is based on microbial community structure using the hclust function in R. The longer the vertical branches the more dissimilar the microbial populations (Figure 5). Figure 6 shows the canonical correspondence analysis (CCA) ordination based on species abundances in particulate organic matter from the Fraser River time series (numbered) with abiotic environmental factors represented by vectors. All 39,027 OTUs (red crosses) were included in the analysis. The data suggest that many organisms responded most dramatically to changes in temperature, ammonia and/or turbidity and silica content. Statistical proof of the analysis is shown in Figure 7. Permutation tests for CCA under reduced model shown in Figure 7. The ANOVA test was performed for all OTUs (total prokaryotes) and for the most abundant bacterial and archaeal phyla and classes. The bacterial and archaeal groups that showed a statistically significant response (ANOVA, P<0.05) to the tested natural environmental time series gradients are marked in green. The CCA ordination of the entire quantitative prokaryotic community composition (“Total prokaryotes”) is shown in Figure 7 for comparison. Figure 1 Figure 2 Fort Langley Location (Photo by Michelle Bennett) Figure 3 Figure 4 Figure 5 Figure 6 Figure 7 Figure 8 Percent abundance of Sphingobacteria marked in green and Flavobacteria marked in red (Figure 8). Flavobacteria is an obligate bacteria often associated with sinking particles where they are involved in the initial breakdown of biopolymers. The trend shows Sphingobacteria becoming more abundant during the summer months. B11A-0360 DISCHARGE(m³/s)