SlideShare a Scribd company logo
1 of 55
Homework Help
https://www.homeworkping.com/
Research Paper help
https://www.homeworkping.com/
Online Tutoring
https://www.homeworkping.com/
click here for freelancing tutoring sites
EE2 Semiconductor Devices
Switching of bipolar devices
10 lectures – 5 classes
Dr. K. Fobelets
k.fobelets@imperial.ac.uk
Taken from
www.necel.com/process/en/ux6b_90nm_bicmos.html
1 EE2 - Semiconductor Devices 2012
The course aims:
(1) To review the operation of diodes and bipolar junction transistors.
(2) To extend knowledge on bipolar devices to include the influence of recombination.
(3) To investigate the physical mechanisms underlying the delays and speed limitations of the devices.
(4) To extract equivalent circuit models for the devices.
Objectives:
Students should be able to
(1) Explain qualitatively the mechanisms of electronic conduction in bipolar devices, and calculate relevant
quantities from given data.
(2) Calculate and explain DC current-voltage behaviour of diodes and BJTs, given their geometry and
material properties.
(3) Explain the influence of excess minority carrier recombination of the performance of the devices.
(4) Explain the large signal behaviour of the devices from the internal storage of charge.
Recommended textbooks
EE1 background knowledge on semiconductors and semiconductor devices is required. The EE1 course
notes can be found on blackboard.
It is strongly recommended that you read these notes in order to understand the basic principles of
semiconductor devices.
“Solid State Electronic Devices”, B.G. Streetman & S. K. Banerjee, Prentice Hall International Editions, 6th
ed. This is a more expensive book but the course is based on this book. It contains a lot more than what is
taught in the 1st and 2nd year.
“Microelectronic Devices”, K.D. Leaver, IC Press, 2nd ed. This is a compact and relatively inexpensive
book which covers all the essentials.
Note that in popular books such as “Microelectronics circuits” by Sedra & Smith some very brief
descriptions of semiconductor device operation can be found. Whilst previous two books are very physics
oriented, this book is more oriented towards the circuit engineer and thus might give additional insight.
There are plenty of copies available of all these books in the Central Library.
An interesting on-line text books can be found on:
http://ecee.colorado.edu/~bart/book/book/contents.htm
http://www.ecse.rpi.edu/~schubert/Course-ECSE-2210-Microelectronics-Technology-2010/
Course synopsis
2 EE2 - Semiconductor Devices 2012
1. Revision on semiconductor devices
Last year you studied the DC behaviour of metal-semiconductor, metal-oxide-semiconductor and
semiconductor-semiconductor junctions. We looked at the simplified version of three devices: the pn
junction, the MOSFET and the BJT. We will start the course with reviewing the basic device DC operation
concepts of the pn diode and the BJT because this year we will focus on bipolar devices. For more extensive
information on MOSFETs please see the 3rd year Advanced Electronics Devices course1.
2. Long pn diode
In contrast to the “short” devices we’ve studied in the first year, this year we will introduce recombination
processes and check how they influence device behaviour. These devices will be referred to as “long”
devices.
Although an important characteristic of semiconductor devices is their fast response time, some delays do
occur. We will investigate the physics behind the delays and investigate the resulting switching
characteristics. The concept of a fast switching majority carrier device and a “slowly” switching minority
carrier device will be made clear.
3. The BJT
An npn or pnp junction is the basis for the bipolar junction transistor (BJT). Based on our knowledge of pn
junctions, the DC functioning of a BJT will be described. As in pn junctions, minority carriers will play an
important role in the conduction mechanism of the BJT. We will look explicitly at the short BJT and
discover that calculating the currents in this particular configuration is very straightforward. The BJT in
which recombination is taken into account offers some challenging maths but gives an insight into delays
and current gain. Switching of the BJT will also be studied and methods to reduce the delay discussed.
Why study semiconductor devices?
There can be lots of reasons to study devices. It can be as simple as being interested in the physics behind the
devices’ operation or it can give you the background to understand the aggressive downscaling effort of the
CMOS industry and maybe in the future you can join in the effort. Having knowledge of the operation of
devices will enable you to understand both device and circuit modelling programs better and thus make
modelling and the resulting circuits more efficient.
Although the speed of the aggressively downscaled MOSFET2 has removed the need for bipolar transistors
from logic circuits, microprocessors and memory chip, there are still some fields in which bipolar transistors
remain important. These applications mainly need ultra-high speed in which minimizing power consumption
is not so important. Examples are emitter coupled logic, power switching, microwave power amplifiers, cell
phone amplifiers etc.
This course fills the semiconductor knowledge gap between the 1st
year Semiconductor Devices course and
the 3rd
year Advanced Electronics Devices course as it focuses more on bipolar devices than these other two
courses. Knowledge of bipolar transistors is also important for courses such as Microwave Technology, Radio
Frequency Electronics, Power Electronics, High Performance Analogue Electronics and Analogue Integrated
Circuits and Systems.
1 On blackboard
2 See the yr3 Advanced Electronics Devices course
3 EE2 - Semiconductor Devices 2012
1 Semiconductors and junctions – a review
1.1 A semiconductor
• A semiconductor is a material that, at room temperature, has a conduction character that is lower than
metals but higher than insulators. This is because a semiconductor always has at least an intrinsic
carrier concentration: ni.
• There exist two types of charged carriers in a semiconductor that can both carry current: the electrons
with a negative charge and the holes with a positive charge: eVCeq 1106.1 19
±=±=±= −
. Only
“free” charges can carry currents. “Free” means not bonded to the atoms.
• The conduction in a semiconductor can be changed via doping. Doping is the introduction of foreign
atoms such as B or As in Si. Doping with donors: ND (donor concentration) gives an n-type
semiconductor. Thus the density of free electrons nn is larger than the density of free holes pn in an n-
type material. Doping with acceptors: NA (acceptor concentration) gives a p-type material. The
density of free holes pp is larger than the density of free electrons np
3.
Important formulae that govern the conductivity of a semiconductor are:
The intrinsic carrier concentration: ii pn =
(same density of free electrons and holes in an intrinsic semiconductor).
The extrinsic n-type semiconductor:





=
=
D
i
n
Dn
N
n
p
Nn
2
The extrinsic p-type semiconductor





=
=
Ap
A
i
p
Np
N
n
n
2
With n, p respectively the electron and hole density ; ND,A respectively the donor and acceptor doping density
(concentration).
The total conductivity of a semiconductor is: ( )pntot pne µµσ +=
With µn, µp the mobility of electrons, resp. holes. The value of the mobility is a function of the scattering
processes and the effective mass of the carriers:
m
qτ
µ = , with q the charge, τ the average time between
collisions (scattering), m the mass. Thus the hole and electron mobility are not necessarily the same. The
mobility gives an indication into how fast a device will work (when parasitic influences are negligible). The
mobility is the proportionality constant in the drift velocity-electric field relationship for small values of
electric field: Ev µ= , with v the drift velocity and E the electric field. Electrons and holes have opposite
velocities.
* Drift currents
In a homogeneously doped semiconductor or a semiconductor with a constant carrier density, applying an
electric field will cause drift currents to flow. Drift current can be carried by both electrons and holes.
Drift current in a semiconductor is given by: ( )EpneAAEI pntottot µµσ +==
With A the cross sectional area perpendicular to the current flow, E is the applied electric field. Remember
that the electric field can also be internal to the device structure.
* Diffusion currents
When carrier gradients exist in a semiconductor, diffusion currents will occur. Hole density gradients cause
3 The subscript indicates the material type. n is the symbol for electron concentration, p for the hole concentration. Units are cm-3.
4 EE2 - Semiconductor Devices 2012
hole diffusion currents, electron density gradients cause electron diffusion currents and gradients in both
carrier types will cause diffusion of both, creating a total diffusion current of4:






−=
dx
dp
D
dx
dn
DeAI pntot
With Dn,p the diffusion constant of electrons respectively holes, x is the direction of carrier propagation. The
Einstein equation gives the relationship between the diffusion constant and the mobility of the carrier:
e
kTD
=
µ
with, k the Boltzman constant, T the temperature in Kelvin.
* In the general case where both concentration gradients and electric fields are present the total current is the
sum of both drift and diffusion currents:






−++=
dx
dp
D
dx
dn
DEpEneAI pnpntot µµ
This equation is normally referred to as the drift-diffusion equation of carriers and is the basic equation that
describes carrier movement in semiconductor devices.
E(x) Jn
drift
Jp
drift
n(x)
Jn
diff
p(x) Jp
diff
Figure 1: the direction of the current densities as a function of the electric field and the carrier gradient.
Note that the direction of the electron particle flux is opposite to the current flow. Particle flux is strictly
governed by electrostatics, the current is dependent on the sign of the charge q=±e.
The third important basic equation in semiconductor devices is the Poisson equation5:
( )−+
−+−−=−= AD NNnp
ex
dx
Vd
εε
ρ )(
2
2
With V the electrostatic potential, ρ the charge density as a function of x ; p & n the free hole, resp. electron
density which are both a function of x as well as of V and −+
AD NN & the concentration of ionised doping
atoms which are a function of x.
1.2 Energy band diagrams
The carriers in a semiconductor are quasi free because they are no longer covalently bonded to the atoms and
thus can move but at the same time they undergo interactions with the atoms in the regular lattice. As a
consequence of the mathematical description of the wave character of carriers in semiconductors, a region of
forbidden energies exists called the bandgap Eg. In a perfect semiconductor there are no energy levels
available within the bandgap. This means that no electrons nor holes can reside in the energy region defined
by the bandgap.
Free electrons have energies in an allowed energy band higher in energy than the bandgap, the conduction
band Ec, whilst free holes have energies in an allowed energy band lower in energy than the bandgap, the
valence band Ev.
4 In one dimension.
5 In one dimension.
5 EE2 - Semiconductor Devices 2012
The amount of electrons available at each energy value is determined by the density of states g(E) and the
Fermi-Dirac distribution function f(E) as illustrated in Figure 2. g(E) gives the distribution of energy levels
(states) as a function of energy. Note that g(E)=0 in the bandgap (no energy levels). f(E) gives the
probability of finding an electron at energy E. Thus 1-f(E) gives the probability of finding a hole.
Figure 2: The energy band diagram with the position of the Fermi level EF as a function of the doping type
(left). The integration of the product of the density of states g(E) and the Fermi-Dirac distribution function
f(E) gives the carrier distribution over the energy range above or below the bandgap (right).
Remember the relationship between the position of the Fermi level EF and the density of carriers in the
semiconductor (given by the Fermi-Dirac or Maxwell-Boltzman distribution functions):
( ) ( )
( ) ( )
kT
EE
ci
kT
EE
c
kT
EE
vi
kT
EE
v
cicF
ivFv
eNneNn
eNpeNp
−−
−−
==
==
and
and
with Ei the intrinsic level6, Nc the effective density of states in the conduction band and Nv the effective
density of states in the valence band. The intrinsic level Ei is an energy position within the forbidden gap that
is determined by the intrinsic carrier concentration.
* Fermi level constant
At equilibrium, when no external bias is applied, no discontinuity or gradient can arise in the position of the
Fermi level throughout the complete structure, otherwise a current (diffusion of high energy carriers to lower
energetic places) would flow. Thus:
0=
dx
dEF
for Vext=0.
6 The intrinsic level Ei is the Fermi level position for the case of an intrinsic semiconductor. The introduction of this level (not a
state!) makes some calculations more straightforward.
6 EE2 - Semiconductor Devices 2012
EF
E
1/2 F(E)1
E E
Ec
Ev
g(E) carrier
concentration
a) intrinsic
electrons
holes
EF
E
1/2 F(E)1
E E
Ec
Ev
g(E) carrier
concentration
b) n-type
electrons
holes
EF
E
1/2 F(E)1
E E
Ec
Ev
g(E) carrier
concentration
c) p-type
electrons
holes
Extrinsic
semiconductor
Intrinsic
semiconductor
g(E) Density of states
F(E) Fermi-Dirac distribution function
T>0K
This gives the starting point for drawing the energy band diagram since Ec-EF and/or EF-Ev is known from the
doping concentration and Eg is known and remains constant in a homojunction.
* Influence of the electric field on the band diagram
Applying an electric field will result in a discontinuity in the Fermi level (this discontinuity is directly
proportional to the applied electric field) and will result in band bending (see the tilt in potential energy Ec in
Fig. 3).
Figure 3: Relationship between the electric field, the electrostatic potential and the potential energy.
dx
dE
edx
dV
xE c1
)( −=
−
=
E(x): Electric field, V(x): electrostatic potential, Ec(x): potential energy.
Electric field E(x) points “uphill”, electrons drift “downhill”. The reasoning is that electrons will flow from
v- to v+ (electrostatic attraction). This means that electrons are losing potential energy since it is converted
in kinetic energy, thus Ec at v- needs to be higher than Ec at v+. The electric field points from + to – and thus
up the potential hill.
Holes are flowing up the potential hill. You can check that this picture is completely consistent with the
carrier fluxes and current directions that have been discussed before. It is also comforting to see that these
directions are completely consistent with current directions used in the other courses such as Analysis of
Circuits and Analogue Electronics!
1.3. Junctions
* A junction is formed when 2 or more different materials are brought into close (atomic scale) contact.
Materials can include semiconductors of different doping type (homojunctions), different materials (e.g. Si
and SiGe) heterojunctions and metal-semiconductor junctions (e.g. Ohmic contact and Schottky contact).
* The work function φ
In order to draw an energy band diagram of a junction we need to draw the energy bands of each material
separately with respect of a local reference level that is defined for each material, the vacuum level Evac. The
position of the Fermi level with respect to the vacuum level, before contact of the material, is given by the
workfunction φ. Diffusion of electrons will appear from the material with the higher lying Fermi level to the
material with the lower lying Fermi level. This process will align the Fermi levels and create band bending in
the potential energy bands. The reason why band bending is created is due to the fact that no net current can
be flowing when no external bias is applied, thus the diffusion of carriers needs to be compensated. This is
done by drift of carriers which is caused by the build-up of an internal electric field that creates a drift current
opposite to the diffusion current and allows the system to reach equilibrium. Note that the workfunction of
the materials does not change when the junction is formed. As a result the internal electric field occurs in the
vacuum level across the junction – this is called the contact potential or built-in voltage.
* Band diagram of junctions
7 EE2 - Semiconductor Devices 2012
en
er
gy
distance
E(x): electric field
Ec
Ev
v+ v-
EF-
Ec
Ev
EF+
When two different conducting materials, initially uncharged, are brought into contact, the electrons close to
the junction redistribute themselves so that the Fermi energy is constant across the junction (in the
absence of an applied voltage).
Below we present different junctions with their energy band diagrams before and after contact, all without
external bias. Ensure that you understand how they are generated.
Metal-semiconductor junctions
Ohmic contact
metal-semiconductor junction
EFm
EFs
Ec
Ev
metal p-type
EF
-
-
+
+
metal p
Ec
Ev
ohmic contact
Figure 4: The Energy band diagram of a metal and a p-type semiconductor. Left: before contact, right: after
contact. For Ohmic contacts there should be an accumulation of majority carriers at the junction. Right:
The current-voltage characteristic of the Ohmic contact is linear.
The current-voltage characteristic of this junction is linear. The slope of the curve is proportional to the
conductivity of the semiconductor and the resistance of the Ohmic contact:
IRV
RRR
tot
torsemiconduccontacttot
=
+= 2
Schottky contact
In fig. 5 a Schottky contact on an n-type semiconductor is given. Left (bottom) is the energy band diagram
when no voltage is applied. Notice the bands bend up (depletion of electrons closer to the junction). At the
right (top) a positive voltage is applied to the metal with respect to the semiconductor. This causes a
discontinuity of the Fermi level at the junction (EF goes down in energy due to positive voltage, and the
internal electric field across the semiconductor of the junction is reduced by the externally applied field and
thus the barrier lowers). The electrons in the n-type material try to cross the junction towards the metal but
are not allowed to go through the wide forbidden bandgap. Thus the only electrons that can contribute to the
current are the ones above the potential barrier and this is only a small amount thus the current flowing at
this voltage will be small.
8 EE2 - Semiconductor Devices 2012
metal
l
-semiconductor junction
EFm
EF
s
Ec
Ev
metal n-type
EF
-
-
+
+
metal n
Ec
Ev
Schottky
contact
I
V
V
I
Figure 5: The energy band diagram of a metal and a n-type semiconductor. Left: before contact, right: after
contact. For Schottky contacts there should be depletion of majority carriers at the junction. The current-
voltage characteristics of the Schottky contact is exponential. A Schottky contact can be used as a rectifier.
It is a majority carrier device.
Semiconductor-semiconductor junction
pn junction and many more
Ecp
EF
Evp
Eg
p-type n-type
Ecn
EF
Evn
Ecp
EF
Evp
Eg
p-type n-type
Ecn
EF
Evn
eV0
W0
Figure 7: the energy band diagram of a pn junction. Left: before contact, right: after contact.
The work function difference between n-Si and p-Si causes a potential barrier between n and p Si when
forming the junction. Applying an external electric field will increase or decrease this potential barrier
respectively inhibiting and allowing current to flow.
* How to interpret an energy band diagram?
Energy band diagrams are great tools to predict the behaviour of the junctions under the influence of an
externally applied voltage. This is illustrated in fig. 8. The figure gives a Schottky contact on an n-type
semiconductor. The Schottky contact for the n-type semiconductor is characterised with a potential barrier
for electrons (depletion of minority carriers at the junction). When a positive voltage is applied to the metal
(V+) the Fermi level of the metal drops with a value equal to eV with respect to the Fermi level of the
semiconductor (which node we have grounded and thus it doesn’t change). This decreases the potential
barrier seen by the electrons in the semiconductor that are electrostatically attracted to the metal. However
not all electrons available in the semiconductor can flow through the junction to the metal due to remaining
potential barrier.
9 EE2 - Semiconductor Devices 2012
Figure 8: Left bottom: energy band diagram of a metal-semiconductor contact under zero bias. Left top:
circuit connection. Right bottom: energy band diagram under bias. The density of electrons as a function of
energy is also given. Right top: circuit connection, electrons are flowing through the closed circuit.
The potential barrier (increase in Ec towards the junction) blocks all carrier transport of carriers with energies
lower than the barrier. This is because these carriers would flow into the forbidden gap where there are no
energy levels to receive them. The carriers with energy higher than the barrier will be able to “flow” across
the junction and occupy free energy levels (states) at the other side of the junction. This will cause a small
current to flow. If the potential barrier is reduced more by applying a large V on the metal, then the current
will increase exponentially.
Thus the electrostatics imposed by the +V voltage attracts the electrons, however the quantum mechanics
presented by the energy band diagram shows that there is a potential barrier that blocks a certain amount of
available charges.
1.4 Conclusions
Semiconductors have two types of free carriers - electrons and holes - this gives the possibility for two types
of currents to flow in different junctions – drift and diffusion currents.
Energy band diagrams are a handy way to predict the expected magnitude of the current in junctions under
the influence of an external bias without the need for full scale device modelling.
10 EE2 - Semiconductor Devices 2012
Ec
EF
Ev
metal semi-conductor
Energy
Density of electrons at each energy value. Lots of
electrons close to Ec
: n2
> n1
> n3
but the density is
exponentially decreasing with increasing energy.
Potential barrier to electrons
intending to traverse to the metal
EFm
V+
Forbidden band, no electrons can travel
through the wide forbidden band
distance
Only these electrons have sufficient
energy not to have to go through
the forbidden band. Few electrons-
>small current.
Ec
n1
n2
n3
Built-in voltage
Potential barrier
2. The p-n diode
2.1 Review – the short pn diode
In EE1 the operation of the special case of a short diode was discussed. The definition of short diode is that
the width of the materials that make the pn junction, are smaller or equal to the diffusion length of the
minority carriers. As a consequence the number of minority carriers in the neutral region varies linearly, with
a slope determined by
1) the injection of minority carriers across the junction
2) the neutrality condition at the contacts (here we made the assumption that the contacts only impose the
bulk conditions on the carrier concentrations).
We found that the currents in a p-n diode are governed by diffusion of minority carriers in the neutral regions
(the neutral regions are those where the sum of all charges is zero, thus outside the depletion region).
The assumptions that were made to derive the current are:
- the contacts are ideal and do not show any band bending
- the contacts can absorb and generate the necessary carriers to keep bulk condition carrier
concentrations fixed
- no voltage is dropped across the neutral regions
- the applied voltage drops across the depletion region only
- the amount of injected carriers across the junction due to the applied voltage is negligible
compared to the majority carrier concentration determined by the doping.
Under forward bias, electrons are injected from the n-region into the p-region and holes are injected from the
p-region into the n-region due to the fact that the externally applied potential lowers the energy barrier
between the n and p type region. This injection of carriers causes a minority carrier gradient of electrons in
the p-type region and a hole gradient in the n-type region. Gradients of carriers cause diffusion current.
Similar gradients occur in reverse bias but they are a lot smaller because they are minority carriers rather
than majority carriers that are injected across the barrier. The reverse bias leakage current is limited by the
amount of holes available and/or generated7 in the n-type region and the amount of electrons available and/or
generated in the p-type region. Since under normal circumstances there is a limited number of minority
carriers available, the reverse leakage current is small.
* Band diagram of unbiased junction
Ecp
EF
Evp
Eg
p-type n-type
Ecn
EF
Evn
Ecp
EF
Evp
Eg
p-type n-type
Ecn
EF
Evn
eV0
W0
Figure 1: The energy band diagram of a pn junction. Left: before contact, right: after contact.
V0 (also called Vbi) is the built-in voltage, it represents the potential barrier that controls the amount of
carriers that diffuse. V0 is generated by the internal electric field that is a consequence of carrier diffusion
upon contact.
7 See more on generation of carriers later in this chapter.
11 EE2 - Semiconductor Devices 2012






= 20 ln
i
AD
n
NN
e
kT
V
* Space charge region or depletion region
p n p n
-
-
-
+
+
+
W0
built-in
E-field
-ve acceptor
ions
+ve donor
ions
depletion region
Figure 2: Left: p and n material before contact. Right: pn junction with 2 neutral regions (n & p) and the
space charge region. W0 is the depletion width when no external bias is applied.
In the “depletion approximation” we assume that the depletion region is empty of moving carriers. It
contains 2 sides with fixed ionised charges of opposite charge at each side. The fixed ionised charges are the
ionised doping atoms (they have lost a hole or electron → NA
- resp. ND
+). The doping atoms are fixed in the
lattice and thus cannot move and as a consequence cannot carry current. This region is thus more resistive
than the neutral regions.
The charge separation (the ionised charges in the depletion region) is caused by the internal electric field.
The internal electric field is due to that built-in voltage Vbi, the built-in voltage is a result of the contact
potential difference = work function difference between n and p-type Si.
* The p-n junction under forward bias
WnWp
p-type n-type
depletion regions
neutral region neutral region
+ +
+ +
+ +
+ +
+ +
- -
- -
- -
- -
- -
fixed donor ions
fixed acceptor ions
Ec
Ev
EF
e (V - |V|)
eV
+
+
+
free holes
free electrons
0
V
Figure 3: Top: forward bias condition. Bottom: energy band diagram of the pn diode under forward bias
Forward bias lowers the potential barrier across the junction with a value proportional to the applied voltage,
therefore more carriers will have an energy higher than the barrier and cross the junction. Current is flowing
and is increasing exponentially.
* The p-n junction under reverse bias
The reverse bias adds the absolute value of the applied voltage to the built-in voltage increasing the potential
barrier, therefore there are no carriers with sufficient energy to travel across the barrier. There is drift of
12 EE2 - Semiconductor Devices 2012
minority carriers across the junction. Since the number of minority carriers is low, the current is small and
determined by the minority carrier concentration rather than the electric field. Thus the off-current in a diode
is small and constant as a function of reverse bias voltage when no break down mechanisms occur.
E c
Ev
EF
eV
+
+
+
free holes
free electrons
e (V + |V|)0
WnWp
p-type n-type
neutral region neutral region
+ + +
+ + +
+ + +
+ + +
+ + +
- - -
- - -
- - -
- - -
- - -
V
Figure 4: Top: reverse bias condition. Bottom: energy band diagram of the pn diode under reverse bias
* Minority carrier distribution under bias and current.
It is important to remember that under certain bias conditions a certain amount of excess carriers is stored in
the n and p regions between the edge of the depletion region and the contact (neutral regions). These excess
carriers will cause the delays when switching pn diodes. More on this topic later.
Under forward bias the excess minority carrier concentration at the edges of the depletion width are given as
a function of the bulk minority carrier concentration and the applied voltage. The excess of carriers is
defined as the surplus (positive or negative) of minority carriers with respect to the initial minority carrier
concentration that is determined by the bulk material. The excess carrier concentration at the edge of the
depletion width (thus at x=wn or –wp) is given by:
edgeregiondepletionatregiontype-ninionconcentratholeexcess
edgeregiondepletionatregiontype-pinionconcentratelectronexcess
0
'
0
'
nnn
ppp
ppp
nnn
−=∆
−=∆
With the injected concentrations given by:






== kT
eV
n
n
p
p
e
p
p
n
n
0
'
0
'
(1)
with n’p and p’n respectively the minority electron concentration in the p-region at the depletion region edge
and the minority hole concentration in the n-region at the depletion region edge (injected minority carrier
concentration). np0 and pn0 are the intrinsic minority carrier concentrations.
To derive the expression for the current, it is best to refer to the graphical picture of the device under bias as
given in fig. 5. Note that looking at forward bias only, is sufficient to derive the expression of the current in
both bias regions.
13 EE2 - Semiconductor Devices 2012
Figure 5: Top: Short pn diode under forward bias with exaggerated depletion width. Bottom: excess
minority carrier distribution of short diode. Shaded regions represent the amount of stored excess minority
carrier charge8. Note that at the contacts the excess carrier concentration is zero. This condition is imposed
by the contacts.
In a short diode (the lengths of each neutral region is smaller or equal to the minority carrier diffusion
length) the minority carrier concentration is decreasing linearly in each region. The excess carrier
concentration is given by the shaded triangles in the neutral regions (Fig.5). The density of minority carriers
is imposed by the boundary conditions: eq. (1) and bulk conditions kept at Ohmic contacts. Since gradients
in carrier concentration occur due to the injection process across the junction, diffusion of minority carriers
will happen.
Calculation of the diode currents in a short diode is easy. Remember the expression for the diffusion current:
( )






























−








−








+










−
+
−







 −
+
−








−
−
−
−−
−






−
=
























1
1
11
''
0
'
0
'
00
00
00
00
kT
eV
s
kT
eV
p
pn
n
np
p
kT
eV
pn
n
kT
eV
np
p
nn
p
n
pp
n
p
nn
p
n
pp
n
n
p
p
n
tot
eI
e
L
Dp
L
Dn
eA
L
e
Dp
L
e
DneA
L
pp
D
L
nn
DeA
L
pp
D
L
nn
DeA
dx
dp
D
dx
dn
DeA
I
An interesting problem to think about is: what happens when one or both of the materials forming the pn
diode are shorter than the diffusion length (Ln and Lp) of the minority carriers (but longer than the depletion
8 Note that the length of the n-type region is given as Lp. This seems contradictory but isn’t from a physics point of view.
Remember than in the n-type region a hole diffusion current exists. The boundary for the definition of short diode is that the
length of the region is exactly equal to the diffusion length of the minority carriers which is Lp. The choice of taking the maximum
value of the lengths for deriving the short diode current is that this gives exactly the same expression for the current as in the case
the short diode approximation cannot be applied (see next). It is a bit cheeky, but now you know why.
14 EE2 - Semiconductor Devices 2012
x
-wp
wn0
np
pn
x
np0
-x
∆np
∆pn
pn0
0 0
Short
diode
p’n
n’p
-Ln
Lp
width in each region)? Thus do the derivation of the short diode current for a length xn<Lp for the n-region
and xp<Ln for the p-region and compare the result taking into account the given in-equalities.
Remember that there is also a majority carrier flow as the majority carriers injected across the junction have
to be re-supplied9. Luckily the rule that the total current is constant through the device makes calculation of
the minority carrier diffusion current in each region of the pn junction sufficient for deriving the total current
in the pn junction. The magnitude of the diffusion current of the electrons in the p-type region is equal to the
magnitude of the electron drift current in the n-type region, the latter current is the re-supply of the injected
carriers across the junction. This is similar for holes. This is illustrated in the picture below (fig. 6).
Figure 6: The contribution of the minority and majority carrier current to the total current through the pn
junction. Majority carriers injected across the junction are re-supplied via drift through the contact and
diffuse to the other contact through the minority carrier gradient region. The minority carrier gradients
determine the total current completely. The current remains constant in the space charge region because we
assume at the moment that there is no recombination no generation of carriers.
2.2 Generation and recombination – long pn diodes
In real diodes, the length of the materials forming the junction is not necessarily smaller or equal to the
diffusion length of the minority carriers. In the case of long diodes recombination of minority carriers will
happen whilst they are diffusion to the contact. As a result, the number of minority carriers varies non-
linearly in the neutral regions of the device. In what follows we will study its impact on the device
characteristics.
* Generation – recombination
We have seen that due to thermal energy electron-hole pairs are created, thus electrons and holes are freed
from the atoms and become free carriers that can be involved in the conduction processes. This process is
called generation of carriers and is happening continuously as long at the temperature is sufficiently high to
break the valence electron-atom bonds. Of course other forms of energy can do the same. An example is
light: shining light on a semiconductor, with the correct energy, larger than the energy gap, can also release
electron-hole pairs.
The opposite process is called recombination. In this case an electron and hole will recombine and thus get
fixed to the atom and become unavailable for conduction. This is a reduction of the number of free carriers.
As with generation, recombination is also continuously happening. Recombination can happen in two ways.
9 See first year course notes.
15 EE2 - Semiconductor Devices 2012
junction
Depletion region
current
p+
-region n-region
contact contact
In
Ip
Itot
Minority carrier diffusion currents
Majority carrier drift currents
Remain constant in
space charge region.
The first is direct recombination of electron and holes which means that excess electrons in the conduction
band recombine with holes in the valence band. Energy is lost by the electron and is given off as photons
(light). The second type is indirect recombination. In this case there are impurity centres or lattice defects in
the semiconductors, called traps – these will always be available as a 100% perfect semiconductor does not
exist. The traps will cause some discrete energy levels to exist within the bandgap of the semiconductor
which can have empty states to which the electrons from the conduction band can fall in order to cross the
bandgap in steps. In this case, the energy released by the electrons causes heating of the lattice (Heating
causes lattice vibrations. These vibrations can be seen as particles called phonons with which the carriers in
the lattice can interact – scatter. They can also be regarded as waves with certain energy and wavelength).
The characteristic timescale involved in the recombination processes is called the carrier lifetime τn,p. The
characteristic length scales are the diffusion lengths Ln,p. These parameters give the statistically average time,
respectively distance that a carrier travels before it recombines. This is a statistical average, thus means that
not all carriers will recombine within that time scale, but the majority will such that at x=Ln,p the number of
carrier have been reduced by a factor Exp(1). The values are dependent on the material, the quality of the
material, the doping density and the type of charged carrier. The relationship between the carrier lifetime and
diffusion length is given by the diffusion constant following:
pnpnpn DL ,,, τ×=
The intrinsic number of free electrons and holes is the same as carrier generation and recombination is in
equilibrium. In a pn diode under forward bias an excess minority carrier density exists in the neutral regions
of the device. When the voltage across the junction is not too high we can assume that this excess is a lot
smaller than the number of majority carriers in that region. It is the gradient of the excess minority carriers
that is significant. Recombination will happen between the majority carriers and the excess minority carriers.
Since the density of the excess carriers is small compared to the density of the majority carriers,
recombination processes can have a significant impact on the number of excess carriers, whilst being
insignificant for the majority carriers in comparison with the amount available. Recombination becomes
important for devices where the neutral regions are larger than the diffusion length10. If we put the pn diode
under reverse bias then there will be a reduction of minority carriers in the neighbourhood of the depletion
region edges (junction). In this case generation of minority carriers is larger in order to maintain equilibrium
conditions.
Thus the rate of recombination and generation will adapt itself to the availability of excess minority carriers
in the “neutral regions”11. When there is an excess of minority carriers, then the recombination rate will
increase proportional to this excess in order to drive the semiconductor back to equilibrium. Thus the
generation rate of minority carriers will then be smaller than the recombination rate. However when there is
a shortage of minority carriers then the generation rate increases to try to bring the minority carrier
concentration back to equilibrium conditions. In this case the generation rate of minority carriers is larger
than the recombination rate. Of course when minority carriers recombine they do so with majority carriers.
As a consequence the majority carrier recombination or generation rate is equal to that of the minority
carriers. We will assume that the injected minority carrier concentration is sufficiently small compared to the
majority carrier concentration such that the variation of majority carriers can be neglected.12
The minority carrier recombination rate in the “neutral region” can be described to acceptable approximation
by the simple equations:
10 It is indeed an approximation, although acceptable, in the short diode to assume no carriers recombine within the neutral region
as the diffusion length is a statistical average. Thus some do recombine but we neglect this.
11 What we call neutral is actually quasi neutral under the given assumption, that’s why it is written between quotes.
12 This assumption will actually break down the rule on charge neutrality in the “neutral region”. This is of course not completely
correct as charge neutrality is a fundamental rule. But the assumption will allow us to derive analytic expressions that still
describe the conduction through the device with reasonable accuracy.
16 EE2 - Semiconductor Devices 2012
p
n
p
n
p
n
p
U
n
U
τ
δ
τ
δ
=
=
(2)
Recombination in a depletion region or in those cases where the minority carrier concentration is of the same
order of magnitude as the majority carrier concentration have to be described by different equations than
those given above.
In order to calculate currents in the long diode, we need to know the variation of the minority carrier excess
in the neutral region. The first step is thus to derive the expression of this variation in the case recombination
happens13. In order to do that we take a volume of semiconductor material through which a hole diffusion
current is flowing as given in fig. 7. We look at the variation of the density of holes, as a function of time
and place, over an infinitesimal distance ∆x. This equation will give us the continuity equation for holes. It
gives the rate of change of the hole density while a current is flowing. It is also this equation that will be
important to analyse the transient processes in bipolar devices under large signal switching conditions.
Figure 7: Hole current entering and leaving a volume ∆x A.
p
npp
xxx
n txp
x
xxJxJ
et
txp
τ
δ ),()()(1),(
−
∆
∆+−
=
∂
∂
∆+→
(3)
In words this equation means:
The rate of variation of the hole concentration = increase of the hole concentration in volume ∆x ×A per unit
time - loss of holes due to recombination.
The term δpn is the excess minority carrier concentration. Excess means the density of carriers larger than the
minority carrier concentration defined by the doping of the bulk material only. The second term is the carrier
recombination term given in eq. (2). For ∆x→0 the equation (3) becomes a differential equation:
p
p txp
x
txJ
et
txp
t
txp
τ
δδ ),(),(1),(),(
−
∂
∂−
=
∂
∂
=
∂
∂
(4a)
Similar for electrons:
n
n txn
x
txJ
et
txn
t
txn
τ
δδ ),(),(1),(),(
−
∂
∂
=
∂
∂
=
∂
∂
(4b)
These equations are referred to as the continuity equations for the holes resp. the electrons.
If we can assume that drift is negligible14 then the current is solely diffusion and the current densities can be
written as:
13 Remember, without recombination it is linear.
14 This is a valid assumption as we are dealing with minority carriers and we have assumed that the injection rate is small. So the
absolute number of minority carriers is small and as a consequence the drift minority carrier current will be negligible.
17 EE2 - Semiconductor Devices 2012
propagation direction, x
x x+∆x
Jp
(x) Jp
(x+∆x)
A
x
p
eDJ
x
n
eDJ
n
pp
p
nn
∂
∂
−=
∂
∂
=
δ
δ
(5)
Substituting (5) in (4)15 gives the continuity equations of minority carriers taking recombination into account:
p
p
n
n
p
x
p
D
t
p
n
x
n
D
t
n
τ
δδδ
τ
δδδ
−
∂
∂
=
∂
∂
−
∂
∂
=
∂
∂
2
2
2
2
(6)
This equation is of utmost importance for analysing the switching characteristics of bipolar devices.
* minority carrier variations and currents
In case we have steady state carrier injection as e.g. across a forward biased pn diode in DC, the time
derivative is zero and in steady state the continuity equations become:
22
2
22
2
ppp
nnn
L
p
D
p
x
p
L
n
D
n
x
n
δ
τ
δδ
δ
τ
δδ
==
∂
∂
==
∂
∂
(7)
Solving this equation with boundary conditions:
0&0,@
&0@
===
∆=∆==
pnXXx
ppnnx
np δδ
δδ
(8)
These boundary conditions mean that x=0 is the point of steady state carrier injection (depletion region edge)
due to the applied DC voltage across the junction. The second boundary condition gives that at the contacts
the excess carrier concentration needs to be zero.
The solution of (7) for holes, which is a second order differential equation, can be written as the sum of two
exponentials: 







−+








=
pp L
x
C
L
x
Cxp expexp)( 21δ or using a hyperbolic sine function:








+= 21 sinh)( C
L
x
Cxp
p
δ with C1 and C2 integration constants that must be determined by the boundary
conditions (8). Using the sinh function as possible solution, we find the expression16 of the excess hole
concentration variation as a function of position:







 −







 −
∆
=
p
n
p
n
L
Xx
L
X
p
xp sinh
sinh
)(δ
(9)
This is a rather complex equation, useful for numerical simulations only but not for pen and paper work.
Therefore we want to simplify this equation for two special cases: the short diode approximation and the
long diode approximation. For the short diode approximation we take the limit of Xn << Lp for eq. (9) and for
the long diode approximation we take the limit of Xn .→ ∞
In the following we will evaluate what the errors are that we make by taking these approximations. For this
we need to calculate the current based on (9) and that based on the limits of short and long diode
approximations.
In order to calculate the current we have to take the first derivative of (9). This gives for the hole current:
15 Note that the subscript n and p are omitted. Remember that these equations are for the minority carriers!
16 MathematicaTM was used for this extraction.
18 EE2 - Semiconductor Devices 2012







∆
=
p
n
p
p
p
L
X
L
pAeD
I coth (10)
The following figures in Fig. 8 give the difference in excess minority carrier concentrations between the
short, long and correct diode descriptions.
Figure 8: The excess minority carrier hole concentration in the n-layer under normalised injection
conditions for the different solutions of the continuity equation and for different relative differences between
contact position relative to the minority carrier diffusion length. The minority carrier diffusion length is
Lp=200 nm, the distance to the contact varies: Xn= (a) 20, (b) 200, (c) 400 and (d) 1000 nm.
For short Xn (a), the short diode approximation describes the excess carrier concentration to excellent
accuracy. For long Xn (d) the long diode approximation is excellent. In the other two situations some error is
made. When Xn=Lp, the excess carrier concentration is best described by the short diode approximation
(smallest difference in area underneath the curves and correct contact boundary condition). When Xn>Lp but
19 EE2 - Semiconductor Devices 2012
(a) (b)
(c) (d)
Normalisedminoritycarrierconcentration
Distance (nm)
Normalisedminoritycarrierconcentration
Distance (nm)
Normalisedminoritycarrierconcentration
Distance (nm)
Normalisedminoritycarrierconcentration
Distance (nm)
Correct solution
Short diode approximation
Long diode approximation
of the same order of magnitude, the linear approximation becomes less accurate and the exponential equation
more accurate. The error in the long diode approximation is in the non-zero excess at the contacts.
When looking at the currents, we can conclude why the use of the approximations is acceptable in different
regions. In figure 9, the ratio of the correct current to the approximated current is given as a function of the
ratio of the lengths.
Figure 9: The ratio of correct current to approximated current. Blue: long diode approximation, pink: short
diode approximation.
Interesting observations are:
1. the error of using the short diode approximation becomes negligible small when Xn<<Lp. Obviously for
Xn<Lp the short diode approximation is best.
2. for Xn=Lp the error using the short or long diode approximation is exactly the same17. Thus we use the
short as it is easier.
3. for Xn>Lp the error made by using the long diode approximation decreases quickly and it is better to use
the long rather than the short diode approximation. We see that if the length of the diode layer is more than
twice that of the minority carrier diffusion length, the error becomes negligible.
* Simplified solution of eq. (7)
1. Short diode approximation
In this case, the Ohmic contacts are at a distance shorter than the minority carrier diffusion length. Thus Xp <
Ln and Xn < Lp, where Xp is the position of the contact of the p-layer and Xn is the position of the contact in
the n-layer. In this case we neglect any recombination by setting τn,p = in eq. (7). Then under the boundary∞
condition (8), the excess minority carrier concentration varies linearly. This is what is referred to as the
SHORT diode approximation.
2. Long diode approximation
In this case, the Ohmic contacts are at a distance larger than the minority carrier diffusion length. Thus Xp >>
Ln and Xn >> Lp. In this case we assume that the contacts appear at a distance equal to infinity: Xp = Xn = .∞ 18
In that case the solution to (7) is an exponential. This is called the LONG diode approximation.
17 This is obvious from the equations derived in this case for the short and long diode approximations.
18 Note that we are ignoring the signs.
20 EE2 - Semiconductor Devices 2012
Solving (7) in the long diode approximation we impose that the excess minority carriers have completely
disappeared by recombination. The solution for the excess carrier concentration is then:





 −





 −
∆=
∆=
p
n
L
x
L
x
epp
enn
δ
δ
excess minority carrier concentration19 (11)
With τDL = the diffusion length, which is the average distance a carrier diffuses (travels) before
recombining. τ is the average time between scattering20 events. Thus in the case of diffusion with
recombination the excess carrier concentration is varying exponentially in a long diode in contrast to the
short diode where the excess carrier concentration is varying linearly. This is illustrated in fig. 10.
Figure 10: the variation of the excess carrier hole concentration as a function of distance due to
recombination (full line).
n0 (p0) is the carrier concentration determined by the doping of the bulk material. ∆n (∆p) is the excess
carrier concentration at x=0 resulting from the carrier injection process. x=0 is the edge of the depletion
region. n ( p) is the x-dependent excess carrier concentration. Note that we are talking about minorityδ δ
carriers!
As in the short diode, the current is still determined by the diffusion of the excess minority carriers in the
neutral region. The difference is that now this minority carrier excess is changing exponentially. As a
consequence the minority carrier diffusion current calculated for holes is:





 −
∆= pL
x
p
p
p ep
L
D
qxJ )( (12)
Thus this current is decreasing for positive x (see fig. 10) because holes are disappearing by recombination!
But the total current needs to be constant. This can be obtained by remembering that total current consists of
hole and electron movement. Since we have neglected the variation of majority carriers, there must be a drift
current of majority carriers that is re-supplying the recombined carriers and resupplying the carriers that are
injected across the junction. The sum of this majority carrier drift current and minority carrier diffusion
current is constant. Thus we see that if minority carrier diffusion current is decreasing when going away
from the point of carrier injection, the majority carrier drift current in decreasing when going towards to
point of injection. The sum of the two is constant: Itot. As a consequence it is the diffusion of minority
carriers that limits the total current, therefore the total current must be determined by the maximum electron
and hole diffusion currents that can happen under the given injection conditions (determined by the applied
voltage) The maximum diffusion current that can flow can be calculated at the point of injection at both
sides of the junction (edge of the depletion width in the pn diode) as there the gradient of the exponentials is
19 Note that the variations of both minority carrier concentrations are calculated in the positive x-axis. Signs will change for pn
junctions.
20 Scattering is caused by interaction of the carriers with Si atoms, impurities (doping and others) and crystal imperfections.
21 EE2 - Semiconductor Devices 2012
p(x)= p0
+ ∆p e(-x/Lp)
∆p
p0
xXn
Lp
Excess carrier
concentration is forced
to zero at contact.
maximum. This gives the first approach of finding the expression of the current in a long pn diode.
Figure 11: Top: pn diode under forward bias with exaggerated depletion width. Bottom: excess minority
carrier distribution of long diode. Shaded regions represent the amount of stored excess charge.
Calculation of the diode currents in a long diode is based on calculating the maximum diffusion current at
the edge of the depletion region width, see fig. 11. This means that we determine the excess carrier gradient
at x=0 in each region:
( )

























 −
+
−







 ∆
+
∆







 ∆
−
∆−








−








−
=
=
−
=
−
==
==
p
nn
p
n
pp
n
p
n
p
n
p
n
x
Lx
n
p
x
Lx
p
n
x
n
p
x
p
n
x
n
p
x
p
n
tot
L
pp
D
L
nn
DeA
L
p
D
L
n
DeA
dx
epd
D
dx
end
DeA
dx
pd
D
dx
nd
DeA
dx
dp
D
dx
dn
DeA
I
pn
00
0
/
0
/
00
00
''
δδ























−








−








+












−
+
−
=
























1
1
11
00
00
kT
eV
s
kT
eV
p
pn
n
np
p
kT
eV
pn
n
kT
eV
np
tot
eI
e
L
Dp
L
Dn
eA
L
e
Dp
L
e
DneA
I
Note that the result we have obtained for the long pn diode current is the same as the short diode. This is
only the case when for the short diode we take the lengths of the neutral regions to be exactly the same as the
diffusion lengths of the minority carriers. For shorter diodes, the values of Ln and Lp will have to be changed
by the actual widths of the neutral regions and the current will thus increase in shorter diodes.
Figure 12 gives the electron and hole components of the currents in a long pn diode. Each component is not
constant throughout the device but the sum of electron and hole current is constant. The majority carrier
component occurs as a result of recombination between minority and majority carriers, majority carriers
22 EE2 - Semiconductor Devices 2012
x
-wp
wn0
np
pn
x
np0
-x
∆np
∆pn
pn0
0 0
Long
diode
p’n
n’p
need to be re-supplied, which causes the current. Compare this to the short diode where all current are
constant throughout the device. Thus our initial assumptions that there is no electric field21 in the neutral
regions is not quite correct otherwise there would be no drift current for the re-supply of carriers. The re-
supply can be allocated to drift as the gradients of the majority carriers are so small that it would not be
sufficient for re-supply. The electric field can be very very small as long as the number of carriers is large
(which is the case for majority carriers) to make a sufficiently large drift current. Thus although there is a
small electric field across the neutral regions it still is negligible compared to the electric field dropped
across the depletion region.
Figure 12: The variation of the magnitude of the hole and electron current in a long diode. Note Ip is a
minority carrier diffusion current in the n-region and a majority carrier drift current in the p-region (similar
for In).
There is another way to calculate the currents in the pn diode that will come in handy when discussing the
switching behaviour of the pn diodes. To that aim we quickly look at this second method for calculating the
diffusion currents in a diode.
With reference to fig. 11 note that there is excess minority carrier charge in the neutral region (this is
indicated by the shaded regions). We call Qn,p the excess minority carrier electron, hole concentration in resp
the p, n type region. The density of the excess charge is given by the shaded area underneath the curves for
δn and δp. To calculate the excess charge we integrate the excess minority carrier functions:
∫
∫
∞
∞−
=
−=
0
0
dxpeAQ
dxneAQ
np
pn
δ
δ
(13)
Note that the boundary conditions chosen for this calculation are taken to be infinite. These boundary
conditions represent the position of the contacts under the long channel approximation22. Under the
assumption that the exponential variation of the excess carrier concentration is the solution of the steady
state continuity equation we have to make sure that the excess carrier concentration at the contacts is zero.
We know that current is a variation of charge as a function of time. In the case where recombination of the
excess carriers occurs we know that this recombined charge needs to be re-supplied. Every τn,p the charge
Qn,p disappears via recombination and this charge needs to be re-supplied in the same time scale in order to
maintain steady state. The current that re-supplies these re-combined minority carriers is given by:
p
np
p
p
p
n
pn
n
n
n
peALQ
I
neALQ
I
ττ
ττ
∆
==
∆
==
(14)
Thus the current can be expressed as the stored minority charge in the neutral regions divided by the lifetime
21 Nor a gradient in majority carriers
22 This ensures a zero excess carrier concentration at the contact!
23 EE2 - Semiconductor Devices 2012
p n
Itot
Ip
In
In
Ip
Itot
=In
+ Ip
of the minority carriers in this region. Filling in the expressions for the excess carriers and the diffusion
constants will give the same current equations as extracted before for the long diode.
2.4 Non-idealities in pn diodes
When measuring a Si pn diode and plotting the current on a log scale we get a graph as in fig. 13.
Region a
The assumption in the ideal pn diode is that no recombination happens in the depletion width, thus carriers
travel through unhindered. This is not completely correct, especially in pin23 diodes or diodes with long
depletion widths. If the depletion width is larger than the carrier diffusion lengths, recombination of carriers
in transit will occur. This will affect the current at low current densities (small number of carriers in
transfer). More carriers need to cross in order to obey the relationship for injected carrier concentration as a
function of applied voltage.
Region b
This region behaves as ideal diffusion and happens for intermediate voltages.
Region c
This is the region of high level injection. A huge amount of carriers is injected across the junction and makes
the number of minority carriers at the edge of the depletion region of the same order of magnitude as the
majority carriers. This brings changes to the majority carrier density which we have assumed to be constant
in the ideal case. In the high carrier injection regime the relationship for the injected carrier concentration
that we have derived in EE1 breaks down. Its effect is a lowering of the total current flowing.
Region d
At still higher voltages or for large ohmic contact resistances a large amount of the applied voltage is
dropped across the ohmic contact rather than across the depletion region and thus the intrinsic diode feels
less voltage applied, keeping the current lower than expected.
Figure 13: The difference between an ideal and a real IV curve of a Si pn diode.
Although all these effects can be calculated, there is no easy solution. Therefore an ideality factor n is
introduced in the formula for the current in a pn junction that takes into account these non-ideal effects. Note
that the ideality factor n is called the emission coefficient in SPICE.
The expression for the current then becomes:








−=






1nkT
eV
stot eII
With 1 ≤ n 2. n=1 in the ideal region and goes towards 2 in the recombination and high level injection≤
region.
2.5 Switching delays in pn-diodes
The switching characteristics of pn diodes are all governed by EXCESS MINORITY CARRIERS.
23 p-type region + intrinsic region + n-type region
24 EE2 - Semiconductor Devices 2012
Ln(I)
V
a)
b)
c)
ideal
real
d)
Under bias there exists an excess minority carrier concentration inside the neutral regions close to the
depletion region. The amount of which is a function of the applied bias – the larger the current that is
flowing the larger the excess charge. In order to change the current, the excess charge stored should change
before the voltage across the diode junction can change. This is inherently a capacitive effect.
We can look at two ways of switching. First (fig.15), one can switch the diode from on (Vapplied>0V, forward
bias) to off (Vapplied=0V, by opening the switch such that I=0A). We will see that removal of excess carriers,
when the diode switches from forward bias to open circuit, occurs via recombination only. This is thus
governed by the carrier lifetimes. The carrier lifetime is the average time an electron (resp. hole) spends in
the material before it recombines with a hole (resp. electron). τn and τp are the minority carrier life time of
electrons and holes respectively, thus it will take a time equal to τn and τp to reduce the excess carrier
concentration by a factor e.
Fig. 15 illustrates a switching experiment of a p+n diode (current mainly governed by holes) from forward to
zero bias via a switch that opens at t=0. Although the current drops immediately to zero, the voltage, v(t)
across the diode remains until all excess charge is removed. That means that there will be a voltage across
the load RL until excess charge removal is complete.
I Qp(t) δp
I I τp
t t xn
Current through diode. Decay of stored charge. Change of excess
in function of position.
Figure 15: Top: switching circuit. Bottom: Left: upon switch-off the current through the diode drops to zero
but the excess charge remains and decays exponentially via recombination only (middle). The state of the
diode cannot change before the charge is removed. Right: dashed lines give gradient of excess charge at the
edge of the depletion region. When the current is 0 the gradient is 0.
Repeating equation (4a):
p
p txp
x
txJ
et
txp
τ
δδ ),(),(1),(
−
∂
∂−
=
∂
∂
Re-organising the terms, multiplying by cross sectional area A and integrating over the neutral region:
A
t
txpe
A
txpe
A
x
txJ contactcontact
p
contact
p
∫∫∫ ∂
∂
+=
∂
∂−
000
),(),(),( δ
τ
δ
Remember that the diffusion current is zero at the contact and maximum at the edge of the depletion region
(x=0) and that the integral of the excess minority carrier concentration in the neutral region multiplied by
unit charge e and cross sectional area A gives the total stored charge Qp in that region (see eq. 13).
25 EE2 - Semiconductor Devices 2012
RL
e(t)
+
-
i(t)
v(t
)
vL
(t)
t=
0
This gives the expression for the time variation of the current as a function of the stored charge in the neutral
region:
dt
tdQtQ
ti
p
p
p
p
)()(
)( +=
τ
(15)
Eq. (15) states that the instantaneous current in a switching device ip(t) is equal to the re-supply of the excess
carrier concentration that is disappearing as a result of recombination (this is the DC component of the
current – 1st term RHS) plus the AC component that allows a build-up or depletion of charge as a function of
time (2nd term RHS).
In the special case of switching the p+n diode from ON to zero, a solution to equation (15) can be easily
found. For t≤0 the DC forward bias imposes a current I0 through the device. Thus at t=0-24 the excess
minority carrier charge is given by: Qp=I0 τp. At t=0+25 the current drops to zero (open circuit) and remains
zero, the charge cannot follow immediately. These form the boundary conditions to solve (15)26.
Thus (15) becomes:
dt
tdQtQ p
p
p )()(
−=
τ
Integration over time gives:
( )
pt
p
p
p
t
p
t
p
p
eCtQ
c
t
tQ
dt
tQ
tdQ
τ
τ
τ
/
00
)(
)(ln
)(
)(
−
=
+−=
−= ∫∫
With c and C integration constants.
Since Qp(t=0+)= I0 τp the integration constant C= I0 τp.
Thus the variation of the excess minority carrier charge as a function of time is given by:
pt
pp eItQ
τ
τ
/
0)(
−
= (16)
The proof that the voltage remains across the diode goes as follows. We need to find the relationship
between the voltage across the diode and the minority carrier excess charge. This relationship, we all know
from the injection of carriers relationship (1):






−





=−=∆ 1
)(v
exp00
'
kT
te
pppp nnnn (17)
With v(t) the voltage across the diode. Thus as long as ∆pn is non-zero, there exists a voltage v(t) across the
diode.
If we ignore the distortion of the exponential variation of the excess charge at the depletion region edge27, we
can still use the pure exponential relationship of the excess carrier concentration as given by eq. (11). The
stored charge at any time is then given by (13):
)(tpeALQ npp ∆= (18)
Substituting eqs. (16) in (18) gives )(tpn∆ as an exponential function of time. Substituting this in (17) and
extracting v(t) gives:
24 An infinitesimal amount of time before switching.
25 An infinitesimal amount of time after switching.
26 Note that these switching equations can also be solved with the methods introduced in the Signals and Linear Systems course
this year.
27 Since the current is zero, the gradient at the depletion region edge of the minority carrier density needs to be zero too! So there
the line for the excess carrier concentration is horizontal and not exponential.
26 EE2 - Semiconductor Devices 2012








−=
−
1ln)(v
/0 pt
onp
p
e
peAL
I
e
kT
t
ττ
(19)
In order to improve switching speed in this situation, recombination centres are added to decreases the
carrier life time, τp. On the other hand one can also make a p+n diode with a short p+ region, smaller than the
recombination length in order to limit the excess carrier build-up.
Thus:
• the excess charge dies out exponentially via recombination as a function of time
• the voltage across the diode junction cannot change instantaneously but has to wait till the excess
charge has disappeared in order to establish the correct depletion layer for a reduced voltage.
Another way to improve the switching time is to switch the diode from ON to OFF by applying a negative
(reverse bias) voltage during off switching. This will give rise to the reverse recovery transient. In this case a
current will be flowing during the switching and thus the excess charges will be removed via a combination
of diffusion and recombination. The physics associated to this process is represented in the drawings below.
The magnitude of the switch-off voltage in the given case is equal to the magnitude of the on voltage. The
time period T has to be large enough to allow the diode to switch off completely in each cycle.
The second method to switch the diode is to drive the excess carriers from the neutral region via a current,
then charge will be removed via recombination and diffusion currents.
e(t)
+E
i
0 t
-E
T
Figure 16: Circuit and input square wave. R is the load resistance.
Figure 17: Excess hole concentration distribution in the n-region as a function of time during the transient.
Note the change in the gradient of the excess minority carrier density at the moment of switch-off (below the
x-axis). At ON: the current is positive, at the moment of switch OFF the current becomes negative.28
28 Note that the on and off state excess carrier concentration is not drawn to scale. The on state excess carrier concentration is a lot
larger than the off-state excess carriers concentration.
27 EE2 - Semiconductor Devices 2012
x
δp
If
gradient<0→
Ir
→ gradient>0
t
p+
n
R e(t)
Figure 18: Top: the full line is the diode current-voltage characteristic. The dashed line with the arrows is
the current-time diode characteristic whilst switching. Bottom is the variation of the voltage across the
diode as a function of time. The graphs at the right are the currents and voltages measured across the diode
as a function of time. tsd is the storage delay time.
At t<0 the diode is ON and a current If=E/R is flowing. The forward bias current will be mainly determined
by the bias circuit because the resistance of the forward biased diode is very small. As a consequence, the
voltage drop across the diode is negligible compared to that across R. Thus the load resistance will limit the
current. This current determines the slope of the excess carrier concentration at the depletion region edge.
We know that this slope is consistent with the diffusion of minority carrier holes in the n-type region from
the depletion region edge to the contacts (similar for electrons in the p-type region). At t=0 the voltage
polarity is reversed whilst the magnitude of the voltage is the same (this equality is not necessary and is here
used for convenience). Then a negative current -Ir=-E/R will be flowing that is consistent with this voltage.
This negative current is many times larger (in absolute value) than the reverse bias current that is normally
flowing through the pn diode in DC reverse bias. The reason why this happens is the following. When the
diode was initially forward biased it had a narrow depletion region (that only allows a small voltage drop
across it) and a relatively large density of stored minority carriers. When the external bias is reversed, we
know from the previous switching experiment that the excess minority carrier charge that is stored in the
neutral regions will not disappear immediately. As a consequence, the depletion region cannot increase and
the voltage across the diode can also not increase immediately. Remember that the depletion region is a
region without free charged carriers. Thus in order to deplete the neutral regions, we first have to deplete the
regions around the junction of the excess minority carrier charge. Once that is done, the region around the
junction can be depleted of the majority carriers. Doing this, forms the depletion region. Thus we can see
now that when the external bias goes negative, the voltage drop across the diode is still small and negligible
compared to the voltage drop across R. The current is thus determined by load resistance R and applied
voltage –E.
Since a negative current, -Ir is flowing, the slope of the excess carrier concentration at the depletion region
edge is exactly opposite to the one in forward bias. This indicates that minority carriers have to flow the
other way than under positive bias29. Thus minority carrier excess holes are diffusing from the n-type region
to the p-type region and electrons from p to n. This current removes the excess charge. The current is large
as long as it is determined by the external circuit and excess minority carriers are available. When the excess
is removed (mainly by diffusion but also by recombination) then the depletion region will be able to build
up. The current is decreasing as only the intrinsic minority carrier density remains to carry current.
Thus as long as excess carriers remain, the slope of δp at the depletion region edge remains constant. When
29 Remember that the direction of the diffusion current is given by the gradient of the minority carriers at each point x in the
device.
28 EE2 - Semiconductor Devices 2012
I
V
If
-Ir
t
v(t)
t
i(t)
-E
If
t
-Ir
v(t)
tsd
tsd
the excess is removed, the depletion width adapts and an increasing voltage will be dropped across the
increasing depletion width. The current through the circuit will then be more and more limited by the current
that is allowed to flow through the diode. The final current will be determined by the small amount of
minority carriers in the neutral region near the depletion region edge. This is maintained at steady state via
carrier generation processes. The OFF current is thus the leakage current through the reverse biased diode.
At t=0 the excess carrier concentration at the edge of the depletion region is p’n and at the end of the switch
cycle the excess carrier concentration at the edge of the depletion region should have become p”n.





 −






=
=
kT
eE
nn
kT
eE
nn
epp
epp
0
''
0
'
This is clearly illustrated in fig. 18. Important to note when you look at fig. 18 is the point where the diode
can finally go into reverse bias. This point is where v(t) – the voltage across the diode junction - becomes
equal to zero, which is consistent with the complete removal of excess charge, thus Qp=0. The time it takes
to remove all the excess charge is called the storage delay time tsd.
In order to find the variation of the charge as a function of time, eq. (15) has to be solved with the boundary
conditions that for t<0 the charge is Qp=If τp and at t=0 the current becomes I=-Ir. This approach will allow us
to derive an expression for the storage delay time. The assumption that we are making is that the condition
I=-Ir is steady state until we reach t=tsd. This approach will not give the time it takes the diode to build-up the
depletion region from the “no-excess charge” condition. Solving (15) for a p+n diode30 can be done by using
Laplace transforms or as follows, re-writing (15) :
p
p
p
p tQ
ti
dt
tdQ
τ
)(
)(
)(
−=
For 0 < t < tsd we know that ip remains constant at –Ir, thus:
p
p
r
p tQ
I
dt
tdQ
τ
)()(
−−=
Separation of variables:
prpp
p dt
ItQ
tdQ
ττ
−=
+)(
)(
Integrate:
( )
( ) ( )
( )
( )
( ) 







−++−=
−=
+
+
−=+−+
−=+
−=
+
∫∫
p
rpFprpp
prpFp
rpp
p
rpFprpp
p
tQ
Irpp
t
p
tQ
Q rpp
p
t
IIItQ
t
II
ItQ
t
IIItQ
t
ItQ
dt
ItQ
tdQ
p
fp
p
p
τ
τττ
τττ
τ
τ
τττ
τ
τ
ττ
τ
exp)(
)(
ln
ln)(ln
)(ln
)(
)(
)(
0
)(
)0(
or
( )















 −
++−=
p
rfrpp
t
IIItQ
τ
τ exp)( (20)
Eq. (20) is valid for 0 < t < tsd only.
30 Current determined by the hole current.
29 EE2 - Semiconductor Devices 2012
The storage delay time tsd can then be extracted by stating that at t=tsd, Qp(tsd)=0. Thus:
( )















 −
++−=
p
sd
rfrp
t
III
τ
τ exp0
The storage delay time is then (under the assumption of quasi steady state) :






+≅
r
f
psd
I
I
t 1lnτ
Switch from forward to reverse bias state:
• reverse current larger than diodes’ reverse saturation current
• transient current and voltage are delayed by change in stored charge
• this causes a storage delay time tsd during which the current is larger than the reverse bias current
associated to the DC characteristics
• delays in pn diodes are a consequence of excess minority carrier charge
As before, to improve the switching time in pn diodes one can introduce recombination centers such that the
lifetime of the carriers reduces which makes the excess charge disappear faster. Unfortunately this also
increases the reverse leakage current.
The delay time can also be reduced by using a short device layer.
Other solutions to obtain fast rectifying devices include the use of Schottky diodes. Here only majority
carriers need to be removed which is a fast process. In a Schottky diode the junction is formed by a metal-
semiconductor contact, e.g a metal with a larger work function than the work function of n-type silicon. This
depletes the majority carriers (electrons) in the semiconductor at the junction. No depletion of carriers occurs
in the metal. In order to switch the Schottky diode from on to off, it is the majority carriers that move back
towards the junction. There are plenty of them and we do not have to wait for generation of these majority
carriers to establish re-supply. Remember that the fast switching in the Schottky contact can be exploited to
improve the switching behaviour in bipolar junction transistors too.
The use of GaAs (high mobility carriers and shorter lifetime than Si) results in ultra high speed diodes.
Specially designed pn diodes which strongly conduct for a short period of time in reverse bias – the step
recovery diode – can switch in the pico-second range and are used for harmonic generators.
2.6 Small signal equivalent circuit of a p-n junction diode
If diodes are to be used as components in circuits, their non-linear characteristics can become cumbersome
for fast circuit simulation purposes. Very often in circuit operation a device is functioning around a DC point
(see analogue electronics course). The variations around this point are relatively small such that the device
acts as if it is linear around this point. Therefore for circuit design purposes an equivalent circuit can be used
with component values dependent on the chosen DC point but further giving a linear response. For the diode
we have seen that there is a resistive component and a capacitive component that are both a function of
voltage. The equivalent circuit is given in fig. 21.
30 EE2 - Semiconductor Devices 2012
R s
r = 1/gdd C
Figure 21: Small signal equivalent circuit of a pn-diode. Rs is the contact resistance, rd is the diode’s
differential resistance and C is the voltage dependent capacitance.
The series resistance RS represents the non-ideal characteristic of the Ohmic contacts. The capacitance C is
due to charging and discharging effects occurring during AC operation. There are two different situations.
One is in reverse bias where a depletion region with fixed ionised charges is built-up with an amount
dependent on the applied voltage31. The other is in forward bias and takes into account the variation of the
built-up excess charge as a function of voltage.
- Depletion capacitance in reverse bias (cfr. parallel plate capacitance)
- Diffusion capacitance in forward bias (current injection across junction)
Reverse bias: Depletion capacitance
( )( )VVNN
NeN
AC
W
A
C
DA
DA
depl
depl
depl
−+
=
=
02ε
ε
ε
Wdepl is the depletion width, V0 the built-in voltage and ε= ε0 εr.
Figure 22: The variation of the depletion capacitance as a function of bias across the pn-junction.
Forward bias: Diffusion capacitance
τI
kT
e
C
dV
dQ
C
dV
dQ
C
diff
p
diff
diff
=
=
=
+
junctionnpfor
31 Review the calculation of the depletion width in your first year EE1.3 Semiconductor Devices course.
31 EE2 - Semiconductor Devices 2012
Depletion
Capacitance
V
revers
e
forwar
d
The differential resistance rd relates to the slope of the IV characteristic. Easily calculated as a differential
conductance: I
kT
e
dV
dI
g
r
d
d
===
1
2.7 Large signal equivalent circuit of a p-n junction diode
While a small signal equivalent circuit does not consist of non-linear elements because due to the small
variation in applied voltage the IV region used can be assumed linear. This is no longer the case for a large
signal equivalent circuit. Linearization is no longer possible because the whole non-linear current-voltage
region is used.
The large signal equivalent circuit for pn diodes is given in fig. 23.
Figure 23: large signal equivalent circuit of pn diode.
2.8 Conclusion
The characteristics of a pn diode, at low injection levels (meaning that the injected density of carriers across
the junction is much smaller than the majority carrier concentration available), are completely described by
the variation of the minority carriers at each side of the junction. The bias voltage across the junction defines
the excess carrier concentration at the edges of the depletion region while the Ohmic contacts impose bulk
conditions on the material. When recombination of carriers is taken into account, the excess carrier
concentration varies exponentially if we take the long diode approximation. If we ignore carrier
recombination completely – an assumption that can be made when the diode is sufficiently short – then the
excess carrier concentration varies exponentially. The maximum gradient of the excess carrier concentrations
determines the current in the pn diode. This maximum gradient occurs at the depletion region edges. Due to
the existence of excess carriers in the neutral regions of the diode, delays occur when switching. The density
of excess carriers and the bias voltage across the junction are intimately related, this means that the voltage
across the junction can only change when the density of excess carriers has changed. When switching from
on to off, the depletion region in the pn diode across which the largest part of the voltage drops, can only
extend when the excess carriers are removed. Switching times in devices where minority carrier
concentration play an important role are normally relatively large compared to switching times in majority
devices such as a Schottky diode.
32 EE2 - Semiconductor Devices 2012
C
Rs
3. Bipolar Junction Transistor (BJT)
3.1 Review – the short BJT
The BJT is a device which has three ohmic contacts to the three different semiconductor layers that are
connected together. Basically, the BJT structure consists of a series connection of a pn and np or np and pn
diode where the n-regions, respectively p-regions, of both diodes overlap. This makes a pnp and npn BJT.
Having a series connection of two pn diodes, there are now two junctions to consider of which the
boundaries are not connected to an Ohmic contact. We will see that it is the voltage across each junction
separately that determines the currents through the BJT.
The BJT is another device in which the minority carriers will play an important role, similar to the pn diode.
As in the pn diode the voltage across each junction will determine the density of excess carriers at the edges
of the depletion regions of each junction. The calculation of the excess minority carrier concentration across
each junction is thus identical to that of the pn diode. As a consequence the currents that are flowing in the
different layers of the BJT will be determined by the maximum minority carrier concentration gradients,
which will occur near the depletion region edges.
Recombination of carriers in the base is very important as it will determine whether the material combination
will have amplification or not. Notwithstanding this, very often recombination is ignored and a “short BJT”
approximation is used. This will allow easy mathematical formulae to describe the currents and gives
relatively good approximations for the collector current.
3.2 Charge transport in BJTs (principle of operation)
In order to get an idea of how a BJT functions it is good to review the pn diode. Remember that in a reverse
biased p-n junction, the current 







−=






1nkT
eV
stot eII becomes stot II −= and is independent of the magnitude
of the reverse bias voltage V. Is is given by: 







+=
p
pn
n
np
s
L
Dp
L
Dn
eAI
00
. The magnitude of Is is determined by
the density of minority carriers, pn0 and np0, in each layer. In reverse bias it are minority carriers that are
crossing the junction, namely holes flow from the n-type material to the p-type and electrons from the p-type
to the n-type. As the number of minority carriers is restricted32, this magnitude determines the current.
p n
V
I
V
I
Isat
Figure 1: Left: reverse biased pn-junction. Right: Current-voltage characteristics.
Thus if we decrease the doping density in each layer, the magnitude of the minority carriers will increase and
the reverse bias current in the pn diode will increase. Of course doping is not a good option for active control
of the off-current. Another possible way to control the current density is by shining light of the correct
frequency on the junction. This light will be absorbed and creates electron-hole pairs (carrier generation).
The minority carriers near the depletion region edge – thus those that feel the electric field across the
depletion region – will be swept across the depletion region and thus increase the off-current. This can be
done in a controlled way by varying the intensity of the light. More intense light will generate more carriers,
and thus more minority carriers near the depletion region edges and thus the off-current will increase with
increasing light intensity. This is illustrated in fig. 2 where only an increased injection of holes is considered.
32 Remember that the minority carriers need to be supplied by carrier generation.
33 EE2 - Semiconductor Devices 2012
p n
V
I
V
I
Isat
hole injector
Figure 2: Left: Holes are injected in the n-type region near the depletion region edge of a reversed biased
pn-junction. Right: the off-leakage current increases as the available minority carrier density increases due
to the hole injection process.
For an all electrical solution to the active control of the off-current in a reversed biased pn diode, we can use
a forward biased p+-n junction (+: heavily doped p-side). A heavily doped p layer in a pn junction will cause
the total current to be mainly dependent on holes. The reason can be easily seen from the gradients of the
minority carriers in each region: in the n-region the gradient is given by 





=≈−
T
EB
nnnn
V
V
pppp exp'' 00
and
in the p-type layer the gradient is given by 





=≈−
T
EB
pppp
V
V
nnnn exp'' 00
. Here VEB>0V (forward bias) and
e
kT
VT = . Since NA >> ND we find that 00 pn np >> and thus the hole minority carrier gradient, that defines
the hole diffusion current in the n-region is larger than the electron minority carrier gradient in the p+ region.
Since Ip >> In we call a p+n junction a hole injector.
Thus if we put this hole injector sufficiently close to a reverse biased pn junction then the hole injector will
increase the amount of minority carriers (in this case only holes) that will flow across the junction and thus
the off-current increases in exactly the same way as given in fig. 2.
p+ n
VEB
VBC
IC
IE
IB
IC VBC
p
Emitter Collector
holes injected holes collected
Base
Wb
IE
Figure 3: Left: a combination of a forward biased p+n junction, acting as a hole injector and a reverse
biased np junction acting as a hole collector – the BJT. Right: the collector current (holes collected) as a
function of the emitter current (≈holes injected).
Fig. 3 gives the whole combination of pn and np junction forming a pnp bipolar junction transistor (BJT).
The heavily doped p+ layer of the injector diode is called the emitter (E), the layer that is in common for the
two diodes is the base (B) and the layer that will collect all the holes that are injected by the p+n diode (thus
injected by the EB junction) will be collected by the reverse biased np junction. The p-layer of the hole
collecting diode is called the collector (C). If the base width is sufficiently small the collector current that
will flow as a function of reverse bias voltage across the BC junction is given in fig. 3 (right). Thus if the
emitter current – which is the current across the EB junction – increases, then the collector current is
increasing accordingly. The magnitude of the current is determined by the minority carriers that are injected
across the EB junction rather than the reverse bias voltage across the BC junction. Note that if we take the
approximation that the emitter current consists of a hole current Ip only, and all the injected holes get through
34 EE2 - Semiconductor Devices 2012
the base, then the collector current is equal to the emitter current and there is no current amplification
between IE and IC.
The BJT thus operates by injection and collection of minority carriers. A good BJT is an a-symmetric
device: the doping density in the emitter is higher than the doping density in the collector. From the physics
we can see that since we want to collect more holes, it needs to be holes that are injected, thus we need a
hole injector. Later we will see from the expression of the current amplification factor and the emitter
junction injection efficiency that high emitter doping gives good amplification and injection efficiencies.
This approach has given us an insight into the relationship between the emitter and collector current in a
common base configuration (as given in fig. 3). However what happens in between the common base point
(common between the emitter and collector)? Is there a current flowing from this point in or out of the base
region? The answer of course is yes. In order to understand this, we have to take a closer look at what all the
carriers are doing in the structure under the given biasing conditions.
The main carrier flow in a pnp BJT is holes, as seen above. In normal active mode operation of the BJT:
VEB>0V and VBC<0V in a pnp BJT, a large amount of holes are injected by the emitter into the base and these
are then collected by the collector. However we have seen in pn diodes that both hole and electron currents
exist at the same time but not necessarily in the same magnitudes. The magnitudes is determined by the
doping densities. We have also seen that recombination of carriers can occur. If recombination of holes
occurs in the base region then it can be expected that the collector current will decrease, as there will be less
holes available for collection at the collector side.
As a consequence there will also be electron currents in the BJT. These electron currents have a direct
relationship to the base current in a pnp BJT. In fig. 4 all the different current components that can exist in a
BJT are given.
p+ n
VEBIE
IB
IC VBC
p
hole flow
electron flow
1
2
34
5
Figure 4: The BJT in common base configuration in forward active mode with the flow of both holes and
electrons (flux) indicated with arrows. The numbers indicate different physical events explained in the text
below.
At the emitter-base junction holes are injected into the base and electrons are injected from the base into the
emitter. This means that electrons are disappearing out of the base region. If there would be no re-supply of
these disappearing electrons then the density of majority carriers in the base (electrons) would decrease. To
accommodate this decrease in majority carriers while maintaining charge neutrality, the depletion region at
the EB junction has to adapt. This means that the forward biased voltage across the EB junction decreases
and thus reduces the amount of injected carriers. Thus no re-supply of electrons would lower the hole current
to zero. Therefore in order to maintain a collector current, the lost electrons from the base through the
forward biased EB junction has to be re-supplied by an electron base current. This is indicated in the fig. 4
by arrow no 5.
Whilst the injected holes (hole flow in fig. 4) are diffusing through the base, there is a probability for these
holes to recombine with the electrons available in the base region. As a consequence of the recombination
process the number of holes and electrons in the base is decreasing. If the number of electrons in the base is
not re-supplied the charge density relationship in the base would break down and hole current would
disappear. In order to maintain the hole current IC for the given biasing conditions, the base contact has to re-
35 EE2 - Semiconductor Devices 2012
supply the electrons, this is given by arrow no 4. Arrow no 1 represent the injected holes lost for IC through
recombination in the base.
The thermally generated electrons and holes make up the reverse saturation current across the base-collector
junction. The reverse biased BC junction thus supplies electrons to the base. This reduces the amount of
electrons that the base current needs to re-supply. This supply however is found to be dramatically smaller
than the re-supply current and will therefore often be ignored. Arrow no 2 are the holes reaching the
collector.
From this diagram and the need to maintain the given steady state bias conditions, the base current IB can be
found to consist of three terms:
0"' CBBBB IIII −+= (1)
where BI ' = base current to compensate lost carrier injected into the emitter
BI " = base current to re-supply the recombined charge
0CBI = reverse bias leakage current that injects carriers from collector into base (very small)
Thus the base current re-supplies the majority carriers that are lost in the base (neglecting ICB0). If these
would not be re-supplied, charge neutrality is not maintained unless the depletion regions and thus the
voltage drop across the different junctions adapt themselves and thus change the total current IC that is
flowing through the device.
Although this discussion of the different currents is done for the common base configuration, these currents
are exactly the same in the other BJT biasing conditions, common emitter or common collector. The
common base configuration is used because it gives a direct insight into the voltage across each junction EB
and BC separately, making the analysis the same as for the pn diodes we have discussed in chapter 2. Note
that the main difference in analysis is the boundary conditions in the base junctions. These boundary
conditions are imposed by the voltage across each junction rather than an ohmic contact as was the case for a
single pn junction. This means that the minority carrier excess in the base at the depletion region edges will
not be the bulk minority carrier concentration33 but will be determined by the voltage across each junction
and thus determined by the formulae (chapter 1 eq.(1)):






== kT
eV
n
n
p
p
e
p
p
n
n
0
'
0
'
(2)
The variation of the minority carrier concentration will then be dependent on whether recombination has to
be taken into account. Note that a BJT has a short base. However, when recombination is taken into account
in order to more accurately predict the current gain, the variation of the minority carriers in the base has to be
given as in eq. (9) of chapter 2.
To obtain a “good” BJT it is essential to limit the amount of carriers that are lost from the base via
recombination and via the current injected from the base into the emitter. In order to deliver the 1st
requirement the base needs to be made sufficiently narrow and for the 2nd requirement, the emitter needs to
be heavily doped such that carrier injection from emitter to base is a lot larger than carrier injection from
base to emitter. This is the reason why BJTs are a-symmetric – the emitter is more heavily doped than base
and collector.
3.3 Calculating the currents in a BJT
As for the pn diode, we can make the choice of including recombination or not. The choice will depend on
the accuracy that is required and the speed with which derivations and calculations have to be done. In a BJT
under normal active mode (EB forward biased and BC reverse biased) the short diode approximation, in
which recombination is neglected, is often sufficiently accurate to get an idea about device performance.
33 As would be the case for an ohmic contact
36 EE2 - Semiconductor Devices 2012
The derivation of the currents is easy for a BJT in the short diode approximation. It that case, both emitter
and base layers are thin. For a longer base or in case we want to take recombination into account, the
calculations become more complicated. In what follows we will explicitly derive the currents in the case
where recombination is not taken into account and we will look into some of the issues, such as boundary
conditions and shape of the minority carrier concentration in the base, that are a result of recombination.
The short BJT approach
Assumptions:
• No recombination in the emitter and base region34
• The reverse bias collector current into the base is negligible35
• The depletion regions are neglected
In this case and under normal forward active mode, the currents in the emitter base diode determine all the
BJT currents completely. The holes that are diffusing through the base will be collected by the collector and
thus make the collector current. The electrons that are escaping from the base into the emitter have to be re-
supplied by the base current, thus the electron current of the E-B diode defines the base current. The emitter
current is the total current in the E-B diode. This gives the well known result:
IE=IB+IC
A good way to remember this is to draw a BJT symbol with the currents and remember the nodal analysis
techniques that you learned in the EE1 Circuit Analysis course.
Figure 5: Left: A pnp BJT symbol with the directions of the different currents. Right: an npn BJT symbol
with the direction of current.
Apply nodal analysis (sum of current into node = sum of currents out of node) in the base node of fig.5:
For pnp BJT: IE = IC + IB
For npn BJT: IC + IB = IE
34 Whether recombination exists in the collector or not is not important for the derivation of the expression of the current in this
case.
35 This can only be done for forward active mode, when the BJT is OFF, thus EB and BC junctions reverse biased then the reverse
bias leakage current is important from a viewpoint of power consumption in the OFF state.
37 EE2 - Semiconductor Devices 2012
C
E
B
p
p
n IE
IB
IC
C
E
B
n
n
p IE
IB
IC
Figure 6: top: pnp BJT in forward active mode. Bottom: The minority carrier density variation in each layer
for the short BJT. The shaded regions are the depletion regions. Notice that the variation of the density of
the minority carrier concentrations is linear in each (short) layer.
In bipolar devices (thus both electrons and holes play a role in the transport processes) diffusion of minority
carriers are the basis for the calculation of the current. Diffusion happens because there is a carrier gradient.
Thus the first step in the derivation of the current in the BJT is to determine the minority carrier
concentration at each side of the junction for both junctions in the device. This is done in exactly the same
way as in the pn diodes. The result is shown in fig. 6.
In the emitter at the EB junction the injected minority carrier concentration (electrons coming from the base)
is36:






= kT
eV
pp
EB
enn 0' (3)
In the base at the EB junction the injected minority carrier concentration (holes coming from the emitter) is:






= kT
eV
nn
EB
epp 0' (4)
In the base at the BC junction the minority carrier holes are injected to the collector and thus we have a
reduction of the minority carrier concentration in the base at the reverse biased collector:



−
=
kT
Ve
nn epp 0"
(5)
Remember that diffusion currents are directly related to the gradients of the minority carriers. The minority
carrier concentration at the ohmic contact of the emitter and collector imposes the bulk minority carrier
concentration37.
Thus the electron current of the EB diode is given by:
36 Note that the ‘ indicates forward bias and “ reverse bias.
37 Due to infinite generation-recombination rates in ohmic contacts, the contacts can supply and absorb all excess carriers and thus
keep the carrier concentrations constant at bulk conditions.
38 EE2 - Semiconductor Devices 2012
x
p
+
n p
VEB VBC
xe Wb
0pn
mi
no
rit
y
ca
rri
er
co
nc
en
tra
tio
n
pn'
np"
pn"
0pn
np'
105733223 ee2-12
105733223 ee2-12
105733223 ee2-12
105733223 ee2-12
105733223 ee2-12
105733223 ee2-12
105733223 ee2-12
105733223 ee2-12
105733223 ee2-12
105733223 ee2-12
105733223 ee2-12
105733223 ee2-12
105733223 ee2-12
105733223 ee2-12
105733223 ee2-12
105733223 ee2-12
105733223 ee2-12

More Related Content

What's hot

Molecular electronic devices
Molecular electronic devicesMolecular electronic devices
Molecular electronic deviceschitra raju
 
Semiconductor optoelectronic materials
Semiconductor optoelectronic materialsSemiconductor optoelectronic materials
Semiconductor optoelectronic materialskrishslide
 
Comparison between piezoelectric transformer and electromagnetic transformer ...
Comparison between piezoelectric transformer and electromagnetic transformer ...Comparison between piezoelectric transformer and electromagnetic transformer ...
Comparison between piezoelectric transformer and electromagnetic transformer ...TELKOMNIKA JOURNAL
 
Pentacene-Based Organic Field-Effect Transistors: Analytical Model and Simula...
Pentacene-Based Organic Field-Effect Transistors: Analytical Model and Simula...Pentacene-Based Organic Field-Effect Transistors: Analytical Model and Simula...
Pentacene-Based Organic Field-Effect Transistors: Analytical Model and Simula...IDES Editor
 
Application of nanomaterials,assignment one by kunsa
Application of nanomaterials,assignment one by kunsaApplication of nanomaterials,assignment one by kunsa
Application of nanomaterials,assignment one by kunsaKunsaHaho
 
Electonics VBR - Notes
Electonics VBR - NotesElectonics VBR - Notes
Electonics VBR - NotesVijay Raskar
 
Synopsis : Bismuth Sodium Titanate ( A lead free Ferroelectric Material
Synopsis : Bismuth Sodium Titanate ( A lead free Ferroelectric MaterialSynopsis : Bismuth Sodium Titanate ( A lead free Ferroelectric Material
Synopsis : Bismuth Sodium Titanate ( A lead free Ferroelectric MaterialNational Tsing Hua University
 
Dual Metal Gate and Conventional MOSFET at Sub nm for Analog Application
Dual Metal Gate and Conventional MOSFET at Sub nm for Analog ApplicationDual Metal Gate and Conventional MOSFET at Sub nm for Analog Application
Dual Metal Gate and Conventional MOSFET at Sub nm for Analog ApplicationVLSICS Design
 
Semiconductor laser by Kunsa Haho of ethiopia
Semiconductor laser  by Kunsa Haho of ethiopiaSemiconductor laser  by Kunsa Haho of ethiopia
Semiconductor laser by Kunsa Haho of ethiopiaKunsaHaho
 
Performance analysis of cntfet and mosfet focusing channel length, carrier mo...
Performance analysis of cntfet and mosfet focusing channel length, carrier mo...Performance analysis of cntfet and mosfet focusing channel length, carrier mo...
Performance analysis of cntfet and mosfet focusing channel length, carrier mo...IJAMSE Journal
 
Semiconductor devices specialization
Semiconductor devices  specializationSemiconductor devices  specialization
Semiconductor devices specializationAbhishek Sur
 
Investigation of the Piezoelectric Effect as a Means to Generate X-Rays
Investigation of the Piezoelectric Effect as a Means to Generate X-RaysInvestigation of the Piezoelectric Effect as a Means to Generate X-Rays
Investigation of the Piezoelectric Effect as a Means to Generate X-RaysCarlos Bella
 
Fabrication and characterization of printed zinc batteries
Fabrication and characterization of printed zinc batteriesFabrication and characterization of printed zinc batteries
Fabrication and characterization of printed zinc batteriesjournalBEEI
 

What's hot (15)

Molecular electronic devices
Molecular electronic devicesMolecular electronic devices
Molecular electronic devices
 
Semiconductor optoelectronic materials
Semiconductor optoelectronic materialsSemiconductor optoelectronic materials
Semiconductor optoelectronic materials
 
Comparison between piezoelectric transformer and electromagnetic transformer ...
Comparison between piezoelectric transformer and electromagnetic transformer ...Comparison between piezoelectric transformer and electromagnetic transformer ...
Comparison between piezoelectric transformer and electromagnetic transformer ...
 
Pentacene-Based Organic Field-Effect Transistors: Analytical Model and Simula...
Pentacene-Based Organic Field-Effect Transistors: Analytical Model and Simula...Pentacene-Based Organic Field-Effect Transistors: Analytical Model and Simula...
Pentacene-Based Organic Field-Effect Transistors: Analytical Model and Simula...
 
Application of nanomaterials,assignment one by kunsa
Application of nanomaterials,assignment one by kunsaApplication of nanomaterials,assignment one by kunsa
Application of nanomaterials,assignment one by kunsa
 
Electonics VBR - Notes
Electonics VBR - NotesElectonics VBR - Notes
Electonics VBR - Notes
 
1st paper
1st paper1st paper
1st paper
 
Synopsis : Bismuth Sodium Titanate ( A lead free Ferroelectric Material
Synopsis : Bismuth Sodium Titanate ( A lead free Ferroelectric MaterialSynopsis : Bismuth Sodium Titanate ( A lead free Ferroelectric Material
Synopsis : Bismuth Sodium Titanate ( A lead free Ferroelectric Material
 
Dual Metal Gate and Conventional MOSFET at Sub nm for Analog Application
Dual Metal Gate and Conventional MOSFET at Sub nm for Analog ApplicationDual Metal Gate and Conventional MOSFET at Sub nm for Analog Application
Dual Metal Gate and Conventional MOSFET at Sub nm for Analog Application
 
Semiconductor laser by Kunsa Haho of ethiopia
Semiconductor laser  by Kunsa Haho of ethiopiaSemiconductor laser  by Kunsa Haho of ethiopia
Semiconductor laser by Kunsa Haho of ethiopia
 
Performance analysis of cntfet and mosfet focusing channel length, carrier mo...
Performance analysis of cntfet and mosfet focusing channel length, carrier mo...Performance analysis of cntfet and mosfet focusing channel length, carrier mo...
Performance analysis of cntfet and mosfet focusing channel length, carrier mo...
 
Semiconductor devices specialization
Semiconductor devices  specializationSemiconductor devices  specialization
Semiconductor devices specialization
 
Investigation of the Piezoelectric Effect as a Means to Generate X-Rays
Investigation of the Piezoelectric Effect as a Means to Generate X-RaysInvestigation of the Piezoelectric Effect as a Means to Generate X-Rays
Investigation of the Piezoelectric Effect as a Means to Generate X-Rays
 
B sc ama-emtheory
B sc ama-emtheoryB sc ama-emtheory
B sc ama-emtheory
 
Fabrication and characterization of printed zinc batteries
Fabrication and characterization of printed zinc batteriesFabrication and characterization of printed zinc batteries
Fabrication and characterization of printed zinc batteries
 

Viewers also liked

Smart eco hub open day 1
Smart eco hub open day 1Smart eco hub open day 1
Smart eco hub open day 1Conor Annett
 
103775261 bar-exam-case
103775261 bar-exam-case103775261 bar-exam-case
103775261 bar-exam-casehomeworkping7
 
104855788 evidence-case
104855788 evidence-case104855788 evidence-case
104855788 evidence-casehomeworkping7
 
101241052 monolake-case
101241052 monolake-case101241052 monolake-case
101241052 monolake-casehomeworkping7
 
100321536 case-study
100321536 case-study100321536 case-study
100321536 case-studyhomeworkping7
 
162187008 ncba-cases
162187008 ncba-cases162187008 ncba-cases
162187008 ncba-caseshomeworkping7
 
206452716 hr-ll-case-studies
206452716 hr-ll-case-studies206452716 hr-ll-case-studies
206452716 hr-ll-case-studieshomeworkping7
 
105402068 consumer-credit-marketing-system-in-bangladesh-a-case-study-on-dhak...
105402068 consumer-credit-marketing-system-in-bangladesh-a-case-study-on-dhak...105402068 consumer-credit-marketing-system-in-bangladesh-a-case-study-on-dhak...
105402068 consumer-credit-marketing-system-in-bangladesh-a-case-study-on-dhak...homeworkping7
 
104995441 what-is-intellectual-property-law
104995441 what-is-intellectual-property-law104995441 what-is-intellectual-property-law
104995441 what-is-intellectual-property-lawhomeworkping7
 
103317354 1st caselepro-1docx
103317354 1st caselepro-1docx103317354 1st caselepro-1docx
103317354 1st caselepro-1docxhomeworkping7
 
159340607 case-presentation
159340607 case-presentation159340607 case-presentation
159340607 case-presentationhomeworkping7
 
101007314 di-cc-ionary
101007314 di-cc-ionary101007314 di-cc-ionary
101007314 di-cc-ionaryhomeworkping7
 
158428965 apm2009-05att-a-acq-strat-temp07-29-2009
158428965 apm2009-05att-a-acq-strat-temp07-29-2009158428965 apm2009-05att-a-acq-strat-temp07-29-2009
158428965 apm2009-05att-a-acq-strat-temp07-29-2009homeworkping7
 

Viewers also liked (18)

103823344 cc
103823344 cc103823344 cc
103823344 cc
 
Smart eco hub open day 1
Smart eco hub open day 1Smart eco hub open day 1
Smart eco hub open day 1
 
103775261 bar-exam-case
103775261 bar-exam-case103775261 bar-exam-case
103775261 bar-exam-case
 
104855788 evidence-case
104855788 evidence-case104855788 evidence-case
104855788 evidence-case
 
101241052 monolake-case
101241052 monolake-case101241052 monolake-case
101241052 monolake-case
 
100321536 case-study
100321536 case-study100321536 case-study
100321536 case-study
 
162187008 ncba-cases
162187008 ncba-cases162187008 ncba-cases
162187008 ncba-cases
 
206452716 hr-ll-case-studies
206452716 hr-ll-case-studies206452716 hr-ll-case-studies
206452716 hr-ll-case-studies
 
105402068 consumer-credit-marketing-system-in-bangladesh-a-case-study-on-dhak...
105402068 consumer-credit-marketing-system-in-bangladesh-a-case-study-on-dhak...105402068 consumer-credit-marketing-system-in-bangladesh-a-case-study-on-dhak...
105402068 consumer-credit-marketing-system-in-bangladesh-a-case-study-on-dhak...
 
104995441 what-is-intellectual-property-law
104995441 what-is-intellectual-property-law104995441 what-is-intellectual-property-law
104995441 what-is-intellectual-property-law
 
101314655 org-study
101314655 org-study101314655 org-study
101314655 org-study
 
103317354 1st caselepro-1docx
103317354 1st caselepro-1docx103317354 1st caselepro-1docx
103317354 1st caselepro-1docx
 
159340607 case-presentation
159340607 case-presentation159340607 case-presentation
159340607 case-presentation
 
106248842 cc
106248842 cc106248842 cc
106248842 cc
 
101007314 di-cc-ionary
101007314 di-cc-ionary101007314 di-cc-ionary
101007314 di-cc-ionary
 
106590019 case-law
106590019 case-law106590019 case-law
106590019 case-law
 
Cadetproblem 2014
Cadetproblem 2014Cadetproblem 2014
Cadetproblem 2014
 
158428965 apm2009-05att-a-acq-strat-temp07-29-2009
158428965 apm2009-05att-a-acq-strat-temp07-29-2009158428965 apm2009-05att-a-acq-strat-temp07-29-2009
158428965 apm2009-05att-a-acq-strat-temp07-29-2009
 

Similar to 105733223 ee2-12

Quantitative Modeling and Simulation of Single-Electron Transistor
Quantitative Modeling and Simulation of Single-Electron TransistorQuantitative Modeling and Simulation of Single-Electron Transistor
Quantitative Modeling and Simulation of Single-Electron TransistorIRJET Journal
 
A New Full Adder Cell for Molecular Electronics
A New Full Adder Cell for Molecular Electronics  A New Full Adder Cell for Molecular Electronics
A New Full Adder Cell for Molecular Electronics VLSICS Design
 
DESIGN OF DIFFERENT DIGITAL CIRCUITS USING SINGLE ELECTRON DEVICES
DESIGN OF DIFFERENT DIGITAL CIRCUITS USING SINGLE ELECTRON DEVICESDESIGN OF DIFFERENT DIGITAL CIRCUITS USING SINGLE ELECTRON DEVICES
DESIGN OF DIFFERENT DIGITAL CIRCUITS USING SINGLE ELECTRON DEVICESmsejjournal
 
Chapter 07.ppt Electrical conduction
Chapter 07.ppt     Electrical conductionChapter 07.ppt     Electrical conduction
Chapter 07.ppt Electrical conductioncbcbgdfgsdf
 
English for Electric and Electronic Engineering
English for Electric and Electronic EngineeringEnglish for Electric and Electronic Engineering
English for Electric and Electronic EngineeringHOng Thuong Hoang
 
SINGLE ELECTRON TRANSISTOR: APPLICATIONS & PROBLEMS
SINGLE ELECTRON TRANSISTOR: APPLICATIONS & PROBLEMSSINGLE ELECTRON TRANSISTOR: APPLICATIONS & PROBLEMS
SINGLE ELECTRON TRANSISTOR: APPLICATIONS & PROBLEMSVLSICS Design
 
Single Electron Transistor: Applications & Problems
Single Electron Transistor: Applications & Problems  Single Electron Transistor: Applications & Problems
Single Electron Transistor: Applications & Problems VLSICS Design
 
Applications of Nanomaterials.pdf
Applications of Nanomaterials.pdfApplications of Nanomaterials.pdf
Applications of Nanomaterials.pdfFikaduTakele1
 
EC8252 ED NOTES FOR UNIT 1 & 2.pdf
EC8252 ED NOTES FOR UNIT 1 & 2.pdfEC8252 ED NOTES FOR UNIT 1 & 2.pdf
EC8252 ED NOTES FOR UNIT 1 & 2.pdfkabileshsk2
 
The semiconductors.docx
The semiconductors.docxThe semiconductors.docx
The semiconductors.docxmadiana01
 
A Hybrid Model to Predict Electron and Ion Distributions in Entire Interelect...
A Hybrid Model to Predict Electron and Ion Distributions in Entire Interelect...A Hybrid Model to Predict Electron and Ion Distributions in Entire Interelect...
A Hybrid Model to Predict Electron and Ion Distributions in Entire Interelect...Fa-Gung Fan
 
PHYSICAL MODELING AND SIMULATION OF THERMAL HEATING IN VERTICAL INTEGRATED ...
PHYSICAL MODELING AND SIMULATION  OF THERMAL HEATING IN VERTICAL  INTEGRATED ...PHYSICAL MODELING AND SIMULATION  OF THERMAL HEATING IN VERTICAL  INTEGRATED ...
PHYSICAL MODELING AND SIMULATION OF THERMAL HEATING IN VERTICAL INTEGRATED ...ijcses
 
Lecture1 semiconductor doping_vij
Lecture1 semiconductor doping_vijLecture1 semiconductor doping_vij
Lecture1 semiconductor doping_vijjeffmutts
 
Wireless audio transmitter for tv(full report)
Wireless audio transmitter for tv(full report)Wireless audio transmitter for tv(full report)
Wireless audio transmitter for tv(full report)Pawan Gupta
 
Effect of mesh grid structure in reducing hot carrier effect of nmos device s...
Effect of mesh grid structure in reducing hot carrier effect of nmos device s...Effect of mesh grid structure in reducing hot carrier effect of nmos device s...
Effect of mesh grid structure in reducing hot carrier effect of nmos device s...ijcsa
 
Introduction gadgets have gained a lot of attention.pdf
Introduction gadgets have gained a lot of attention.pdfIntroduction gadgets have gained a lot of attention.pdf
Introduction gadgets have gained a lot of attention.pdfbkbk37
 
EC8252 NOTES 3rd to 5th unit_compressed.pdf
EC8252 NOTES 3rd to 5th unit_compressed.pdfEC8252 NOTES 3rd to 5th unit_compressed.pdf
EC8252 NOTES 3rd to 5th unit_compressed.pdfkabileshsk2
 
322253456-NANOELECTRONICS-ppt of engineering
322253456-NANOELECTRONICS-ppt of engineering322253456-NANOELECTRONICS-ppt of engineering
322253456-NANOELECTRONICS-ppt of engineeringt24042567
 

Similar to 105733223 ee2-12 (20)

Quantitative Modeling and Simulation of Single-Electron Transistor
Quantitative Modeling and Simulation of Single-Electron TransistorQuantitative Modeling and Simulation of Single-Electron Transistor
Quantitative Modeling and Simulation of Single-Electron Transistor
 
A New Full Adder Cell for Molecular Electronics
A New Full Adder Cell for Molecular Electronics  A New Full Adder Cell for Molecular Electronics
A New Full Adder Cell for Molecular Electronics
 
DESIGN OF DIFFERENT DIGITAL CIRCUITS USING SINGLE ELECTRON DEVICES
DESIGN OF DIFFERENT DIGITAL CIRCUITS USING SINGLE ELECTRON DEVICESDESIGN OF DIFFERENT DIGITAL CIRCUITS USING SINGLE ELECTRON DEVICES
DESIGN OF DIFFERENT DIGITAL CIRCUITS USING SINGLE ELECTRON DEVICES
 
Chapter 07.ppt Electrical conduction
Chapter 07.ppt     Electrical conductionChapter 07.ppt     Electrical conduction
Chapter 07.ppt Electrical conduction
 
English for Electric and Electronic Engineering
English for Electric and Electronic EngineeringEnglish for Electric and Electronic Engineering
English for Electric and Electronic Engineering
 
SINGLE ELECTRON TRANSISTOR: APPLICATIONS & PROBLEMS
SINGLE ELECTRON TRANSISTOR: APPLICATIONS & PROBLEMSSINGLE ELECTRON TRANSISTOR: APPLICATIONS & PROBLEMS
SINGLE ELECTRON TRANSISTOR: APPLICATIONS & PROBLEMS
 
Single Electron Transistor: Applications & Problems
Single Electron Transistor: Applications & Problems  Single Electron Transistor: Applications & Problems
Single Electron Transistor: Applications & Problems
 
Applications of Nanomaterials.pdf
Applications of Nanomaterials.pdfApplications of Nanomaterials.pdf
Applications of Nanomaterials.pdf
 
EC8252 ED NOTES FOR UNIT 1 & 2.pdf
EC8252 ED NOTES FOR UNIT 1 & 2.pdfEC8252 ED NOTES FOR UNIT 1 & 2.pdf
EC8252 ED NOTES FOR UNIT 1 & 2.pdf
 
The semiconductors.docx
The semiconductors.docxThe semiconductors.docx
The semiconductors.docx
 
A Hybrid Model to Predict Electron and Ion Distributions in Entire Interelect...
A Hybrid Model to Predict Electron and Ion Distributions in Entire Interelect...A Hybrid Model to Predict Electron and Ion Distributions in Entire Interelect...
A Hybrid Model to Predict Electron and Ion Distributions in Entire Interelect...
 
PHYSICAL MODELING AND SIMULATION OF THERMAL HEATING IN VERTICAL INTEGRATED ...
PHYSICAL MODELING AND SIMULATION  OF THERMAL HEATING IN VERTICAL  INTEGRATED ...PHYSICAL MODELING AND SIMULATION  OF THERMAL HEATING IN VERTICAL  INTEGRATED ...
PHYSICAL MODELING AND SIMULATION OF THERMAL HEATING IN VERTICAL INTEGRATED ...
 
Lecture1 semiconductor doping_vij
Lecture1 semiconductor doping_vijLecture1 semiconductor doping_vij
Lecture1 semiconductor doping_vij
 
NANOELECTRONICS-ppt.ppt
NANOELECTRONICS-ppt.pptNANOELECTRONICS-ppt.ppt
NANOELECTRONICS-ppt.ppt
 
Wireless audio transmitter for tv(full report)
Wireless audio transmitter for tv(full report)Wireless audio transmitter for tv(full report)
Wireless audio transmitter for tv(full report)
 
Effect of mesh grid structure in reducing hot carrier effect of nmos device s...
Effect of mesh grid structure in reducing hot carrier effect of nmos device s...Effect of mesh grid structure in reducing hot carrier effect of nmos device s...
Effect of mesh grid structure in reducing hot carrier effect of nmos device s...
 
Introduction gadgets have gained a lot of attention.pdf
Introduction gadgets have gained a lot of attention.pdfIntroduction gadgets have gained a lot of attention.pdf
Introduction gadgets have gained a lot of attention.pdf
 
Molecular Electronics
Molecular ElectronicsMolecular Electronics
Molecular Electronics
 
EC8252 NOTES 3rd to 5th unit_compressed.pdf
EC8252 NOTES 3rd to 5th unit_compressed.pdfEC8252 NOTES 3rd to 5th unit_compressed.pdf
EC8252 NOTES 3rd to 5th unit_compressed.pdf
 
322253456-NANOELECTRONICS-ppt of engineering
322253456-NANOELECTRONICS-ppt of engineering322253456-NANOELECTRONICS-ppt of engineering
322253456-NANOELECTRONICS-ppt of engineering
 

More from homeworkping7

207797480 effective-study-skills-3
207797480 effective-study-skills-3207797480 effective-study-skills-3
207797480 effective-study-skills-3homeworkping7
 
207745685 b-777-oral-study
207745685 b-777-oral-study207745685 b-777-oral-study
207745685 b-777-oral-studyhomeworkping7
 
207702106 spec-pro-cases
207702106 spec-pro-cases207702106 spec-pro-cases
207702106 spec-pro-caseshomeworkping7
 
207619526 urc-case-study
207619526 urc-case-study207619526 urc-case-study
207619526 urc-case-studyhomeworkping7
 
207528705 family-case-study-1
207528705 family-case-study-1207528705 family-case-study-1
207528705 family-case-study-1homeworkping7
 
207492751 examples-of-unethical-behavior-in-the-workplace
207492751 examples-of-unethical-behavior-in-the-workplace207492751 examples-of-unethical-behavior-in-the-workplace
207492751 examples-of-unethical-behavior-in-the-workplacehomeworkping7
 
207372012 long-case-rawalo-dedi
207372012 long-case-rawalo-dedi207372012 long-case-rawalo-dedi
207372012 long-case-rawalo-dedihomeworkping7
 
207287040 a-study-on-impact-of-ites-sectors-in-india
207287040 a-study-on-impact-of-ites-sectors-in-india207287040 a-study-on-impact-of-ites-sectors-in-india
207287040 a-study-on-impact-of-ites-sectors-in-indiahomeworkping7
 
207285085 classic-knitwear-case-study
207285085 classic-knitwear-case-study207285085 classic-knitwear-case-study
207285085 classic-knitwear-case-studyhomeworkping7
 
207244508 united-color-of-benaton
207244508 united-color-of-benaton207244508 united-color-of-benaton
207244508 united-color-of-benatonhomeworkping7
 
207135483 oblicon-case-digestsxavier
207135483 oblicon-case-digestsxavier207135483 oblicon-case-digestsxavier
207135483 oblicon-case-digestsxavierhomeworkping7
 
207095812 supply-chain-management
207095812 supply-chain-management207095812 supply-chain-management
207095812 supply-chain-managementhomeworkping7
 
207043126 ikea-case-study-solution
207043126 ikea-case-study-solution207043126 ikea-case-study-solution
207043126 ikea-case-study-solutionhomeworkping7
 
206915421 avatar-case-study
206915421 avatar-case-study206915421 avatar-case-study
206915421 avatar-case-studyhomeworkping7
 
206891661 ee2002-lab-manual-fall-2013
206891661 ee2002-lab-manual-fall-2013206891661 ee2002-lab-manual-fall-2013
206891661 ee2002-lab-manual-fall-2013homeworkping7
 
206885611 eskom-ee-simama-ranta-2014
206885611 eskom-ee-simama-ranta-2014206885611 eskom-ee-simama-ranta-2014
206885611 eskom-ee-simama-ranta-2014homeworkping7
 
206883782 lawyers-fiduciary-obligations
206883782 lawyers-fiduciary-obligations206883782 lawyers-fiduciary-obligations
206883782 lawyers-fiduciary-obligationshomeworkping7
 
206869083 ortho-study-guide
206869083 ortho-study-guide206869083 ortho-study-guide
206869083 ortho-study-guidehomeworkping7
 

More from homeworkping7 (20)

207797480 effective-study-skills-3
207797480 effective-study-skills-3207797480 effective-study-skills-3
207797480 effective-study-skills-3
 
207745685 b-777-oral-study
207745685 b-777-oral-study207745685 b-777-oral-study
207745685 b-777-oral-study
 
207702106 spec-pro-cases
207702106 spec-pro-cases207702106 spec-pro-cases
207702106 spec-pro-cases
 
207619526 urc-case-study
207619526 urc-case-study207619526 urc-case-study
207619526 urc-case-study
 
207528705 family-case-study-1
207528705 family-case-study-1207528705 family-case-study-1
207528705 family-case-study-1
 
207492751 examples-of-unethical-behavior-in-the-workplace
207492751 examples-of-unethical-behavior-in-the-workplace207492751 examples-of-unethical-behavior-in-the-workplace
207492751 examples-of-unethical-behavior-in-the-workplace
 
207402181 ee-ass1
207402181 ee-ass1207402181 ee-ass1
207402181 ee-ass1
 
207372012 long-case-rawalo-dedi
207372012 long-case-rawalo-dedi207372012 long-case-rawalo-dedi
207372012 long-case-rawalo-dedi
 
207287040 a-study-on-impact-of-ites-sectors-in-india
207287040 a-study-on-impact-of-ites-sectors-in-india207287040 a-study-on-impact-of-ites-sectors-in-india
207287040 a-study-on-impact-of-ites-sectors-in-india
 
207285085 classic-knitwear-case-study
207285085 classic-knitwear-case-study207285085 classic-knitwear-case-study
207285085 classic-knitwear-case-study
 
207244508 united-color-of-benaton
207244508 united-color-of-benaton207244508 united-color-of-benaton
207244508 united-color-of-benaton
 
207137236 ee2207-lm
207137236 ee2207-lm207137236 ee2207-lm
207137236 ee2207-lm
 
207135483 oblicon-case-digestsxavier
207135483 oblicon-case-digestsxavier207135483 oblicon-case-digestsxavier
207135483 oblicon-case-digestsxavier
 
207095812 supply-chain-management
207095812 supply-chain-management207095812 supply-chain-management
207095812 supply-chain-management
 
207043126 ikea-case-study-solution
207043126 ikea-case-study-solution207043126 ikea-case-study-solution
207043126 ikea-case-study-solution
 
206915421 avatar-case-study
206915421 avatar-case-study206915421 avatar-case-study
206915421 avatar-case-study
 
206891661 ee2002-lab-manual-fall-2013
206891661 ee2002-lab-manual-fall-2013206891661 ee2002-lab-manual-fall-2013
206891661 ee2002-lab-manual-fall-2013
 
206885611 eskom-ee-simama-ranta-2014
206885611 eskom-ee-simama-ranta-2014206885611 eskom-ee-simama-ranta-2014
206885611 eskom-ee-simama-ranta-2014
 
206883782 lawyers-fiduciary-obligations
206883782 lawyers-fiduciary-obligations206883782 lawyers-fiduciary-obligations
206883782 lawyers-fiduciary-obligations
 
206869083 ortho-study-guide
206869083 ortho-study-guide206869083 ortho-study-guide
206869083 ortho-study-guide
 

Recently uploaded

Sociology 101 Demonstration of Learning Exhibit
Sociology 101 Demonstration of Learning ExhibitSociology 101 Demonstration of Learning Exhibit
Sociology 101 Demonstration of Learning Exhibitjbellavia9
 
The basics of sentences session 3pptx.pptx
The basics of sentences session 3pptx.pptxThe basics of sentences session 3pptx.pptx
The basics of sentences session 3pptx.pptxheathfieldcps1
 
Seal of Good Local Governance (SGLG) 2024Final.pptx
Seal of Good Local Governance (SGLG) 2024Final.pptxSeal of Good Local Governance (SGLG) 2024Final.pptx
Seal of Good Local Governance (SGLG) 2024Final.pptxnegromaestrong
 
Making and Justifying Mathematical Decisions.pdf
Making and Justifying Mathematical Decisions.pdfMaking and Justifying Mathematical Decisions.pdf
Making and Justifying Mathematical Decisions.pdfChris Hunter
 
Presentation by Andreas Schleicher Tackling the School Absenteeism Crisis 30 ...
Presentation by Andreas Schleicher Tackling the School Absenteeism Crisis 30 ...Presentation by Andreas Schleicher Tackling the School Absenteeism Crisis 30 ...
Presentation by Andreas Schleicher Tackling the School Absenteeism Crisis 30 ...EduSkills OECD
 
Key note speaker Neum_Admir Softic_ENG.pdf
Key note speaker Neum_Admir Softic_ENG.pdfKey note speaker Neum_Admir Softic_ENG.pdf
Key note speaker Neum_Admir Softic_ENG.pdfAdmir Softic
 
This PowerPoint helps students to consider the concept of infinity.
This PowerPoint helps students to consider the concept of infinity.This PowerPoint helps students to consider the concept of infinity.
This PowerPoint helps students to consider the concept of infinity.christianmathematics
 
TỔNG ÔN TẬP THI VÀO LỚP 10 MÔN TIẾNG ANH NĂM HỌC 2023 - 2024 CÓ ĐÁP ÁN (NGỮ Â...
TỔNG ÔN TẬP THI VÀO LỚP 10 MÔN TIẾNG ANH NĂM HỌC 2023 - 2024 CÓ ĐÁP ÁN (NGỮ Â...TỔNG ÔN TẬP THI VÀO LỚP 10 MÔN TIẾNG ANH NĂM HỌC 2023 - 2024 CÓ ĐÁP ÁN (NGỮ Â...
TỔNG ÔN TẬP THI VÀO LỚP 10 MÔN TIẾNG ANH NĂM HỌC 2023 - 2024 CÓ ĐÁP ÁN (NGỮ Â...Nguyen Thanh Tu Collection
 
The basics of sentences session 2pptx copy.pptx
The basics of sentences session 2pptx copy.pptxThe basics of sentences session 2pptx copy.pptx
The basics of sentences session 2pptx copy.pptxheathfieldcps1
 
Z Score,T Score, Percential Rank and Box Plot Graph
Z Score,T Score, Percential Rank and Box Plot GraphZ Score,T Score, Percential Rank and Box Plot Graph
Z Score,T Score, Percential Rank and Box Plot GraphThiyagu K
 
Measures of Dispersion and Variability: Range, QD, AD and SD
Measures of Dispersion and Variability: Range, QD, AD and SDMeasures of Dispersion and Variability: Range, QD, AD and SD
Measures of Dispersion and Variability: Range, QD, AD and SDThiyagu K
 
Web & Social Media Analytics Previous Year Question Paper.pdf
Web & Social Media Analytics Previous Year Question Paper.pdfWeb & Social Media Analytics Previous Year Question Paper.pdf
Web & Social Media Analytics Previous Year Question Paper.pdfJayanti Pande
 
Holdier Curriculum Vitae (April 2024).pdf
Holdier Curriculum Vitae (April 2024).pdfHoldier Curriculum Vitae (April 2024).pdf
Holdier Curriculum Vitae (April 2024).pdfagholdier
 
Role Of Transgenic Animal In Target Validation-1.pptx
Role Of Transgenic Animal In Target Validation-1.pptxRole Of Transgenic Animal In Target Validation-1.pptx
Role Of Transgenic Animal In Target Validation-1.pptxNikitaBankoti2
 
Python Notes for mca i year students osmania university.docx
Python Notes for mca i year students osmania university.docxPython Notes for mca i year students osmania university.docx
Python Notes for mca i year students osmania university.docxRamakrishna Reddy Bijjam
 
Class 11th Physics NEET formula sheet pdf
Class 11th Physics NEET formula sheet pdfClass 11th Physics NEET formula sheet pdf
Class 11th Physics NEET formula sheet pdfAyushMahapatra5
 
Unit-IV; Professional Sales Representative (PSR).pptx
Unit-IV; Professional Sales Representative (PSR).pptxUnit-IV; Professional Sales Representative (PSR).pptx
Unit-IV; Professional Sales Representative (PSR).pptxVishalSingh1417
 
Russian Escort Service in Delhi 11k Hotel Foreigner Russian Call Girls in Delhi
Russian Escort Service in Delhi 11k Hotel Foreigner Russian Call Girls in DelhiRussian Escort Service in Delhi 11k Hotel Foreigner Russian Call Girls in Delhi
Russian Escort Service in Delhi 11k Hotel Foreigner Russian Call Girls in Delhikauryashika82
 

Recently uploaded (20)

Sociology 101 Demonstration of Learning Exhibit
Sociology 101 Demonstration of Learning ExhibitSociology 101 Demonstration of Learning Exhibit
Sociology 101 Demonstration of Learning Exhibit
 
The basics of sentences session 3pptx.pptx
The basics of sentences session 3pptx.pptxThe basics of sentences session 3pptx.pptx
The basics of sentences session 3pptx.pptx
 
Seal of Good Local Governance (SGLG) 2024Final.pptx
Seal of Good Local Governance (SGLG) 2024Final.pptxSeal of Good Local Governance (SGLG) 2024Final.pptx
Seal of Good Local Governance (SGLG) 2024Final.pptx
 
Making and Justifying Mathematical Decisions.pdf
Making and Justifying Mathematical Decisions.pdfMaking and Justifying Mathematical Decisions.pdf
Making and Justifying Mathematical Decisions.pdf
 
Presentation by Andreas Schleicher Tackling the School Absenteeism Crisis 30 ...
Presentation by Andreas Schleicher Tackling the School Absenteeism Crisis 30 ...Presentation by Andreas Schleicher Tackling the School Absenteeism Crisis 30 ...
Presentation by Andreas Schleicher Tackling the School Absenteeism Crisis 30 ...
 
Key note speaker Neum_Admir Softic_ENG.pdf
Key note speaker Neum_Admir Softic_ENG.pdfKey note speaker Neum_Admir Softic_ENG.pdf
Key note speaker Neum_Admir Softic_ENG.pdf
 
This PowerPoint helps students to consider the concept of infinity.
This PowerPoint helps students to consider the concept of infinity.This PowerPoint helps students to consider the concept of infinity.
This PowerPoint helps students to consider the concept of infinity.
 
TỔNG ÔN TẬP THI VÀO LỚP 10 MÔN TIẾNG ANH NĂM HỌC 2023 - 2024 CÓ ĐÁP ÁN (NGỮ Â...
TỔNG ÔN TẬP THI VÀO LỚP 10 MÔN TIẾNG ANH NĂM HỌC 2023 - 2024 CÓ ĐÁP ÁN (NGỮ Â...TỔNG ÔN TẬP THI VÀO LỚP 10 MÔN TIẾNG ANH NĂM HỌC 2023 - 2024 CÓ ĐÁP ÁN (NGỮ Â...
TỔNG ÔN TẬP THI VÀO LỚP 10 MÔN TIẾNG ANH NĂM HỌC 2023 - 2024 CÓ ĐÁP ÁN (NGỮ Â...
 
The basics of sentences session 2pptx copy.pptx
The basics of sentences session 2pptx copy.pptxThe basics of sentences session 2pptx copy.pptx
The basics of sentences session 2pptx copy.pptx
 
Z Score,T Score, Percential Rank and Box Plot Graph
Z Score,T Score, Percential Rank and Box Plot GraphZ Score,T Score, Percential Rank and Box Plot Graph
Z Score,T Score, Percential Rank and Box Plot Graph
 
Measures of Dispersion and Variability: Range, QD, AD and SD
Measures of Dispersion and Variability: Range, QD, AD and SDMeasures of Dispersion and Variability: Range, QD, AD and SD
Measures of Dispersion and Variability: Range, QD, AD and SD
 
INDIA QUIZ 2024 RLAC DELHI UNIVERSITY.pptx
INDIA QUIZ 2024 RLAC DELHI UNIVERSITY.pptxINDIA QUIZ 2024 RLAC DELHI UNIVERSITY.pptx
INDIA QUIZ 2024 RLAC DELHI UNIVERSITY.pptx
 
Web & Social Media Analytics Previous Year Question Paper.pdf
Web & Social Media Analytics Previous Year Question Paper.pdfWeb & Social Media Analytics Previous Year Question Paper.pdf
Web & Social Media Analytics Previous Year Question Paper.pdf
 
Holdier Curriculum Vitae (April 2024).pdf
Holdier Curriculum Vitae (April 2024).pdfHoldier Curriculum Vitae (April 2024).pdf
Holdier Curriculum Vitae (April 2024).pdf
 
Role Of Transgenic Animal In Target Validation-1.pptx
Role Of Transgenic Animal In Target Validation-1.pptxRole Of Transgenic Animal In Target Validation-1.pptx
Role Of Transgenic Animal In Target Validation-1.pptx
 
Asian American Pacific Islander Month DDSD 2024.pptx
Asian American Pacific Islander Month DDSD 2024.pptxAsian American Pacific Islander Month DDSD 2024.pptx
Asian American Pacific Islander Month DDSD 2024.pptx
 
Python Notes for mca i year students osmania university.docx
Python Notes for mca i year students osmania university.docxPython Notes for mca i year students osmania university.docx
Python Notes for mca i year students osmania university.docx
 
Class 11th Physics NEET formula sheet pdf
Class 11th Physics NEET formula sheet pdfClass 11th Physics NEET formula sheet pdf
Class 11th Physics NEET formula sheet pdf
 
Unit-IV; Professional Sales Representative (PSR).pptx
Unit-IV; Professional Sales Representative (PSR).pptxUnit-IV; Professional Sales Representative (PSR).pptx
Unit-IV; Professional Sales Representative (PSR).pptx
 
Russian Escort Service in Delhi 11k Hotel Foreigner Russian Call Girls in Delhi
Russian Escort Service in Delhi 11k Hotel Foreigner Russian Call Girls in DelhiRussian Escort Service in Delhi 11k Hotel Foreigner Russian Call Girls in Delhi
Russian Escort Service in Delhi 11k Hotel Foreigner Russian Call Girls in Delhi
 

105733223 ee2-12

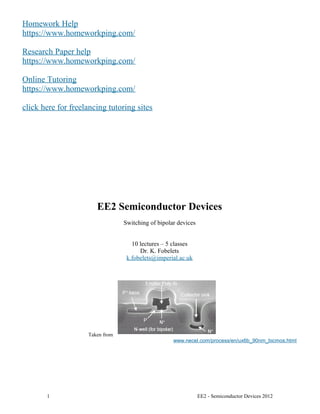
  • 1. Homework Help https://www.homeworkping.com/ Research Paper help https://www.homeworkping.com/ Online Tutoring https://www.homeworkping.com/ click here for freelancing tutoring sites EE2 Semiconductor Devices Switching of bipolar devices 10 lectures – 5 classes Dr. K. Fobelets k.fobelets@imperial.ac.uk Taken from www.necel.com/process/en/ux6b_90nm_bicmos.html 1 EE2 - Semiconductor Devices 2012
  • 2. The course aims: (1) To review the operation of diodes and bipolar junction transistors. (2) To extend knowledge on bipolar devices to include the influence of recombination. (3) To investigate the physical mechanisms underlying the delays and speed limitations of the devices. (4) To extract equivalent circuit models for the devices. Objectives: Students should be able to (1) Explain qualitatively the mechanisms of electronic conduction in bipolar devices, and calculate relevant quantities from given data. (2) Calculate and explain DC current-voltage behaviour of diodes and BJTs, given their geometry and material properties. (3) Explain the influence of excess minority carrier recombination of the performance of the devices. (4) Explain the large signal behaviour of the devices from the internal storage of charge. Recommended textbooks EE1 background knowledge on semiconductors and semiconductor devices is required. The EE1 course notes can be found on blackboard. It is strongly recommended that you read these notes in order to understand the basic principles of semiconductor devices. “Solid State Electronic Devices”, B.G. Streetman & S. K. Banerjee, Prentice Hall International Editions, 6th ed. This is a more expensive book but the course is based on this book. It contains a lot more than what is taught in the 1st and 2nd year. “Microelectronic Devices”, K.D. Leaver, IC Press, 2nd ed. This is a compact and relatively inexpensive book which covers all the essentials. Note that in popular books such as “Microelectronics circuits” by Sedra & Smith some very brief descriptions of semiconductor device operation can be found. Whilst previous two books are very physics oriented, this book is more oriented towards the circuit engineer and thus might give additional insight. There are plenty of copies available of all these books in the Central Library. An interesting on-line text books can be found on: http://ecee.colorado.edu/~bart/book/book/contents.htm http://www.ecse.rpi.edu/~schubert/Course-ECSE-2210-Microelectronics-Technology-2010/ Course synopsis 2 EE2 - Semiconductor Devices 2012
  • 3. 1. Revision on semiconductor devices Last year you studied the DC behaviour of metal-semiconductor, metal-oxide-semiconductor and semiconductor-semiconductor junctions. We looked at the simplified version of three devices: the pn junction, the MOSFET and the BJT. We will start the course with reviewing the basic device DC operation concepts of the pn diode and the BJT because this year we will focus on bipolar devices. For more extensive information on MOSFETs please see the 3rd year Advanced Electronics Devices course1. 2. Long pn diode In contrast to the “short” devices we’ve studied in the first year, this year we will introduce recombination processes and check how they influence device behaviour. These devices will be referred to as “long” devices. Although an important characteristic of semiconductor devices is their fast response time, some delays do occur. We will investigate the physics behind the delays and investigate the resulting switching characteristics. The concept of a fast switching majority carrier device and a “slowly” switching minority carrier device will be made clear. 3. The BJT An npn or pnp junction is the basis for the bipolar junction transistor (BJT). Based on our knowledge of pn junctions, the DC functioning of a BJT will be described. As in pn junctions, minority carriers will play an important role in the conduction mechanism of the BJT. We will look explicitly at the short BJT and discover that calculating the currents in this particular configuration is very straightforward. The BJT in which recombination is taken into account offers some challenging maths but gives an insight into delays and current gain. Switching of the BJT will also be studied and methods to reduce the delay discussed. Why study semiconductor devices? There can be lots of reasons to study devices. It can be as simple as being interested in the physics behind the devices’ operation or it can give you the background to understand the aggressive downscaling effort of the CMOS industry and maybe in the future you can join in the effort. Having knowledge of the operation of devices will enable you to understand both device and circuit modelling programs better and thus make modelling and the resulting circuits more efficient. Although the speed of the aggressively downscaled MOSFET2 has removed the need for bipolar transistors from logic circuits, microprocessors and memory chip, there are still some fields in which bipolar transistors remain important. These applications mainly need ultra-high speed in which minimizing power consumption is not so important. Examples are emitter coupled logic, power switching, microwave power amplifiers, cell phone amplifiers etc. This course fills the semiconductor knowledge gap between the 1st year Semiconductor Devices course and the 3rd year Advanced Electronics Devices course as it focuses more on bipolar devices than these other two courses. Knowledge of bipolar transistors is also important for courses such as Microwave Technology, Radio Frequency Electronics, Power Electronics, High Performance Analogue Electronics and Analogue Integrated Circuits and Systems. 1 On blackboard 2 See the yr3 Advanced Electronics Devices course 3 EE2 - Semiconductor Devices 2012
  • 4. 1 Semiconductors and junctions – a review 1.1 A semiconductor • A semiconductor is a material that, at room temperature, has a conduction character that is lower than metals but higher than insulators. This is because a semiconductor always has at least an intrinsic carrier concentration: ni. • There exist two types of charged carriers in a semiconductor that can both carry current: the electrons with a negative charge and the holes with a positive charge: eVCeq 1106.1 19 ±=±=±= − . Only “free” charges can carry currents. “Free” means not bonded to the atoms. • The conduction in a semiconductor can be changed via doping. Doping is the introduction of foreign atoms such as B or As in Si. Doping with donors: ND (donor concentration) gives an n-type semiconductor. Thus the density of free electrons nn is larger than the density of free holes pn in an n- type material. Doping with acceptors: NA (acceptor concentration) gives a p-type material. The density of free holes pp is larger than the density of free electrons np 3. Important formulae that govern the conductivity of a semiconductor are: The intrinsic carrier concentration: ii pn = (same density of free electrons and holes in an intrinsic semiconductor). The extrinsic n-type semiconductor:      = = D i n Dn N n p Nn 2 The extrinsic p-type semiconductor      = = Ap A i p Np N n n 2 With n, p respectively the electron and hole density ; ND,A respectively the donor and acceptor doping density (concentration). The total conductivity of a semiconductor is: ( )pntot pne µµσ += With µn, µp the mobility of electrons, resp. holes. The value of the mobility is a function of the scattering processes and the effective mass of the carriers: m qτ µ = , with q the charge, τ the average time between collisions (scattering), m the mass. Thus the hole and electron mobility are not necessarily the same. The mobility gives an indication into how fast a device will work (when parasitic influences are negligible). The mobility is the proportionality constant in the drift velocity-electric field relationship for small values of electric field: Ev µ= , with v the drift velocity and E the electric field. Electrons and holes have opposite velocities. * Drift currents In a homogeneously doped semiconductor or a semiconductor with a constant carrier density, applying an electric field will cause drift currents to flow. Drift current can be carried by both electrons and holes. Drift current in a semiconductor is given by: ( )EpneAAEI pntottot µµσ +== With A the cross sectional area perpendicular to the current flow, E is the applied electric field. Remember that the electric field can also be internal to the device structure. * Diffusion currents When carrier gradients exist in a semiconductor, diffusion currents will occur. Hole density gradients cause 3 The subscript indicates the material type. n is the symbol for electron concentration, p for the hole concentration. Units are cm-3. 4 EE2 - Semiconductor Devices 2012
  • 5. hole diffusion currents, electron density gradients cause electron diffusion currents and gradients in both carrier types will cause diffusion of both, creating a total diffusion current of4:       −= dx dp D dx dn DeAI pntot With Dn,p the diffusion constant of electrons respectively holes, x is the direction of carrier propagation. The Einstein equation gives the relationship between the diffusion constant and the mobility of the carrier: e kTD = µ with, k the Boltzman constant, T the temperature in Kelvin. * In the general case where both concentration gradients and electric fields are present the total current is the sum of both drift and diffusion currents:       −++= dx dp D dx dn DEpEneAI pnpntot µµ This equation is normally referred to as the drift-diffusion equation of carriers and is the basic equation that describes carrier movement in semiconductor devices. E(x) Jn drift Jp drift n(x) Jn diff p(x) Jp diff Figure 1: the direction of the current densities as a function of the electric field and the carrier gradient. Note that the direction of the electron particle flux is opposite to the current flow. Particle flux is strictly governed by electrostatics, the current is dependent on the sign of the charge q=±e. The third important basic equation in semiconductor devices is the Poisson equation5: ( )−+ −+−−=−= AD NNnp ex dx Vd εε ρ )( 2 2 With V the electrostatic potential, ρ the charge density as a function of x ; p & n the free hole, resp. electron density which are both a function of x as well as of V and −+ AD NN & the concentration of ionised doping atoms which are a function of x. 1.2 Energy band diagrams The carriers in a semiconductor are quasi free because they are no longer covalently bonded to the atoms and thus can move but at the same time they undergo interactions with the atoms in the regular lattice. As a consequence of the mathematical description of the wave character of carriers in semiconductors, a region of forbidden energies exists called the bandgap Eg. In a perfect semiconductor there are no energy levels available within the bandgap. This means that no electrons nor holes can reside in the energy region defined by the bandgap. Free electrons have energies in an allowed energy band higher in energy than the bandgap, the conduction band Ec, whilst free holes have energies in an allowed energy band lower in energy than the bandgap, the valence band Ev. 4 In one dimension. 5 In one dimension. 5 EE2 - Semiconductor Devices 2012
  • 6. The amount of electrons available at each energy value is determined by the density of states g(E) and the Fermi-Dirac distribution function f(E) as illustrated in Figure 2. g(E) gives the distribution of energy levels (states) as a function of energy. Note that g(E)=0 in the bandgap (no energy levels). f(E) gives the probability of finding an electron at energy E. Thus 1-f(E) gives the probability of finding a hole. Figure 2: The energy band diagram with the position of the Fermi level EF as a function of the doping type (left). The integration of the product of the density of states g(E) and the Fermi-Dirac distribution function f(E) gives the carrier distribution over the energy range above or below the bandgap (right). Remember the relationship between the position of the Fermi level EF and the density of carriers in the semiconductor (given by the Fermi-Dirac or Maxwell-Boltzman distribution functions): ( ) ( ) ( ) ( ) kT EE ci kT EE c kT EE vi kT EE v cicF ivFv eNneNn eNpeNp −− −− == == and and with Ei the intrinsic level6, Nc the effective density of states in the conduction band and Nv the effective density of states in the valence band. The intrinsic level Ei is an energy position within the forbidden gap that is determined by the intrinsic carrier concentration. * Fermi level constant At equilibrium, when no external bias is applied, no discontinuity or gradient can arise in the position of the Fermi level throughout the complete structure, otherwise a current (diffusion of high energy carriers to lower energetic places) would flow. Thus: 0= dx dEF for Vext=0. 6 The intrinsic level Ei is the Fermi level position for the case of an intrinsic semiconductor. The introduction of this level (not a state!) makes some calculations more straightforward. 6 EE2 - Semiconductor Devices 2012 EF E 1/2 F(E)1 E E Ec Ev g(E) carrier concentration a) intrinsic electrons holes EF E 1/2 F(E)1 E E Ec Ev g(E) carrier concentration b) n-type electrons holes EF E 1/2 F(E)1 E E Ec Ev g(E) carrier concentration c) p-type electrons holes Extrinsic semiconductor Intrinsic semiconductor g(E) Density of states F(E) Fermi-Dirac distribution function T>0K
  • 7. This gives the starting point for drawing the energy band diagram since Ec-EF and/or EF-Ev is known from the doping concentration and Eg is known and remains constant in a homojunction. * Influence of the electric field on the band diagram Applying an electric field will result in a discontinuity in the Fermi level (this discontinuity is directly proportional to the applied electric field) and will result in band bending (see the tilt in potential energy Ec in Fig. 3). Figure 3: Relationship between the electric field, the electrostatic potential and the potential energy. dx dE edx dV xE c1 )( −= − = E(x): Electric field, V(x): electrostatic potential, Ec(x): potential energy. Electric field E(x) points “uphill”, electrons drift “downhill”. The reasoning is that electrons will flow from v- to v+ (electrostatic attraction). This means that electrons are losing potential energy since it is converted in kinetic energy, thus Ec at v- needs to be higher than Ec at v+. The electric field points from + to – and thus up the potential hill. Holes are flowing up the potential hill. You can check that this picture is completely consistent with the carrier fluxes and current directions that have been discussed before. It is also comforting to see that these directions are completely consistent with current directions used in the other courses such as Analysis of Circuits and Analogue Electronics! 1.3. Junctions * A junction is formed when 2 or more different materials are brought into close (atomic scale) contact. Materials can include semiconductors of different doping type (homojunctions), different materials (e.g. Si and SiGe) heterojunctions and metal-semiconductor junctions (e.g. Ohmic contact and Schottky contact). * The work function φ In order to draw an energy band diagram of a junction we need to draw the energy bands of each material separately with respect of a local reference level that is defined for each material, the vacuum level Evac. The position of the Fermi level with respect to the vacuum level, before contact of the material, is given by the workfunction φ. Diffusion of electrons will appear from the material with the higher lying Fermi level to the material with the lower lying Fermi level. This process will align the Fermi levels and create band bending in the potential energy bands. The reason why band bending is created is due to the fact that no net current can be flowing when no external bias is applied, thus the diffusion of carriers needs to be compensated. This is done by drift of carriers which is caused by the build-up of an internal electric field that creates a drift current opposite to the diffusion current and allows the system to reach equilibrium. Note that the workfunction of the materials does not change when the junction is formed. As a result the internal electric field occurs in the vacuum level across the junction – this is called the contact potential or built-in voltage. * Band diagram of junctions 7 EE2 - Semiconductor Devices 2012 en er gy distance E(x): electric field Ec Ev v+ v- EF- Ec Ev EF+
  • 8. When two different conducting materials, initially uncharged, are brought into contact, the electrons close to the junction redistribute themselves so that the Fermi energy is constant across the junction (in the absence of an applied voltage). Below we present different junctions with their energy band diagrams before and after contact, all without external bias. Ensure that you understand how they are generated. Metal-semiconductor junctions Ohmic contact metal-semiconductor junction EFm EFs Ec Ev metal p-type EF - - + + metal p Ec Ev ohmic contact Figure 4: The Energy band diagram of a metal and a p-type semiconductor. Left: before contact, right: after contact. For Ohmic contacts there should be an accumulation of majority carriers at the junction. Right: The current-voltage characteristic of the Ohmic contact is linear. The current-voltage characteristic of this junction is linear. The slope of the curve is proportional to the conductivity of the semiconductor and the resistance of the Ohmic contact: IRV RRR tot torsemiconduccontacttot = += 2 Schottky contact In fig. 5 a Schottky contact on an n-type semiconductor is given. Left (bottom) is the energy band diagram when no voltage is applied. Notice the bands bend up (depletion of electrons closer to the junction). At the right (top) a positive voltage is applied to the metal with respect to the semiconductor. This causes a discontinuity of the Fermi level at the junction (EF goes down in energy due to positive voltage, and the internal electric field across the semiconductor of the junction is reduced by the externally applied field and thus the barrier lowers). The electrons in the n-type material try to cross the junction towards the metal but are not allowed to go through the wide forbidden bandgap. Thus the only electrons that can contribute to the current are the ones above the potential barrier and this is only a small amount thus the current flowing at this voltage will be small. 8 EE2 - Semiconductor Devices 2012 metal l -semiconductor junction EFm EF s Ec Ev metal n-type EF - - + + metal n Ec Ev Schottky contact I V V I
  • 9. Figure 5: The energy band diagram of a metal and a n-type semiconductor. Left: before contact, right: after contact. For Schottky contacts there should be depletion of majority carriers at the junction. The current- voltage characteristics of the Schottky contact is exponential. A Schottky contact can be used as a rectifier. It is a majority carrier device. Semiconductor-semiconductor junction pn junction and many more Ecp EF Evp Eg p-type n-type Ecn EF Evn Ecp EF Evp Eg p-type n-type Ecn EF Evn eV0 W0 Figure 7: the energy band diagram of a pn junction. Left: before contact, right: after contact. The work function difference between n-Si and p-Si causes a potential barrier between n and p Si when forming the junction. Applying an external electric field will increase or decrease this potential barrier respectively inhibiting and allowing current to flow. * How to interpret an energy band diagram? Energy band diagrams are great tools to predict the behaviour of the junctions under the influence of an externally applied voltage. This is illustrated in fig. 8. The figure gives a Schottky contact on an n-type semiconductor. The Schottky contact for the n-type semiconductor is characterised with a potential barrier for electrons (depletion of minority carriers at the junction). When a positive voltage is applied to the metal (V+) the Fermi level of the metal drops with a value equal to eV with respect to the Fermi level of the semiconductor (which node we have grounded and thus it doesn’t change). This decreases the potential barrier seen by the electrons in the semiconductor that are electrostatically attracted to the metal. However not all electrons available in the semiconductor can flow through the junction to the metal due to remaining potential barrier. 9 EE2 - Semiconductor Devices 2012
  • 10. Figure 8: Left bottom: energy band diagram of a metal-semiconductor contact under zero bias. Left top: circuit connection. Right bottom: energy band diagram under bias. The density of electrons as a function of energy is also given. Right top: circuit connection, electrons are flowing through the closed circuit. The potential barrier (increase in Ec towards the junction) blocks all carrier transport of carriers with energies lower than the barrier. This is because these carriers would flow into the forbidden gap where there are no energy levels to receive them. The carriers with energy higher than the barrier will be able to “flow” across the junction and occupy free energy levels (states) at the other side of the junction. This will cause a small current to flow. If the potential barrier is reduced more by applying a large V on the metal, then the current will increase exponentially. Thus the electrostatics imposed by the +V voltage attracts the electrons, however the quantum mechanics presented by the energy band diagram shows that there is a potential barrier that blocks a certain amount of available charges. 1.4 Conclusions Semiconductors have two types of free carriers - electrons and holes - this gives the possibility for two types of currents to flow in different junctions – drift and diffusion currents. Energy band diagrams are a handy way to predict the expected magnitude of the current in junctions under the influence of an external bias without the need for full scale device modelling. 10 EE2 - Semiconductor Devices 2012 Ec EF Ev metal semi-conductor Energy Density of electrons at each energy value. Lots of electrons close to Ec : n2 > n1 > n3 but the density is exponentially decreasing with increasing energy. Potential barrier to electrons intending to traverse to the metal EFm V+ Forbidden band, no electrons can travel through the wide forbidden band distance Only these electrons have sufficient energy not to have to go through the forbidden band. Few electrons- >small current. Ec n1 n2 n3 Built-in voltage Potential barrier
  • 11. 2. The p-n diode 2.1 Review – the short pn diode In EE1 the operation of the special case of a short diode was discussed. The definition of short diode is that the width of the materials that make the pn junction, are smaller or equal to the diffusion length of the minority carriers. As a consequence the number of minority carriers in the neutral region varies linearly, with a slope determined by 1) the injection of minority carriers across the junction 2) the neutrality condition at the contacts (here we made the assumption that the contacts only impose the bulk conditions on the carrier concentrations). We found that the currents in a p-n diode are governed by diffusion of minority carriers in the neutral regions (the neutral regions are those where the sum of all charges is zero, thus outside the depletion region). The assumptions that were made to derive the current are: - the contacts are ideal and do not show any band bending - the contacts can absorb and generate the necessary carriers to keep bulk condition carrier concentrations fixed - no voltage is dropped across the neutral regions - the applied voltage drops across the depletion region only - the amount of injected carriers across the junction due to the applied voltage is negligible compared to the majority carrier concentration determined by the doping. Under forward bias, electrons are injected from the n-region into the p-region and holes are injected from the p-region into the n-region due to the fact that the externally applied potential lowers the energy barrier between the n and p type region. This injection of carriers causes a minority carrier gradient of electrons in the p-type region and a hole gradient in the n-type region. Gradients of carriers cause diffusion current. Similar gradients occur in reverse bias but they are a lot smaller because they are minority carriers rather than majority carriers that are injected across the barrier. The reverse bias leakage current is limited by the amount of holes available and/or generated7 in the n-type region and the amount of electrons available and/or generated in the p-type region. Since under normal circumstances there is a limited number of minority carriers available, the reverse leakage current is small. * Band diagram of unbiased junction Ecp EF Evp Eg p-type n-type Ecn EF Evn Ecp EF Evp Eg p-type n-type Ecn EF Evn eV0 W0 Figure 1: The energy band diagram of a pn junction. Left: before contact, right: after contact. V0 (also called Vbi) is the built-in voltage, it represents the potential barrier that controls the amount of carriers that diffuse. V0 is generated by the internal electric field that is a consequence of carrier diffusion upon contact. 7 See more on generation of carriers later in this chapter. 11 EE2 - Semiconductor Devices 2012
  • 12.       = 20 ln i AD n NN e kT V * Space charge region or depletion region p n p n - - - + + + W0 built-in E-field -ve acceptor ions +ve donor ions depletion region Figure 2: Left: p and n material before contact. Right: pn junction with 2 neutral regions (n & p) and the space charge region. W0 is the depletion width when no external bias is applied. In the “depletion approximation” we assume that the depletion region is empty of moving carriers. It contains 2 sides with fixed ionised charges of opposite charge at each side. The fixed ionised charges are the ionised doping atoms (they have lost a hole or electron → NA - resp. ND +). The doping atoms are fixed in the lattice and thus cannot move and as a consequence cannot carry current. This region is thus more resistive than the neutral regions. The charge separation (the ionised charges in the depletion region) is caused by the internal electric field. The internal electric field is due to that built-in voltage Vbi, the built-in voltage is a result of the contact potential difference = work function difference between n and p-type Si. * The p-n junction under forward bias WnWp p-type n-type depletion regions neutral region neutral region + + + + + + + + + + - - - - - - - - - - fixed donor ions fixed acceptor ions Ec Ev EF e (V - |V|) eV + + + free holes free electrons 0 V Figure 3: Top: forward bias condition. Bottom: energy band diagram of the pn diode under forward bias Forward bias lowers the potential barrier across the junction with a value proportional to the applied voltage, therefore more carriers will have an energy higher than the barrier and cross the junction. Current is flowing and is increasing exponentially. * The p-n junction under reverse bias The reverse bias adds the absolute value of the applied voltage to the built-in voltage increasing the potential barrier, therefore there are no carriers with sufficient energy to travel across the barrier. There is drift of 12 EE2 - Semiconductor Devices 2012
  • 13. minority carriers across the junction. Since the number of minority carriers is low, the current is small and determined by the minority carrier concentration rather than the electric field. Thus the off-current in a diode is small and constant as a function of reverse bias voltage when no break down mechanisms occur. E c Ev EF eV + + + free holes free electrons e (V + |V|)0 WnWp p-type n-type neutral region neutral region + + + + + + + + + + + + + + + - - - - - - - - - - - - - - - V Figure 4: Top: reverse bias condition. Bottom: energy band diagram of the pn diode under reverse bias * Minority carrier distribution under bias and current. It is important to remember that under certain bias conditions a certain amount of excess carriers is stored in the n and p regions between the edge of the depletion region and the contact (neutral regions). These excess carriers will cause the delays when switching pn diodes. More on this topic later. Under forward bias the excess minority carrier concentration at the edges of the depletion width are given as a function of the bulk minority carrier concentration and the applied voltage. The excess of carriers is defined as the surplus (positive or negative) of minority carriers with respect to the initial minority carrier concentration that is determined by the bulk material. The excess carrier concentration at the edge of the depletion width (thus at x=wn or –wp) is given by: edgeregiondepletionatregiontype-ninionconcentratholeexcess edgeregiondepletionatregiontype-pinionconcentratelectronexcess 0 ' 0 ' nnn ppp ppp nnn −=∆ −=∆ With the injected concentrations given by:       == kT eV n n p p e p p n n 0 ' 0 ' (1) with n’p and p’n respectively the minority electron concentration in the p-region at the depletion region edge and the minority hole concentration in the n-region at the depletion region edge (injected minority carrier concentration). np0 and pn0 are the intrinsic minority carrier concentrations. To derive the expression for the current, it is best to refer to the graphical picture of the device under bias as given in fig. 5. Note that looking at forward bias only, is sufficient to derive the expression of the current in both bias regions. 13 EE2 - Semiconductor Devices 2012
  • 14. Figure 5: Top: Short pn diode under forward bias with exaggerated depletion width. Bottom: excess minority carrier distribution of short diode. Shaded regions represent the amount of stored excess minority carrier charge8. Note that at the contacts the excess carrier concentration is zero. This condition is imposed by the contacts. In a short diode (the lengths of each neutral region is smaller or equal to the minority carrier diffusion length) the minority carrier concentration is decreasing linearly in each region. The excess carrier concentration is given by the shaded triangles in the neutral regions (Fig.5). The density of minority carriers is imposed by the boundary conditions: eq. (1) and bulk conditions kept at Ohmic contacts. Since gradients in carrier concentration occur due to the injection process across the junction, diffusion of minority carriers will happen. Calculation of the diode currents in a short diode is easy. Remember the expression for the diffusion current: ( )                               −         −         +           − + −         − + −         − − − −− −       − =                         1 1 11 '' 0 ' 0 ' 00 00 00 00 kT eV s kT eV p pn n np p kT eV pn n kT eV np p nn p n pp n p nn p n pp n n p p n tot eI e L Dp L Dn eA L e Dp L e DneA L pp D L nn DeA L pp D L nn DeA dx dp D dx dn DeA I An interesting problem to think about is: what happens when one or both of the materials forming the pn diode are shorter than the diffusion length (Ln and Lp) of the minority carriers (but longer than the depletion 8 Note that the length of the n-type region is given as Lp. This seems contradictory but isn’t from a physics point of view. Remember than in the n-type region a hole diffusion current exists. The boundary for the definition of short diode is that the length of the region is exactly equal to the diffusion length of the minority carriers which is Lp. The choice of taking the maximum value of the lengths for deriving the short diode current is that this gives exactly the same expression for the current as in the case the short diode approximation cannot be applied (see next). It is a bit cheeky, but now you know why. 14 EE2 - Semiconductor Devices 2012 x -wp wn0 np pn x np0 -x ∆np ∆pn pn0 0 0 Short diode p’n n’p -Ln Lp
  • 15. width in each region)? Thus do the derivation of the short diode current for a length xn<Lp for the n-region and xp<Ln for the p-region and compare the result taking into account the given in-equalities. Remember that there is also a majority carrier flow as the majority carriers injected across the junction have to be re-supplied9. Luckily the rule that the total current is constant through the device makes calculation of the minority carrier diffusion current in each region of the pn junction sufficient for deriving the total current in the pn junction. The magnitude of the diffusion current of the electrons in the p-type region is equal to the magnitude of the electron drift current in the n-type region, the latter current is the re-supply of the injected carriers across the junction. This is similar for holes. This is illustrated in the picture below (fig. 6). Figure 6: The contribution of the minority and majority carrier current to the total current through the pn junction. Majority carriers injected across the junction are re-supplied via drift through the contact and diffuse to the other contact through the minority carrier gradient region. The minority carrier gradients determine the total current completely. The current remains constant in the space charge region because we assume at the moment that there is no recombination no generation of carriers. 2.2 Generation and recombination – long pn diodes In real diodes, the length of the materials forming the junction is not necessarily smaller or equal to the diffusion length of the minority carriers. In the case of long diodes recombination of minority carriers will happen whilst they are diffusion to the contact. As a result, the number of minority carriers varies non- linearly in the neutral regions of the device. In what follows we will study its impact on the device characteristics. * Generation – recombination We have seen that due to thermal energy electron-hole pairs are created, thus electrons and holes are freed from the atoms and become free carriers that can be involved in the conduction processes. This process is called generation of carriers and is happening continuously as long at the temperature is sufficiently high to break the valence electron-atom bonds. Of course other forms of energy can do the same. An example is light: shining light on a semiconductor, with the correct energy, larger than the energy gap, can also release electron-hole pairs. The opposite process is called recombination. In this case an electron and hole will recombine and thus get fixed to the atom and become unavailable for conduction. This is a reduction of the number of free carriers. As with generation, recombination is also continuously happening. Recombination can happen in two ways. 9 See first year course notes. 15 EE2 - Semiconductor Devices 2012 junction Depletion region current p+ -region n-region contact contact In Ip Itot Minority carrier diffusion currents Majority carrier drift currents Remain constant in space charge region.
  • 16. The first is direct recombination of electron and holes which means that excess electrons in the conduction band recombine with holes in the valence band. Energy is lost by the electron and is given off as photons (light). The second type is indirect recombination. In this case there are impurity centres or lattice defects in the semiconductors, called traps – these will always be available as a 100% perfect semiconductor does not exist. The traps will cause some discrete energy levels to exist within the bandgap of the semiconductor which can have empty states to which the electrons from the conduction band can fall in order to cross the bandgap in steps. In this case, the energy released by the electrons causes heating of the lattice (Heating causes lattice vibrations. These vibrations can be seen as particles called phonons with which the carriers in the lattice can interact – scatter. They can also be regarded as waves with certain energy and wavelength). The characteristic timescale involved in the recombination processes is called the carrier lifetime τn,p. The characteristic length scales are the diffusion lengths Ln,p. These parameters give the statistically average time, respectively distance that a carrier travels before it recombines. This is a statistical average, thus means that not all carriers will recombine within that time scale, but the majority will such that at x=Ln,p the number of carrier have been reduced by a factor Exp(1). The values are dependent on the material, the quality of the material, the doping density and the type of charged carrier. The relationship between the carrier lifetime and diffusion length is given by the diffusion constant following: pnpnpn DL ,,, τ×= The intrinsic number of free electrons and holes is the same as carrier generation and recombination is in equilibrium. In a pn diode under forward bias an excess minority carrier density exists in the neutral regions of the device. When the voltage across the junction is not too high we can assume that this excess is a lot smaller than the number of majority carriers in that region. It is the gradient of the excess minority carriers that is significant. Recombination will happen between the majority carriers and the excess minority carriers. Since the density of the excess carriers is small compared to the density of the majority carriers, recombination processes can have a significant impact on the number of excess carriers, whilst being insignificant for the majority carriers in comparison with the amount available. Recombination becomes important for devices where the neutral regions are larger than the diffusion length10. If we put the pn diode under reverse bias then there will be a reduction of minority carriers in the neighbourhood of the depletion region edges (junction). In this case generation of minority carriers is larger in order to maintain equilibrium conditions. Thus the rate of recombination and generation will adapt itself to the availability of excess minority carriers in the “neutral regions”11. When there is an excess of minority carriers, then the recombination rate will increase proportional to this excess in order to drive the semiconductor back to equilibrium. Thus the generation rate of minority carriers will then be smaller than the recombination rate. However when there is a shortage of minority carriers then the generation rate increases to try to bring the minority carrier concentration back to equilibrium conditions. In this case the generation rate of minority carriers is larger than the recombination rate. Of course when minority carriers recombine they do so with majority carriers. As a consequence the majority carrier recombination or generation rate is equal to that of the minority carriers. We will assume that the injected minority carrier concentration is sufficiently small compared to the majority carrier concentration such that the variation of majority carriers can be neglected.12 The minority carrier recombination rate in the “neutral region” can be described to acceptable approximation by the simple equations: 10 It is indeed an approximation, although acceptable, in the short diode to assume no carriers recombine within the neutral region as the diffusion length is a statistical average. Thus some do recombine but we neglect this. 11 What we call neutral is actually quasi neutral under the given assumption, that’s why it is written between quotes. 12 This assumption will actually break down the rule on charge neutrality in the “neutral region”. This is of course not completely correct as charge neutrality is a fundamental rule. But the assumption will allow us to derive analytic expressions that still describe the conduction through the device with reasonable accuracy. 16 EE2 - Semiconductor Devices 2012
  • 17. p n p n p n p U n U τ δ τ δ = = (2) Recombination in a depletion region or in those cases where the minority carrier concentration is of the same order of magnitude as the majority carrier concentration have to be described by different equations than those given above. In order to calculate currents in the long diode, we need to know the variation of the minority carrier excess in the neutral region. The first step is thus to derive the expression of this variation in the case recombination happens13. In order to do that we take a volume of semiconductor material through which a hole diffusion current is flowing as given in fig. 7. We look at the variation of the density of holes, as a function of time and place, over an infinitesimal distance ∆x. This equation will give us the continuity equation for holes. It gives the rate of change of the hole density while a current is flowing. It is also this equation that will be important to analyse the transient processes in bipolar devices under large signal switching conditions. Figure 7: Hole current entering and leaving a volume ∆x A. p npp xxx n txp x xxJxJ et txp τ δ ),()()(1),( − ∆ ∆+− = ∂ ∂ ∆+→ (3) In words this equation means: The rate of variation of the hole concentration = increase of the hole concentration in volume ∆x ×A per unit time - loss of holes due to recombination. The term δpn is the excess minority carrier concentration. Excess means the density of carriers larger than the minority carrier concentration defined by the doping of the bulk material only. The second term is the carrier recombination term given in eq. (2). For ∆x→0 the equation (3) becomes a differential equation: p p txp x txJ et txp t txp τ δδ ),(),(1),(),( − ∂ ∂− = ∂ ∂ = ∂ ∂ (4a) Similar for electrons: n n txn x txJ et txn t txn τ δδ ),(),(1),(),( − ∂ ∂ = ∂ ∂ = ∂ ∂ (4b) These equations are referred to as the continuity equations for the holes resp. the electrons. If we can assume that drift is negligible14 then the current is solely diffusion and the current densities can be written as: 13 Remember, without recombination it is linear. 14 This is a valid assumption as we are dealing with minority carriers and we have assumed that the injection rate is small. So the absolute number of minority carriers is small and as a consequence the drift minority carrier current will be negligible. 17 EE2 - Semiconductor Devices 2012 propagation direction, x x x+∆x Jp (x) Jp (x+∆x) A
  • 18. x p eDJ x n eDJ n pp p nn ∂ ∂ −= ∂ ∂ = δ δ (5) Substituting (5) in (4)15 gives the continuity equations of minority carriers taking recombination into account: p p n n p x p D t p n x n D t n τ δδδ τ δδδ − ∂ ∂ = ∂ ∂ − ∂ ∂ = ∂ ∂ 2 2 2 2 (6) This equation is of utmost importance for analysing the switching characteristics of bipolar devices. * minority carrier variations and currents In case we have steady state carrier injection as e.g. across a forward biased pn diode in DC, the time derivative is zero and in steady state the continuity equations become: 22 2 22 2 ppp nnn L p D p x p L n D n x n δ τ δδ δ τ δδ == ∂ ∂ == ∂ ∂ (7) Solving this equation with boundary conditions: 0&0,@ &0@ === ∆=∆== pnXXx ppnnx np δδ δδ (8) These boundary conditions mean that x=0 is the point of steady state carrier injection (depletion region edge) due to the applied DC voltage across the junction. The second boundary condition gives that at the contacts the excess carrier concentration needs to be zero. The solution of (7) for holes, which is a second order differential equation, can be written as the sum of two exponentials:         −+         = pp L x C L x Cxp expexp)( 21δ or using a hyperbolic sine function:         += 21 sinh)( C L x Cxp p δ with C1 and C2 integration constants that must be determined by the boundary conditions (8). Using the sinh function as possible solution, we find the expression16 of the excess hole concentration variation as a function of position:         −         − ∆ = p n p n L Xx L X p xp sinh sinh )(δ (9) This is a rather complex equation, useful for numerical simulations only but not for pen and paper work. Therefore we want to simplify this equation for two special cases: the short diode approximation and the long diode approximation. For the short diode approximation we take the limit of Xn << Lp for eq. (9) and for the long diode approximation we take the limit of Xn .→ ∞ In the following we will evaluate what the errors are that we make by taking these approximations. For this we need to calculate the current based on (9) and that based on the limits of short and long diode approximations. In order to calculate the current we have to take the first derivative of (9). This gives for the hole current: 15 Note that the subscript n and p are omitted. Remember that these equations are for the minority carriers! 16 MathematicaTM was used for this extraction. 18 EE2 - Semiconductor Devices 2012
  • 19.        ∆ = p n p p p L X L pAeD I coth (10) The following figures in Fig. 8 give the difference in excess minority carrier concentrations between the short, long and correct diode descriptions. Figure 8: The excess minority carrier hole concentration in the n-layer under normalised injection conditions for the different solutions of the continuity equation and for different relative differences between contact position relative to the minority carrier diffusion length. The minority carrier diffusion length is Lp=200 nm, the distance to the contact varies: Xn= (a) 20, (b) 200, (c) 400 and (d) 1000 nm. For short Xn (a), the short diode approximation describes the excess carrier concentration to excellent accuracy. For long Xn (d) the long diode approximation is excellent. In the other two situations some error is made. When Xn=Lp, the excess carrier concentration is best described by the short diode approximation (smallest difference in area underneath the curves and correct contact boundary condition). When Xn>Lp but 19 EE2 - Semiconductor Devices 2012 (a) (b) (c) (d) Normalisedminoritycarrierconcentration Distance (nm) Normalisedminoritycarrierconcentration Distance (nm) Normalisedminoritycarrierconcentration Distance (nm) Normalisedminoritycarrierconcentration Distance (nm) Correct solution Short diode approximation Long diode approximation
  • 20. of the same order of magnitude, the linear approximation becomes less accurate and the exponential equation more accurate. The error in the long diode approximation is in the non-zero excess at the contacts. When looking at the currents, we can conclude why the use of the approximations is acceptable in different regions. In figure 9, the ratio of the correct current to the approximated current is given as a function of the ratio of the lengths. Figure 9: The ratio of correct current to approximated current. Blue: long diode approximation, pink: short diode approximation. Interesting observations are: 1. the error of using the short diode approximation becomes negligible small when Xn<<Lp. Obviously for Xn<Lp the short diode approximation is best. 2. for Xn=Lp the error using the short or long diode approximation is exactly the same17. Thus we use the short as it is easier. 3. for Xn>Lp the error made by using the long diode approximation decreases quickly and it is better to use the long rather than the short diode approximation. We see that if the length of the diode layer is more than twice that of the minority carrier diffusion length, the error becomes negligible. * Simplified solution of eq. (7) 1. Short diode approximation In this case, the Ohmic contacts are at a distance shorter than the minority carrier diffusion length. Thus Xp < Ln and Xn < Lp, where Xp is the position of the contact of the p-layer and Xn is the position of the contact in the n-layer. In this case we neglect any recombination by setting τn,p = in eq. (7). Then under the boundary∞ condition (8), the excess minority carrier concentration varies linearly. This is what is referred to as the SHORT diode approximation. 2. Long diode approximation In this case, the Ohmic contacts are at a distance larger than the minority carrier diffusion length. Thus Xp >> Ln and Xn >> Lp. In this case we assume that the contacts appear at a distance equal to infinity: Xp = Xn = .∞ 18 In that case the solution to (7) is an exponential. This is called the LONG diode approximation. 17 This is obvious from the equations derived in this case for the short and long diode approximations. 18 Note that we are ignoring the signs. 20 EE2 - Semiconductor Devices 2012
  • 21. Solving (7) in the long diode approximation we impose that the excess minority carriers have completely disappeared by recombination. The solution for the excess carrier concentration is then:       −       − ∆= ∆= p n L x L x epp enn δ δ excess minority carrier concentration19 (11) With τDL = the diffusion length, which is the average distance a carrier diffuses (travels) before recombining. τ is the average time between scattering20 events. Thus in the case of diffusion with recombination the excess carrier concentration is varying exponentially in a long diode in contrast to the short diode where the excess carrier concentration is varying linearly. This is illustrated in fig. 10. Figure 10: the variation of the excess carrier hole concentration as a function of distance due to recombination (full line). n0 (p0) is the carrier concentration determined by the doping of the bulk material. ∆n (∆p) is the excess carrier concentration at x=0 resulting from the carrier injection process. x=0 is the edge of the depletion region. n ( p) is the x-dependent excess carrier concentration. Note that we are talking about minorityδ δ carriers! As in the short diode, the current is still determined by the diffusion of the excess minority carriers in the neutral region. The difference is that now this minority carrier excess is changing exponentially. As a consequence the minority carrier diffusion current calculated for holes is:       − ∆= pL x p p p ep L D qxJ )( (12) Thus this current is decreasing for positive x (see fig. 10) because holes are disappearing by recombination! But the total current needs to be constant. This can be obtained by remembering that total current consists of hole and electron movement. Since we have neglected the variation of majority carriers, there must be a drift current of majority carriers that is re-supplying the recombined carriers and resupplying the carriers that are injected across the junction. The sum of this majority carrier drift current and minority carrier diffusion current is constant. Thus we see that if minority carrier diffusion current is decreasing when going away from the point of carrier injection, the majority carrier drift current in decreasing when going towards to point of injection. The sum of the two is constant: Itot. As a consequence it is the diffusion of minority carriers that limits the total current, therefore the total current must be determined by the maximum electron and hole diffusion currents that can happen under the given injection conditions (determined by the applied voltage) The maximum diffusion current that can flow can be calculated at the point of injection at both sides of the junction (edge of the depletion width in the pn diode) as there the gradient of the exponentials is 19 Note that the variations of both minority carrier concentrations are calculated in the positive x-axis. Signs will change for pn junctions. 20 Scattering is caused by interaction of the carriers with Si atoms, impurities (doping and others) and crystal imperfections. 21 EE2 - Semiconductor Devices 2012 p(x)= p0 + ∆p e(-x/Lp) ∆p p0 xXn Lp Excess carrier concentration is forced to zero at contact.
  • 22. maximum. This gives the first approach of finding the expression of the current in a long pn diode. Figure 11: Top: pn diode under forward bias with exaggerated depletion width. Bottom: excess minority carrier distribution of long diode. Shaded regions represent the amount of stored excess charge. Calculation of the diode currents in a long diode is based on calculating the maximum diffusion current at the edge of the depletion region width, see fig. 11. This means that we determine the excess carrier gradient at x=0 in each region: ( )                           − + −         ∆ + ∆         ∆ − ∆−         −         − = = − = − == == p nn p n pp n p n p n p n x Lx n p x Lx p n x n p x p n x n p x p n tot L pp D L nn DeA L p D L n DeA dx epd D dx end DeA dx pd D dx nd DeA dx dp D dx dn DeA I pn 00 0 / 0 / 00 00 '' δδ                        −         −         +             − + − =                         1 1 11 00 00 kT eV s kT eV p pn n np p kT eV pn n kT eV np tot eI e L Dp L Dn eA L e Dp L e DneA I Note that the result we have obtained for the long pn diode current is the same as the short diode. This is only the case when for the short diode we take the lengths of the neutral regions to be exactly the same as the diffusion lengths of the minority carriers. For shorter diodes, the values of Ln and Lp will have to be changed by the actual widths of the neutral regions and the current will thus increase in shorter diodes. Figure 12 gives the electron and hole components of the currents in a long pn diode. Each component is not constant throughout the device but the sum of electron and hole current is constant. The majority carrier component occurs as a result of recombination between minority and majority carriers, majority carriers 22 EE2 - Semiconductor Devices 2012 x -wp wn0 np pn x np0 -x ∆np ∆pn pn0 0 0 Long diode p’n n’p
  • 23. need to be re-supplied, which causes the current. Compare this to the short diode where all current are constant throughout the device. Thus our initial assumptions that there is no electric field21 in the neutral regions is not quite correct otherwise there would be no drift current for the re-supply of carriers. The re- supply can be allocated to drift as the gradients of the majority carriers are so small that it would not be sufficient for re-supply. The electric field can be very very small as long as the number of carriers is large (which is the case for majority carriers) to make a sufficiently large drift current. Thus although there is a small electric field across the neutral regions it still is negligible compared to the electric field dropped across the depletion region. Figure 12: The variation of the magnitude of the hole and electron current in a long diode. Note Ip is a minority carrier diffusion current in the n-region and a majority carrier drift current in the p-region (similar for In). There is another way to calculate the currents in the pn diode that will come in handy when discussing the switching behaviour of the pn diodes. To that aim we quickly look at this second method for calculating the diffusion currents in a diode. With reference to fig. 11 note that there is excess minority carrier charge in the neutral region (this is indicated by the shaded regions). We call Qn,p the excess minority carrier electron, hole concentration in resp the p, n type region. The density of the excess charge is given by the shaded area underneath the curves for δn and δp. To calculate the excess charge we integrate the excess minority carrier functions: ∫ ∫ ∞ ∞− = −= 0 0 dxpeAQ dxneAQ np pn δ δ (13) Note that the boundary conditions chosen for this calculation are taken to be infinite. These boundary conditions represent the position of the contacts under the long channel approximation22. Under the assumption that the exponential variation of the excess carrier concentration is the solution of the steady state continuity equation we have to make sure that the excess carrier concentration at the contacts is zero. We know that current is a variation of charge as a function of time. In the case where recombination of the excess carriers occurs we know that this recombined charge needs to be re-supplied. Every τn,p the charge Qn,p disappears via recombination and this charge needs to be re-supplied in the same time scale in order to maintain steady state. The current that re-supplies these re-combined minority carriers is given by: p np p p p n pn n n n peALQ I neALQ I ττ ττ ∆ == ∆ == (14) Thus the current can be expressed as the stored minority charge in the neutral regions divided by the lifetime 21 Nor a gradient in majority carriers 22 This ensures a zero excess carrier concentration at the contact! 23 EE2 - Semiconductor Devices 2012 p n Itot Ip In In Ip Itot =In + Ip
  • 24. of the minority carriers in this region. Filling in the expressions for the excess carriers and the diffusion constants will give the same current equations as extracted before for the long diode. 2.4 Non-idealities in pn diodes When measuring a Si pn diode and plotting the current on a log scale we get a graph as in fig. 13. Region a The assumption in the ideal pn diode is that no recombination happens in the depletion width, thus carriers travel through unhindered. This is not completely correct, especially in pin23 diodes or diodes with long depletion widths. If the depletion width is larger than the carrier diffusion lengths, recombination of carriers in transit will occur. This will affect the current at low current densities (small number of carriers in transfer). More carriers need to cross in order to obey the relationship for injected carrier concentration as a function of applied voltage. Region b This region behaves as ideal diffusion and happens for intermediate voltages. Region c This is the region of high level injection. A huge amount of carriers is injected across the junction and makes the number of minority carriers at the edge of the depletion region of the same order of magnitude as the majority carriers. This brings changes to the majority carrier density which we have assumed to be constant in the ideal case. In the high carrier injection regime the relationship for the injected carrier concentration that we have derived in EE1 breaks down. Its effect is a lowering of the total current flowing. Region d At still higher voltages or for large ohmic contact resistances a large amount of the applied voltage is dropped across the ohmic contact rather than across the depletion region and thus the intrinsic diode feels less voltage applied, keeping the current lower than expected. Figure 13: The difference between an ideal and a real IV curve of a Si pn diode. Although all these effects can be calculated, there is no easy solution. Therefore an ideality factor n is introduced in the formula for the current in a pn junction that takes into account these non-ideal effects. Note that the ideality factor n is called the emission coefficient in SPICE. The expression for the current then becomes:         −=       1nkT eV stot eII With 1 ≤ n 2. n=1 in the ideal region and goes towards 2 in the recombination and high level injection≤ region. 2.5 Switching delays in pn-diodes The switching characteristics of pn diodes are all governed by EXCESS MINORITY CARRIERS. 23 p-type region + intrinsic region + n-type region 24 EE2 - Semiconductor Devices 2012 Ln(I) V a) b) c) ideal real d)
  • 25. Under bias there exists an excess minority carrier concentration inside the neutral regions close to the depletion region. The amount of which is a function of the applied bias – the larger the current that is flowing the larger the excess charge. In order to change the current, the excess charge stored should change before the voltage across the diode junction can change. This is inherently a capacitive effect. We can look at two ways of switching. First (fig.15), one can switch the diode from on (Vapplied>0V, forward bias) to off (Vapplied=0V, by opening the switch such that I=0A). We will see that removal of excess carriers, when the diode switches from forward bias to open circuit, occurs via recombination only. This is thus governed by the carrier lifetimes. The carrier lifetime is the average time an electron (resp. hole) spends in the material before it recombines with a hole (resp. electron). τn and τp are the minority carrier life time of electrons and holes respectively, thus it will take a time equal to τn and τp to reduce the excess carrier concentration by a factor e. Fig. 15 illustrates a switching experiment of a p+n diode (current mainly governed by holes) from forward to zero bias via a switch that opens at t=0. Although the current drops immediately to zero, the voltage, v(t) across the diode remains until all excess charge is removed. That means that there will be a voltage across the load RL until excess charge removal is complete. I Qp(t) δp I I τp t t xn Current through diode. Decay of stored charge. Change of excess in function of position. Figure 15: Top: switching circuit. Bottom: Left: upon switch-off the current through the diode drops to zero but the excess charge remains and decays exponentially via recombination only (middle). The state of the diode cannot change before the charge is removed. Right: dashed lines give gradient of excess charge at the edge of the depletion region. When the current is 0 the gradient is 0. Repeating equation (4a): p p txp x txJ et txp τ δδ ),(),(1),( − ∂ ∂− = ∂ ∂ Re-organising the terms, multiplying by cross sectional area A and integrating over the neutral region: A t txpe A txpe A x txJ contactcontact p contact p ∫∫∫ ∂ ∂ += ∂ ∂− 000 ),(),(),( δ τ δ Remember that the diffusion current is zero at the contact and maximum at the edge of the depletion region (x=0) and that the integral of the excess minority carrier concentration in the neutral region multiplied by unit charge e and cross sectional area A gives the total stored charge Qp in that region (see eq. 13). 25 EE2 - Semiconductor Devices 2012 RL e(t) + - i(t) v(t ) vL (t) t= 0
  • 26. This gives the expression for the time variation of the current as a function of the stored charge in the neutral region: dt tdQtQ ti p p p p )()( )( += τ (15) Eq. (15) states that the instantaneous current in a switching device ip(t) is equal to the re-supply of the excess carrier concentration that is disappearing as a result of recombination (this is the DC component of the current – 1st term RHS) plus the AC component that allows a build-up or depletion of charge as a function of time (2nd term RHS). In the special case of switching the p+n diode from ON to zero, a solution to equation (15) can be easily found. For t≤0 the DC forward bias imposes a current I0 through the device. Thus at t=0-24 the excess minority carrier charge is given by: Qp=I0 τp. At t=0+25 the current drops to zero (open circuit) and remains zero, the charge cannot follow immediately. These form the boundary conditions to solve (15)26. Thus (15) becomes: dt tdQtQ p p p )()( −= τ Integration over time gives: ( ) pt p p p t p t p p eCtQ c t tQ dt tQ tdQ τ τ τ / 00 )( )(ln )( )( − = +−= −= ∫∫ With c and C integration constants. Since Qp(t=0+)= I0 τp the integration constant C= I0 τp. Thus the variation of the excess minority carrier charge as a function of time is given by: pt pp eItQ τ τ / 0)( − = (16) The proof that the voltage remains across the diode goes as follows. We need to find the relationship between the voltage across the diode and the minority carrier excess charge. This relationship, we all know from the injection of carriers relationship (1):       −      =−=∆ 1 )(v exp00 ' kT te pppp nnnn (17) With v(t) the voltage across the diode. Thus as long as ∆pn is non-zero, there exists a voltage v(t) across the diode. If we ignore the distortion of the exponential variation of the excess charge at the depletion region edge27, we can still use the pure exponential relationship of the excess carrier concentration as given by eq. (11). The stored charge at any time is then given by (13): )(tpeALQ npp ∆= (18) Substituting eqs. (16) in (18) gives )(tpn∆ as an exponential function of time. Substituting this in (17) and extracting v(t) gives: 24 An infinitesimal amount of time before switching. 25 An infinitesimal amount of time after switching. 26 Note that these switching equations can also be solved with the methods introduced in the Signals and Linear Systems course this year. 27 Since the current is zero, the gradient at the depletion region edge of the minority carrier density needs to be zero too! So there the line for the excess carrier concentration is horizontal and not exponential. 26 EE2 - Semiconductor Devices 2012
  • 27.         −= − 1ln)(v /0 pt onp p e peAL I e kT t ττ (19) In order to improve switching speed in this situation, recombination centres are added to decreases the carrier life time, τp. On the other hand one can also make a p+n diode with a short p+ region, smaller than the recombination length in order to limit the excess carrier build-up. Thus: • the excess charge dies out exponentially via recombination as a function of time • the voltage across the diode junction cannot change instantaneously but has to wait till the excess charge has disappeared in order to establish the correct depletion layer for a reduced voltage. Another way to improve the switching time is to switch the diode from ON to OFF by applying a negative (reverse bias) voltage during off switching. This will give rise to the reverse recovery transient. In this case a current will be flowing during the switching and thus the excess charges will be removed via a combination of diffusion and recombination. The physics associated to this process is represented in the drawings below. The magnitude of the switch-off voltage in the given case is equal to the magnitude of the on voltage. The time period T has to be large enough to allow the diode to switch off completely in each cycle. The second method to switch the diode is to drive the excess carriers from the neutral region via a current, then charge will be removed via recombination and diffusion currents. e(t) +E i 0 t -E T Figure 16: Circuit and input square wave. R is the load resistance. Figure 17: Excess hole concentration distribution in the n-region as a function of time during the transient. Note the change in the gradient of the excess minority carrier density at the moment of switch-off (below the x-axis). At ON: the current is positive, at the moment of switch OFF the current becomes negative.28 28 Note that the on and off state excess carrier concentration is not drawn to scale. The on state excess carrier concentration is a lot larger than the off-state excess carriers concentration. 27 EE2 - Semiconductor Devices 2012 x δp If gradient<0→ Ir → gradient>0 t p+ n R e(t)
  • 28. Figure 18: Top: the full line is the diode current-voltage characteristic. The dashed line with the arrows is the current-time diode characteristic whilst switching. Bottom is the variation of the voltage across the diode as a function of time. The graphs at the right are the currents and voltages measured across the diode as a function of time. tsd is the storage delay time. At t<0 the diode is ON and a current If=E/R is flowing. The forward bias current will be mainly determined by the bias circuit because the resistance of the forward biased diode is very small. As a consequence, the voltage drop across the diode is negligible compared to that across R. Thus the load resistance will limit the current. This current determines the slope of the excess carrier concentration at the depletion region edge. We know that this slope is consistent with the diffusion of minority carrier holes in the n-type region from the depletion region edge to the contacts (similar for electrons in the p-type region). At t=0 the voltage polarity is reversed whilst the magnitude of the voltage is the same (this equality is not necessary and is here used for convenience). Then a negative current -Ir=-E/R will be flowing that is consistent with this voltage. This negative current is many times larger (in absolute value) than the reverse bias current that is normally flowing through the pn diode in DC reverse bias. The reason why this happens is the following. When the diode was initially forward biased it had a narrow depletion region (that only allows a small voltage drop across it) and a relatively large density of stored minority carriers. When the external bias is reversed, we know from the previous switching experiment that the excess minority carrier charge that is stored in the neutral regions will not disappear immediately. As a consequence, the depletion region cannot increase and the voltage across the diode can also not increase immediately. Remember that the depletion region is a region without free charged carriers. Thus in order to deplete the neutral regions, we first have to deplete the regions around the junction of the excess minority carrier charge. Once that is done, the region around the junction can be depleted of the majority carriers. Doing this, forms the depletion region. Thus we can see now that when the external bias goes negative, the voltage drop across the diode is still small and negligible compared to the voltage drop across R. The current is thus determined by load resistance R and applied voltage –E. Since a negative current, -Ir is flowing, the slope of the excess carrier concentration at the depletion region edge is exactly opposite to the one in forward bias. This indicates that minority carriers have to flow the other way than under positive bias29. Thus minority carrier excess holes are diffusing from the n-type region to the p-type region and electrons from p to n. This current removes the excess charge. The current is large as long as it is determined by the external circuit and excess minority carriers are available. When the excess is removed (mainly by diffusion but also by recombination) then the depletion region will be able to build up. The current is decreasing as only the intrinsic minority carrier density remains to carry current. Thus as long as excess carriers remain, the slope of δp at the depletion region edge remains constant. When 29 Remember that the direction of the diffusion current is given by the gradient of the minority carriers at each point x in the device. 28 EE2 - Semiconductor Devices 2012 I V If -Ir t v(t) t i(t) -E If t -Ir v(t) tsd tsd
  • 29. the excess is removed, the depletion width adapts and an increasing voltage will be dropped across the increasing depletion width. The current through the circuit will then be more and more limited by the current that is allowed to flow through the diode. The final current will be determined by the small amount of minority carriers in the neutral region near the depletion region edge. This is maintained at steady state via carrier generation processes. The OFF current is thus the leakage current through the reverse biased diode. At t=0 the excess carrier concentration at the edge of the depletion region is p’n and at the end of the switch cycle the excess carrier concentration at the edge of the depletion region should have become p”n.       −       = = kT eE nn kT eE nn epp epp 0 '' 0 ' This is clearly illustrated in fig. 18. Important to note when you look at fig. 18 is the point where the diode can finally go into reverse bias. This point is where v(t) – the voltage across the diode junction - becomes equal to zero, which is consistent with the complete removal of excess charge, thus Qp=0. The time it takes to remove all the excess charge is called the storage delay time tsd. In order to find the variation of the charge as a function of time, eq. (15) has to be solved with the boundary conditions that for t<0 the charge is Qp=If τp and at t=0 the current becomes I=-Ir. This approach will allow us to derive an expression for the storage delay time. The assumption that we are making is that the condition I=-Ir is steady state until we reach t=tsd. This approach will not give the time it takes the diode to build-up the depletion region from the “no-excess charge” condition. Solving (15) for a p+n diode30 can be done by using Laplace transforms or as follows, re-writing (15) : p p p p tQ ti dt tdQ τ )( )( )( −= For 0 < t < tsd we know that ip remains constant at –Ir, thus: p p r p tQ I dt tdQ τ )()( −−= Separation of variables: prpp p dt ItQ tdQ ττ −= +)( )( Integrate: ( ) ( ) ( ) ( ) ( ) ( )         −++−= −= + + −=+−+ −=+ −= + ∫∫ p rpFprpp prpFp rpp p rpFprpp p tQ Irpp t p tQ Q rpp p t IIItQ t II ItQ t IIItQ t ItQ dt ItQ tdQ p fp p p τ τττ τττ τ τ τττ τ τ ττ τ exp)( )( ln ln)(ln )(ln )( )( )( 0 )( )0( or ( )                 − ++−= p rfrpp t IIItQ τ τ exp)( (20) Eq. (20) is valid for 0 < t < tsd only. 30 Current determined by the hole current. 29 EE2 - Semiconductor Devices 2012
  • 30. The storage delay time tsd can then be extracted by stating that at t=tsd, Qp(tsd)=0. Thus: ( )                 − ++−= p sd rfrp t III τ τ exp0 The storage delay time is then (under the assumption of quasi steady state) :       +≅ r f psd I I t 1lnτ Switch from forward to reverse bias state: • reverse current larger than diodes’ reverse saturation current • transient current and voltage are delayed by change in stored charge • this causes a storage delay time tsd during which the current is larger than the reverse bias current associated to the DC characteristics • delays in pn diodes are a consequence of excess minority carrier charge As before, to improve the switching time in pn diodes one can introduce recombination centers such that the lifetime of the carriers reduces which makes the excess charge disappear faster. Unfortunately this also increases the reverse leakage current. The delay time can also be reduced by using a short device layer. Other solutions to obtain fast rectifying devices include the use of Schottky diodes. Here only majority carriers need to be removed which is a fast process. In a Schottky diode the junction is formed by a metal- semiconductor contact, e.g a metal with a larger work function than the work function of n-type silicon. This depletes the majority carriers (electrons) in the semiconductor at the junction. No depletion of carriers occurs in the metal. In order to switch the Schottky diode from on to off, it is the majority carriers that move back towards the junction. There are plenty of them and we do not have to wait for generation of these majority carriers to establish re-supply. Remember that the fast switching in the Schottky contact can be exploited to improve the switching behaviour in bipolar junction transistors too. The use of GaAs (high mobility carriers and shorter lifetime than Si) results in ultra high speed diodes. Specially designed pn diodes which strongly conduct for a short period of time in reverse bias – the step recovery diode – can switch in the pico-second range and are used for harmonic generators. 2.6 Small signal equivalent circuit of a p-n junction diode If diodes are to be used as components in circuits, their non-linear characteristics can become cumbersome for fast circuit simulation purposes. Very often in circuit operation a device is functioning around a DC point (see analogue electronics course). The variations around this point are relatively small such that the device acts as if it is linear around this point. Therefore for circuit design purposes an equivalent circuit can be used with component values dependent on the chosen DC point but further giving a linear response. For the diode we have seen that there is a resistive component and a capacitive component that are both a function of voltage. The equivalent circuit is given in fig. 21. 30 EE2 - Semiconductor Devices 2012
  • 31. R s r = 1/gdd C Figure 21: Small signal equivalent circuit of a pn-diode. Rs is the contact resistance, rd is the diode’s differential resistance and C is the voltage dependent capacitance. The series resistance RS represents the non-ideal characteristic of the Ohmic contacts. The capacitance C is due to charging and discharging effects occurring during AC operation. There are two different situations. One is in reverse bias where a depletion region with fixed ionised charges is built-up with an amount dependent on the applied voltage31. The other is in forward bias and takes into account the variation of the built-up excess charge as a function of voltage. - Depletion capacitance in reverse bias (cfr. parallel plate capacitance) - Diffusion capacitance in forward bias (current injection across junction) Reverse bias: Depletion capacitance ( )( )VVNN NeN AC W A C DA DA depl depl depl −+ = = 02ε ε ε Wdepl is the depletion width, V0 the built-in voltage and ε= ε0 εr. Figure 22: The variation of the depletion capacitance as a function of bias across the pn-junction. Forward bias: Diffusion capacitance τI kT e C dV dQ C dV dQ C diff p diff diff = = = + junctionnpfor 31 Review the calculation of the depletion width in your first year EE1.3 Semiconductor Devices course. 31 EE2 - Semiconductor Devices 2012 Depletion Capacitance V revers e forwar d
  • 32. The differential resistance rd relates to the slope of the IV characteristic. Easily calculated as a differential conductance: I kT e dV dI g r d d === 1 2.7 Large signal equivalent circuit of a p-n junction diode While a small signal equivalent circuit does not consist of non-linear elements because due to the small variation in applied voltage the IV region used can be assumed linear. This is no longer the case for a large signal equivalent circuit. Linearization is no longer possible because the whole non-linear current-voltage region is used. The large signal equivalent circuit for pn diodes is given in fig. 23. Figure 23: large signal equivalent circuit of pn diode. 2.8 Conclusion The characteristics of a pn diode, at low injection levels (meaning that the injected density of carriers across the junction is much smaller than the majority carrier concentration available), are completely described by the variation of the minority carriers at each side of the junction. The bias voltage across the junction defines the excess carrier concentration at the edges of the depletion region while the Ohmic contacts impose bulk conditions on the material. When recombination of carriers is taken into account, the excess carrier concentration varies exponentially if we take the long diode approximation. If we ignore carrier recombination completely – an assumption that can be made when the diode is sufficiently short – then the excess carrier concentration varies exponentially. The maximum gradient of the excess carrier concentrations determines the current in the pn diode. This maximum gradient occurs at the depletion region edges. Due to the existence of excess carriers in the neutral regions of the diode, delays occur when switching. The density of excess carriers and the bias voltage across the junction are intimately related, this means that the voltage across the junction can only change when the density of excess carriers has changed. When switching from on to off, the depletion region in the pn diode across which the largest part of the voltage drops, can only extend when the excess carriers are removed. Switching times in devices where minority carrier concentration play an important role are normally relatively large compared to switching times in majority devices such as a Schottky diode. 32 EE2 - Semiconductor Devices 2012 C Rs
  • 33. 3. Bipolar Junction Transistor (BJT) 3.1 Review – the short BJT The BJT is a device which has three ohmic contacts to the three different semiconductor layers that are connected together. Basically, the BJT structure consists of a series connection of a pn and np or np and pn diode where the n-regions, respectively p-regions, of both diodes overlap. This makes a pnp and npn BJT. Having a series connection of two pn diodes, there are now two junctions to consider of which the boundaries are not connected to an Ohmic contact. We will see that it is the voltage across each junction separately that determines the currents through the BJT. The BJT is another device in which the minority carriers will play an important role, similar to the pn diode. As in the pn diode the voltage across each junction will determine the density of excess carriers at the edges of the depletion regions of each junction. The calculation of the excess minority carrier concentration across each junction is thus identical to that of the pn diode. As a consequence the currents that are flowing in the different layers of the BJT will be determined by the maximum minority carrier concentration gradients, which will occur near the depletion region edges. Recombination of carriers in the base is very important as it will determine whether the material combination will have amplification or not. Notwithstanding this, very often recombination is ignored and a “short BJT” approximation is used. This will allow easy mathematical formulae to describe the currents and gives relatively good approximations for the collector current. 3.2 Charge transport in BJTs (principle of operation) In order to get an idea of how a BJT functions it is good to review the pn diode. Remember that in a reverse biased p-n junction, the current         −=       1nkT eV stot eII becomes stot II −= and is independent of the magnitude of the reverse bias voltage V. Is is given by:         += p pn n np s L Dp L Dn eAI 00 . The magnitude of Is is determined by the density of minority carriers, pn0 and np0, in each layer. In reverse bias it are minority carriers that are crossing the junction, namely holes flow from the n-type material to the p-type and electrons from the p-type to the n-type. As the number of minority carriers is restricted32, this magnitude determines the current. p n V I V I Isat Figure 1: Left: reverse biased pn-junction. Right: Current-voltage characteristics. Thus if we decrease the doping density in each layer, the magnitude of the minority carriers will increase and the reverse bias current in the pn diode will increase. Of course doping is not a good option for active control of the off-current. Another possible way to control the current density is by shining light of the correct frequency on the junction. This light will be absorbed and creates electron-hole pairs (carrier generation). The minority carriers near the depletion region edge – thus those that feel the electric field across the depletion region – will be swept across the depletion region and thus increase the off-current. This can be done in a controlled way by varying the intensity of the light. More intense light will generate more carriers, and thus more minority carriers near the depletion region edges and thus the off-current will increase with increasing light intensity. This is illustrated in fig. 2 where only an increased injection of holes is considered. 32 Remember that the minority carriers need to be supplied by carrier generation. 33 EE2 - Semiconductor Devices 2012
  • 34. p n V I V I Isat hole injector Figure 2: Left: Holes are injected in the n-type region near the depletion region edge of a reversed biased pn-junction. Right: the off-leakage current increases as the available minority carrier density increases due to the hole injection process. For an all electrical solution to the active control of the off-current in a reversed biased pn diode, we can use a forward biased p+-n junction (+: heavily doped p-side). A heavily doped p layer in a pn junction will cause the total current to be mainly dependent on holes. The reason can be easily seen from the gradients of the minority carriers in each region: in the n-region the gradient is given by       =≈− T EB nnnn V V pppp exp'' 00 and in the p-type layer the gradient is given by       =≈− T EB pppp V V nnnn exp'' 00 . Here VEB>0V (forward bias) and e kT VT = . Since NA >> ND we find that 00 pn np >> and thus the hole minority carrier gradient, that defines the hole diffusion current in the n-region is larger than the electron minority carrier gradient in the p+ region. Since Ip >> In we call a p+n junction a hole injector. Thus if we put this hole injector sufficiently close to a reverse biased pn junction then the hole injector will increase the amount of minority carriers (in this case only holes) that will flow across the junction and thus the off-current increases in exactly the same way as given in fig. 2. p+ n VEB VBC IC IE IB IC VBC p Emitter Collector holes injected holes collected Base Wb IE Figure 3: Left: a combination of a forward biased p+n junction, acting as a hole injector and a reverse biased np junction acting as a hole collector – the BJT. Right: the collector current (holes collected) as a function of the emitter current (≈holes injected). Fig. 3 gives the whole combination of pn and np junction forming a pnp bipolar junction transistor (BJT). The heavily doped p+ layer of the injector diode is called the emitter (E), the layer that is in common for the two diodes is the base (B) and the layer that will collect all the holes that are injected by the p+n diode (thus injected by the EB junction) will be collected by the reverse biased np junction. The p-layer of the hole collecting diode is called the collector (C). If the base width is sufficiently small the collector current that will flow as a function of reverse bias voltage across the BC junction is given in fig. 3 (right). Thus if the emitter current – which is the current across the EB junction – increases, then the collector current is increasing accordingly. The magnitude of the current is determined by the minority carriers that are injected across the EB junction rather than the reverse bias voltage across the BC junction. Note that if we take the approximation that the emitter current consists of a hole current Ip only, and all the injected holes get through 34 EE2 - Semiconductor Devices 2012
  • 35. the base, then the collector current is equal to the emitter current and there is no current amplification between IE and IC. The BJT thus operates by injection and collection of minority carriers. A good BJT is an a-symmetric device: the doping density in the emitter is higher than the doping density in the collector. From the physics we can see that since we want to collect more holes, it needs to be holes that are injected, thus we need a hole injector. Later we will see from the expression of the current amplification factor and the emitter junction injection efficiency that high emitter doping gives good amplification and injection efficiencies. This approach has given us an insight into the relationship between the emitter and collector current in a common base configuration (as given in fig. 3). However what happens in between the common base point (common between the emitter and collector)? Is there a current flowing from this point in or out of the base region? The answer of course is yes. In order to understand this, we have to take a closer look at what all the carriers are doing in the structure under the given biasing conditions. The main carrier flow in a pnp BJT is holes, as seen above. In normal active mode operation of the BJT: VEB>0V and VBC<0V in a pnp BJT, a large amount of holes are injected by the emitter into the base and these are then collected by the collector. However we have seen in pn diodes that both hole and electron currents exist at the same time but not necessarily in the same magnitudes. The magnitudes is determined by the doping densities. We have also seen that recombination of carriers can occur. If recombination of holes occurs in the base region then it can be expected that the collector current will decrease, as there will be less holes available for collection at the collector side. As a consequence there will also be electron currents in the BJT. These electron currents have a direct relationship to the base current in a pnp BJT. In fig. 4 all the different current components that can exist in a BJT are given. p+ n VEBIE IB IC VBC p hole flow electron flow 1 2 34 5 Figure 4: The BJT in common base configuration in forward active mode with the flow of both holes and electrons (flux) indicated with arrows. The numbers indicate different physical events explained in the text below. At the emitter-base junction holes are injected into the base and electrons are injected from the base into the emitter. This means that electrons are disappearing out of the base region. If there would be no re-supply of these disappearing electrons then the density of majority carriers in the base (electrons) would decrease. To accommodate this decrease in majority carriers while maintaining charge neutrality, the depletion region at the EB junction has to adapt. This means that the forward biased voltage across the EB junction decreases and thus reduces the amount of injected carriers. Thus no re-supply of electrons would lower the hole current to zero. Therefore in order to maintain a collector current, the lost electrons from the base through the forward biased EB junction has to be re-supplied by an electron base current. This is indicated in the fig. 4 by arrow no 5. Whilst the injected holes (hole flow in fig. 4) are diffusing through the base, there is a probability for these holes to recombine with the electrons available in the base region. As a consequence of the recombination process the number of holes and electrons in the base is decreasing. If the number of electrons in the base is not re-supplied the charge density relationship in the base would break down and hole current would disappear. In order to maintain the hole current IC for the given biasing conditions, the base contact has to re- 35 EE2 - Semiconductor Devices 2012
  • 36. supply the electrons, this is given by arrow no 4. Arrow no 1 represent the injected holes lost for IC through recombination in the base. The thermally generated electrons and holes make up the reverse saturation current across the base-collector junction. The reverse biased BC junction thus supplies electrons to the base. This reduces the amount of electrons that the base current needs to re-supply. This supply however is found to be dramatically smaller than the re-supply current and will therefore often be ignored. Arrow no 2 are the holes reaching the collector. From this diagram and the need to maintain the given steady state bias conditions, the base current IB can be found to consist of three terms: 0"' CBBBB IIII −+= (1) where BI ' = base current to compensate lost carrier injected into the emitter BI " = base current to re-supply the recombined charge 0CBI = reverse bias leakage current that injects carriers from collector into base (very small) Thus the base current re-supplies the majority carriers that are lost in the base (neglecting ICB0). If these would not be re-supplied, charge neutrality is not maintained unless the depletion regions and thus the voltage drop across the different junctions adapt themselves and thus change the total current IC that is flowing through the device. Although this discussion of the different currents is done for the common base configuration, these currents are exactly the same in the other BJT biasing conditions, common emitter or common collector. The common base configuration is used because it gives a direct insight into the voltage across each junction EB and BC separately, making the analysis the same as for the pn diodes we have discussed in chapter 2. Note that the main difference in analysis is the boundary conditions in the base junctions. These boundary conditions are imposed by the voltage across each junction rather than an ohmic contact as was the case for a single pn junction. This means that the minority carrier excess in the base at the depletion region edges will not be the bulk minority carrier concentration33 but will be determined by the voltage across each junction and thus determined by the formulae (chapter 1 eq.(1)):       == kT eV n n p p e p p n n 0 ' 0 ' (2) The variation of the minority carrier concentration will then be dependent on whether recombination has to be taken into account. Note that a BJT has a short base. However, when recombination is taken into account in order to more accurately predict the current gain, the variation of the minority carriers in the base has to be given as in eq. (9) of chapter 2. To obtain a “good” BJT it is essential to limit the amount of carriers that are lost from the base via recombination and via the current injected from the base into the emitter. In order to deliver the 1st requirement the base needs to be made sufficiently narrow and for the 2nd requirement, the emitter needs to be heavily doped such that carrier injection from emitter to base is a lot larger than carrier injection from base to emitter. This is the reason why BJTs are a-symmetric – the emitter is more heavily doped than base and collector. 3.3 Calculating the currents in a BJT As for the pn diode, we can make the choice of including recombination or not. The choice will depend on the accuracy that is required and the speed with which derivations and calculations have to be done. In a BJT under normal active mode (EB forward biased and BC reverse biased) the short diode approximation, in which recombination is neglected, is often sufficiently accurate to get an idea about device performance. 33 As would be the case for an ohmic contact 36 EE2 - Semiconductor Devices 2012
  • 37. The derivation of the currents is easy for a BJT in the short diode approximation. It that case, both emitter and base layers are thin. For a longer base or in case we want to take recombination into account, the calculations become more complicated. In what follows we will explicitly derive the currents in the case where recombination is not taken into account and we will look into some of the issues, such as boundary conditions and shape of the minority carrier concentration in the base, that are a result of recombination. The short BJT approach Assumptions: • No recombination in the emitter and base region34 • The reverse bias collector current into the base is negligible35 • The depletion regions are neglected In this case and under normal forward active mode, the currents in the emitter base diode determine all the BJT currents completely. The holes that are diffusing through the base will be collected by the collector and thus make the collector current. The electrons that are escaping from the base into the emitter have to be re- supplied by the base current, thus the electron current of the E-B diode defines the base current. The emitter current is the total current in the E-B diode. This gives the well known result: IE=IB+IC A good way to remember this is to draw a BJT symbol with the currents and remember the nodal analysis techniques that you learned in the EE1 Circuit Analysis course. Figure 5: Left: A pnp BJT symbol with the directions of the different currents. Right: an npn BJT symbol with the direction of current. Apply nodal analysis (sum of current into node = sum of currents out of node) in the base node of fig.5: For pnp BJT: IE = IC + IB For npn BJT: IC + IB = IE 34 Whether recombination exists in the collector or not is not important for the derivation of the expression of the current in this case. 35 This can only be done for forward active mode, when the BJT is OFF, thus EB and BC junctions reverse biased then the reverse bias leakage current is important from a viewpoint of power consumption in the OFF state. 37 EE2 - Semiconductor Devices 2012 C E B p p n IE IB IC C E B n n p IE IB IC
  • 38. Figure 6: top: pnp BJT in forward active mode. Bottom: The minority carrier density variation in each layer for the short BJT. The shaded regions are the depletion regions. Notice that the variation of the density of the minority carrier concentrations is linear in each (short) layer. In bipolar devices (thus both electrons and holes play a role in the transport processes) diffusion of minority carriers are the basis for the calculation of the current. Diffusion happens because there is a carrier gradient. Thus the first step in the derivation of the current in the BJT is to determine the minority carrier concentration at each side of the junction for both junctions in the device. This is done in exactly the same way as in the pn diodes. The result is shown in fig. 6. In the emitter at the EB junction the injected minority carrier concentration (electrons coming from the base) is36:       = kT eV pp EB enn 0' (3) In the base at the EB junction the injected minority carrier concentration (holes coming from the emitter) is:       = kT eV nn EB epp 0' (4) In the base at the BC junction the minority carrier holes are injected to the collector and thus we have a reduction of the minority carrier concentration in the base at the reverse biased collector:    − = kT Ve nn epp 0" (5) Remember that diffusion currents are directly related to the gradients of the minority carriers. The minority carrier concentration at the ohmic contact of the emitter and collector imposes the bulk minority carrier concentration37. Thus the electron current of the EB diode is given by: 36 Note that the ‘ indicates forward bias and “ reverse bias. 37 Due to infinite generation-recombination rates in ohmic contacts, the contacts can supply and absorb all excess carriers and thus keep the carrier concentrations constant at bulk conditions. 38 EE2 - Semiconductor Devices 2012 x p + n p VEB VBC xe Wb 0pn mi no rit y ca rri er co nc en tra tio n pn' np" pn" 0pn np'