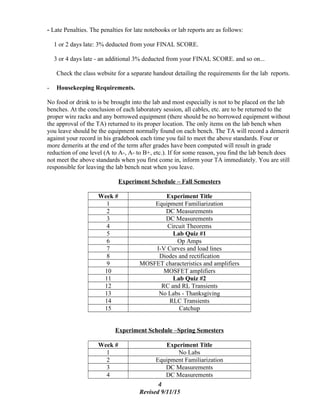
SlideShare a Scribd company logo
1 of 16
Get Homework/Assignment Done
Homeworkping.com
Homework Help
https://www.homeworkping.com/
Research Paper help
https://www.homeworkping.com/
Online Tutoring
https://www.homeworkping.com/
click here for freelancing tutoring sites
University of Minnesota
Department of Electrical and
Computer Engineering
EE 2002 Laboratory Manual
An Introductory Circuits/Electronics
Laboratory Course
Introduction
You will find this laboratory to be different than those you have experienced up to this time. It
was designed with several objectives in mind. First, it is intended to supplement the lecture
course EE2001 and can only be carried out with the maximum benefit if you are acquainted with
the topics being discussed there. Second, it is intended to develop your self-confidence in
laboratory procedures and in drawing conclusions from observations. As a consequence the
instructions are very spare and assume you will be able to extract conclusions from each
experiment and will relate parts of the total lab to each other without being explicitly asked to do
so.
Important Points
- Your grade in this course will depend principally on your in-lab work.
- You are expected to maintain a lab notebook. It must contain a running account of the
experiment. It is not intended to be a book into which you copy notes previously gathered on
the back of an envelope. It must however be legible and coherent. Write in such a way that
another person could perform the same experiment based on your account, and this same person
could understand the conclusions that you drew from your data. It is not necessary to hide your
mistakes. If you make a mistake in an entry simply draw a line through that entry and start over -
you will not be penalized for this.
- The lab notebook should have the following characteristics:
- It should be a bound notebook (spiral bound is OK).
- Lab entries should be dated, and should include:
- Complete circuit diagrams.
2
Revised 9/11/15
- Explanation of circuit, methods, procedures, etc.
- All calculations for designs.
- All measurements (including component values).
- All analysis and comparisons of data with theory.
- Homework
- There is no formal lab homework or pre-lab work in this course, but it will pay great
dividends for you to make a careful reading of the experiment description before arriving in
the laboratory. You will also note that some parts of the "experiments" involve analytical
work which can be better done elsewhere. Most problems students have with this course
are due to lack of preparation prior to coming to lab. If after reading through the lab and
consulting the relevant section of your EE2001 text you do not understand something, seek
out either your TA or the faculty member in charge of the lab.
- If you do not spend at least 30 to 40 minutes studying the experiment, making notes, circuit
diagrams, calculations, etc. in your laboratory notebook, prior to coming into the lab, you
will not finish the experiments. It will be obvious to everyone in the class, including your
classmates, your Teaching Assistant, and your professor, that you have come in unprepared.
And you will receive no extra help for such poor performance.
- MILESTONES.
- In each experiment there will be a few “milestones”. These are specific tasks which must be
accomplished and demonstrated to the TA or professor before going on to the next item. All
milestones must be completed or you will not pass the course. If the milestones are not
completed by the end of the quarter you will receive an F for the course. While the
milestones are not a part of the grade formula, delays in milestone completion will
unavoidably delay the submission of your lab notebook with the corresponding grade
penalty. Lab notebooks and lab reports will not be accepted if the milestones for the
corresponding lab have not been completed.
- Grades
Grades will be determined from the following components of the course:
Lab Notebooks - 30%
Lab Practical Exams - 40% Take them seriously, they are forty minutes to one hour
in duration and they account for a significant portion of
your final grade.
Lab Reports - 30%
Lab notebooks will be collected up to three times during the quarter. They will be due at 4:30
PM three working days after the scheduled completion date of a lab.
Lab reports will be collected one week after scheduled completion of the corresponding lab.
You will be given a schedule during the first week of class which will contain all lab
practical exam dates and notebook and lab report due dates.
3
Revised 9/11/15
- Late Penalties. The penalties for late notebooks or lab reports are as follows:
1 or 2 days late: 3% deducted from your FINAL SCORE.
3 or 4 days late - an additional 3% deducted from your FINAL SCORE. and so on...
Check the class website for a separate handout detailing the requirements for the lab reports.
- Housekeeping Requirements.
No food or drink to is be brought into the lab and most especially is not to be placed on the lab
benches. At the conclusion of each laboratory session, all cables, etc. are to be returned to the
proper wire racks and any borrowed equipment (there should be no borrowed equipment without
the approval of the TA) returned to its proper location. The only items on the lab bench when
you leave should be the equipment normally found on each bench. The TA will record a demerit
against your record in his gradebook each time you fail to meet the above standards. Four or
more demerits at the end of the term after grades have been computed will result in grade
reduction of one level (A to A-, A- to B+, etc.). If for some reason, you find the lab bench does
not meet the above standards when you first come in, inform your TA immediately. You are still
responsible for leaving the lab bench neat when you leave.
Experiment Schedule – Fall Semesters
Week # Experiment Title
1 Equipment Familiarization
2 DC Measurements
3 DC Measurements
4 Circuit Theorems
5 Lab Quiz #1
6 Op Amps
7 I-V Curves and load lines
8 Diodes and rectification
9 MOSFET characteristics and amplifiers
10 MOSFET amplifiers
11 Lab Quiz #2
12 RC and RL Transients
13 No Labs - Thanksgiving
14 RLC Transients
15 Catchup
Experiment Schedule –Spring Semesters
Week # Experiment Title
1 No Labs
2 Equipment Familiarization
3 DC Measurements
4 DC Measurements
4
Revised 9/11/15
5 Circuit Theorems
6 Lab Quiz #1
7 I-V curves and Load Lines
8 Diodes and Rectification
9 MOSFET characteristics and amplifiers
10 MOSFET characteristics and amplifiers
11 Op Amps
12 Lab Quiz #2
13 RC and RL Transients
14 RLC Transients
15 CMOS Logic Inverter
5
Revised 9/11/15
Experiment #1: Lab Procedures &
Equipment Familiarization
Session #1
Introduction
The lab instructor will explain procedures
and expectations for this course. He will
then demonstrate the use of the digital
multimeter (DMM), oscilloscope, function
generator, dc power supply, and how to
wire circuits on the protoboard in each
student lab kit. The student should then
spend the rest of the lab t to become more
familiar with the equipment.
Measurements
1. Connect the 0-20V positive dc supply
terminals from the DC power supply to
Ch1 of the scope and to the as shown in
Fig. 1-1. Vary the setting of the dc output
and compare with the reading of the
DMM and the scope
Figure 1-1. Connection of dc power
supply digital multimetes (DMM) and
oscilloscope for measuring dc voltagse.
Be sure that the DMMis set to read DColts
and that Ch1 of the scope is dc coupled
with the proper vertical scale factor.
2. Display a 4 V peak-to-peak sinewave at
a frequency of 1 kHz on the oscilloscope.
Connect the function generator to the
oscilloscope as shown in Fig.1- 2 to
obtain the display. Adjust both the vertical
sensitivity (volts per division) and
horizontal (time base) sensitivity (seconds,
milliseconds, microseconds) to obtain a
good display showing two or three cycles
of the waveform.
Figure 1- 2. Connection of function
generator to oscilloscope for displaying
and measuring ac waveforms. The
connection of the DMM to measure rms
voltages is also shown.
3. Measure the amplitude of this ac
waveform with the DMM set on the ac
voltage mode. Compare this reading with
the base-to-peak value you observe on the
oscilloscope.
The voltage measurements in steps #2 and
step #3 should have different values. The
DMM is calibrated to display the rms
value of a sinewave which equals 0.707 of
the base-to-peak value of a sinewave.
6
0 – 20V
0 – 20V
+
-
0 - 6V
Triple DC
power supply
Oscilloscope DMM
+
+
-
-
Oscillocope DMMFunction
generator
Oscilloscope Ch1
Outer case of BNC connector is
connected to power system ground
(3rd
prong on AC plug).
Other waveforms such as square waves
and triangular waves will have different
rms-to-base-to-peak ratios as
measurements of step #5 will illustrate.
4, Repeat steps 23 and 34 with square
waves and then triangle waves.
A square wave has an rms value which is
equal to the base-to-peak value. A triangle
wave has an rms value value which is
0.578 of the base-to-peak value.
.
5. Construct the circuit shown below in
Fig. 1-3, sometimes termed a voltage
divider. Use a 4 V peak-to-peak 1 kHz
sinewave for the input and measure the
output voltage with the oscilloscope and
DMM.
The point of this step is to become familiar
with using the protoboard to construct
circuits and make connections to sources
and measurement instruments. Examine
the layout of the protoboard shown below
in Fig. 1-4 and note that a specific column
of component insertion holes are shorted
together. Each individual terminal of a
component should be inserted into a
separate column as illustrated for a resistor
unless it is desired to have terminals
shorted together.
Electrical connections to the function
generator and oscilloscope are made via
so-called BNC connector terminals. The
outer cases of these connectors are directly
connected to the ground (ground pin) of
the ac power plug. When these instruments
are connected to the AC power outlets, all
of the instruments grounds (BNC outer
cases) are shorted together as indicated in
the figure. Any instrument that connects to
the AC power system is configured in this
manner (for reasons of safety). Thus it is
not possible to connect the oscilloscope so
as to measure the voltage across the 4 kΩ
resistor because the 1 k resistor wouldΩ
then be shorted out.
Fig. 1-3. Voltage divider circuit and
instrument grounding.
Fig. 1-4. Diagram of protoboard which is
used to construct circuits for laboratory
measurements.
6. Construct the circuit of Fig. 1-5. Set the
DMM to measure dc currents. In this
configuration the DMM is being used to
measure current.
7
Figure 1-5. Circuit arrangement for
measuring current through a resistor.
Compare the current measured by the
DMM with the current output indicated by
the dc power supply display. They should
be the same.
7. Construct the circuit of Fig. 1-6 and use
it to measure the resistance of several of
the resistors in your lab kit. Make sure to
use the proper set of terminals on the
DMM and set the DMM to measure
resistance.
Figure 1-6. Circuit for determining values
of resistors.
Compare the reading of the DMM with the
value of resistance indicated by the color
code on the resistor body.
Experiment #2: DC Measurements
Sessions #2 and #3
Experiments
1. Measure the voltage of a nominal 1.5v
AAA cell to the nearest millivolt.
2. Determine experimentally the value of
resistor that, when place across the cell,
will make a measurable change in the
measured cell voltage. Calculate the
internal resistance of the cell.
3. Measure the voltage range of each of
the power supply outputs. A later
experiment will require a voltage which
can be adjusted over the range 0 to 40v.
Decide how you would provide such a
voltage.
4. Set a power supply output to the value
of the cell voltage measured in item 1.
Determine the change in this voltage when
the supply is loaded with the resistor used
in item 2.
5. Design a circuit to light the red light-
emitting diode (LED). The LED current
must be about 15 ma (no more!). The
diode voltage will be about 1v but you
must not connect a voltage source directly
to the diode because the current is a very
strong function of this voltage and chances
are that the diode current would exceed the
maximum allowed.
NOTE: The short lead of the diode is the
cathode, i.e. the negative lead.
_________________________________
MILESTONE #2-1: Demonstrate your
LED circuit to your instructor, making
sure that meters are connected to show
diode current and voltage and that there is
no possibility of exceeding the specified
maximum diode current.
__________________________________
Demonstration
8
DC Power
Supply
DMM
1 kΩ
Protoboard
AC (110 Vrms 60 Hz) power plug
Built-in ground
IDC
DMM
The instructor will demonstrate the use of
the oscilloscope to measure periodic
waveforms and to display one variable
versus another. The signal generator will
also be demonstrated.
Experiments
6. Connect a voltage divider to an output
of the power supply. Design it to give an
output that is 1/3 of the supply voltage and
so that neither the power ratings of the
resistors nor the current rating of the
supply are exceeded. The voltage output
of the divider must not change by more
then 1% when loaded with 10KΩ.
7. Design a current divider that will
provide a 1/3 - 2/3 current split. Observe
the current and power limitations as you
did in the previous item. Another design
constraint is that the current meters
inserted to measure the current division
ratio must not upset this ratio.
__________________________________
MILESTONE #2-2: Demonstrate your
current divider. Show that the current
meters have no effect on the current
division.
__________________________________
8. Construct a non-trivial resistive circuit
with at least 2 loops and at least 3 resistors
in each loop. Verify Kirchhoff's laws for
this circuit. Notice that this item is more
"open ended", i.e. there is more room for
individual initiative. These lab instructions
will be increasingly presented in this
mode.
__________________________________
MILESTONE #2-3: Demonstrate your
working circuit. Be prepared to show one
or two branch voltages and how they
compare to those calculated in your notes.
__________________________________
Experiment #3: Circuit Theorems
Session #4
Experiments
1. Construct a resistive circuit containing
series and parallel branches and a DC
voltage source. Measure the voltage at at
least 2 nodes (relative to a reference node)
as a function of the source voltage.
Measure the current in at least 2 branches
as a function of the source voltage.
2. Construct the circuit shown below. Use
the triple power supply at the lab bench.
Note that all three of the outputs have
floating terminals, i.e. not connected to
ground.
Verify the superposition theorem for at
least 2 nodes and 2 branches.
3. Design and construct another resistive
network containing 3 voltage sources.
Determine selected node voltages and
branch currents analytically and
experimentally.
4. Construct the circuit shown below.
.
9
Determine, experimentally and
analytically. the Thevenin equivalent at
the port shown.
__________________________________
MILESTONE #3-1: Explain to your
instructor how you carried out item 4.
Quiz #1 on Exps. #1, 2, and 3
Session #5
Experiment #4: Op Amps
Session #6
Demonstration
Your instructor will demonstrate some
applications of operational amplifiers.
Experiments
1. To ensure that the output of the
amplifier is zero when the differential
input is zero ("offset nulling") the scheme
shown
is used. (The potentiometer is adjusted to
force the output to zero when the input
terminals are both zero.) Design and
construct a non-inverting amplifier with a
voltage gain of approximately 10, null its
offset and measure the gain over the
complete range of input voltages.
2. Power the opamp with +5 and -5v
supplies and monitor its output when one
input is grounded and the other varied a
few millivolts on either side of zero.
3. Repeat with the roles of the input
terminals interchanged.
4. Design and construct a circuit which
will indicate whether an unknown voltage
is greater than or less than a given
reference voltage. The latter should be
capable of being varied between -5 and +5
volts.
__________________________________
MILESTONE #7-1: Demonstrate how
your circuit can convert a sine wave to a
square wave with a variable duty cycle.
__________________________________
5. To your comparator circuit of item 4
add green and red LED's so that the green
lights up when the input voltage is less
than the reference and the red when it is
greater.
6. Using resistors in the few KΩ range,
design a voltage divider to provide an
output of about 5v from a 15v source.
7. Determine the load on the divider which
will drop the output voltage to 75% of the
no load value.
8. Construct a 741 buffer (unity gain, non-
inverting amplifier) to insert between the
output of the divider and the load
determined in item 7.
10
Experiment #5: I-V Curves and Load
Lines
Session #7
Demonstration
The instructor will demonstrate the small
signal resistance versus dc current level
for a diode and will discuss the load line
method.
Experiments
1. Measure the current vs. voltage relation
of the incandescent lamp supplied. Limit
the current thru the lamp to 100 mA
maximum.
2. Using your data from item 1 and the
load line approach, determine the lamp
current expected for the following values
of power supply voltage and series
resistor.
Voltage Resistance
6V 100 Ω
3V 100Ω
3. Check the results of item 2 by direct
measurement.
4. Build this circuit and, driving it with the
signal generator, display on the scope the
output voltage versus the input voltage.
5. Change the circuit so that it limits for
negative input voltages.
6. Change the circuit so that it limits at
+2 v.
7. Change the circuit so that it limits at
+2v and also at -2v.
__________________________________
MILESTONE #5-1: Demonstrate your
circuit of item 7.
__________________________________
8. Show the influence of your circuit of
item 7 on various input periodic
waveforms.
Experiment #6: Diodes & Rectification
Session #8
.
Experiments
1. Measure the current-voltage relation for
the 1N4740 diode over its entire allowable
ranges of voltage and current. Obtain a
collection of data points.
2. Use the data of item 1 to determine the
small signal resistance of the diode at
forward currents of 10, 20 and 30 ma.
3. Devise a large-signal model for your
Zener diode, applicable in the reverse
breakdown region for currents from 10 to
50 ma.
4. Repeat the forward bias measurements
of step 1 using the DiodeIV and use the
11
Demonstration
The measurements in steps 1 and 2
were point-by-point manual
measurements. These measurements
can be automated using the PXI
equipment run under the control of a
LabView VI (virtual instrument)
entitled DiodeIV which is found in the
UofMNIV folder. Your lab instructor
will demonstrate the use of this virtual
instrument.
saved data to repeat step 2. Compare with
the manually acquired results.
5. Examine the output of this circuit for 1
KHz sinusoidal input amplitudes from 0.5
to 5v.
6. Investigate the following power supply
circuit (known as a “bridge” circuit).
Note: The output is floating with respect to
ground (i.e. both ends of the output are off
of ground). Hence a single scope channel
cannot be put across the load. Instead both
channels of the scope must be set up as
shown. The polarity of Ch 1 should be
inverted with respect to Ch 0. Both
channels must have the same V/cm setting
and both reference levels (zero voltage
lines) must lie on top of each other. When
the scope is set up in this manner, it is
acting as a so-called pseudo-differential
input. Trigger the scope from Ch 0.
7. Determine the effect of placing a large
capacitor across the load of the circuit of
item 6. Make sure you observe the proper
polarity when connecting the capacitor.
__________________________________
MILESTONE #6-1: Demonstrate the
load voltage of the circuit of item 6, with
and without the “filter” capacitor.
__________________________________
Experiment #7: MOSFET
Characteristics and Amplifiers
Sessions #9 and #10
Demonstration – session #9
The instructor will demonstrate the use of
a LabView VI (found in the UofMNIV
folder) entitled FETVI which automates
the measurements of FET output
characteristics (drain current as a function
of drain-source voltage with gate-source
voltage as a parameter) and transfer
characteristics (drain current as a function
of gate-source voltage).
Experiments
The experiments below all involve
measurements on a MOSFET. You will
use the 2N7000 n-channel enhancement
MOSFETs which are part of your lab kit.
The diagram shown below shows the
pinouts.
1. Use the FETVI to measure ID versus
VDS for various values of VGS for two
separate 2N7000 MOSFETs. Determine
the transconductance of each device at
12
several drain current levels. The drain-
source voltage should go to at least 5V to
insure the devices go into the active
(saturation) region but do not exceed 10V.
Limit the maximum drain current to 40
mA or less.
2. Determine the threshold voltage of each
device.
__________________________________
MILESTONE #7-1: Explain to your
instructor how you deduced the threshold
voltages.
__________________________________
3. Use the data of item 1 to determine the
conductance parameters (K) for the 2
devices. Using a reasonable value of
carrier mobility, determine the oxide
thickness for the 2 devices.
4. Determine the channel length
modulation parameter (λ) or equivalently
the Early voltage VA = 1/λ for the n-
channel MOSFET using the data from step
1.
Demonstration – session #9
The instructor will demonstrate some
methods of biasing FET’s.
Experiments
5. Design circuit arrangement(s) to
measure the small-signal ac
transconductance for both of the devices
used in step #1. Make the measurements at
1 kHz and at several values of dc drain
current.
__________________________________
MILESTONE #7-2: Before taking any
measurements, explain the circuit to your
instructor.
__________________________________
6. Construct and test the common source
MOSFET amplifiier shown below using
one of the n-channel MOSFET measured
in Step #1. Measure the following small
signal parameters at a frequency of 1 kHz:
a. Input resistance Rin seen at the Vi
terminals.
b. Voltage gain Vo/Vi
c. Power drawn from the 10 V power
supply.
d. Maximum undistorted sinewave output
voltage swing in volts pp.
__________________________________
MILESTONE #7-3: Demonstrate your
operating amplifier to your instructor.
7. Design and construct the MOSFET
current mirror (current sink) shown below
using the 2N7000 MOSFETS. Determine
the range of Rload over which the current
through the resistor is a reasonably
constant current of 5 mA.
13
Quiz #2 (Exps. 1-7)
Session #11
Experiment #8
Transients in RC and RL Circuits
Sessions #12
1. Construct a simple RC single time
constant circuit of the form shown below.
Choose component values such as to make
the time constant about 0.1ms and
determine the time constant
experimentally by observing output
voltage when a square wave is applied to
the input port. The value of R should be
significantly larger than the output
resistance of the source proving the input
voltage Vin.
2. Measure the rise and fall time of the
output waveform in step #1.
MILESTONE #8-1. Demonstrate your
measurement of the rise and fall time
measured in step #2 to your lab instructor.
__________________________________
3. Apply a square wave to the circuit used
in Step #1 and note the output waveform.
The period of the square wave should be
much shorter than the time constant found
in step #1.
4. Many applications require that a sharp
pulse be generated to mark the time at
which a rapid change occurs in a signal.
Design a simple circuit based on the work
of the preceding items which will generate
a sharp spike whenever the square wave
input changes sign.
5. The circuit used in step #4 is a
differentiator circuit over some range of
input frequencies. Apply a triangular wave
to the circuit used in step #3. Vary the
frequency of the triangular wave and
determine approximately the highest
frequency that the circuit behaves as a
differentiator.
6. Construct the single RL single time
constant circuit shown below. Use the 100
mH inductor in your lab kit and use a 1 kΩ
resistor for R. Measure the time constant
of the circuit.
7. Determine if the RL circuit of step #6 is
and integrator or differentiator.
Approximately determine the maximum
frequency (if the circuit is a differentiator)
or the minimum frequency (if the circuit is
14
an integrator) that the circuit will function
as a differentiator or integrator.
MILESTONE #8-2. Show the operation
of the RL circuit of step #7 as either a
differentiator or integrator and show the
maximum or minimum frequency of
operation as either a differentiator or
integrator.
__________________________________
8. Take the components (R and L) used in
the circuit for steps #5 and #6 and
construct a circuit that has the same square
wave response as the circuit of step #1.
Determine the rise and fall time of the
output waveform.
Experiment #9
Transients in RLC Circuits
Session #13
1. Construct the RLC circuit shown below.
Drive the circuit with a 2V p-p square
wave with a frequency of 100 Hz. Using
the observed output waveform, determine
the resonant frequency fo(2 fπ o={LC}-0.5)
and quality factor Q (Q= 2 fπ oL/RL) of the
circuit.
2. Replace the 5 nF capacitance with a 20
nF capacitance Again determine the
resonant frequency and quality factor
using the same input signal as in step #1.
__________________________________
MILESTONE #9-1. Demonstrate the
operation of the series resonant circuit of
step #1 to your instructor. Using your
measured value of Q, estimate the inductor
series resistance RL and show your lab
instructor.
3. Construct the parallel RLC circuit
shown below. Drive the circuit with a 4V
p-p square wave with a frequency of 200
Hz. Using the observed output voltage,
determine the resonant frequency and
quality factor Q of the circuit.
4. Replace the 5 nF capacitance with a 20
nF capacitance Again determine the
resonant frequency and quality factor
using the same input signal as in step #3.
5. Revise the circuit of step #4 so that it is
critically damped (Qp = 0.5) without
changing the value of the capacitor or
inductor. Drive the circuit with the same
input signal as in step #3 and verify that
the circuit is critically damped. What value
of resistance critically damps the circuit?
Experiment #10: CMOS Logic Inverter
Session #14
(NOT DONE IN FALL SEMESTERS)
1. Measure the transfer curve Vy versus
Va for one of the six CMOS inverters on
the 78HCU04 IC in you lab kit. Bias the
inverter with 5V (i.e. VCC = 5V). Vary
15
46 kΩ
100 mHVin
Vout
+ +
- -
5 nF
VA from 0-5V. See the pinout diagram
and logic diagram below. Be sure that the
VA terminals of the five unused inverters
are shorted to ground so that they cannot
influence the measurements. (If the VA of
the unused inverters are left floating, they
may acquire a charge and hence a voltage
that could turn on the unused inverters.)
2. Use your measured transfer curve to
determine the logic level voltages (positive
logic) VOH, VOL, VIH, and VIL.
Estimate the noise margin of the inverter
from these voltage levels.
3. Load the output of an inverter with a 10
nF capacitor. Determine the average
power drawn from the 5V VCC supply as
you vary the frequency of a 5V base-to-
peak square wave to the input A of the
inverter. Go to frequencies as high as 1
MHz. Use the interface circuit shown
below to apply the input signal from the
function generator to inverter input. The
purpose of this interface circuit is to
prevent negative going pulses from being
applied to the inverter.
4. Measure the propagation delay of the
inverter using the ring oscillator shown
below. It can be shown that the
propagation delay is given by tpd = T/(2N)
where T is the period of oscillation of the
ring oscillator and N is then number of
inverters in the oscillator. As before use
5V for the VCC supply. If the circuit is set
up properly, the circuit will oscillate
(produce periodic waveforms) without any
ac input
MILESTONE #9-1. Demonstrate your
measurement of the propagation delay to
your lab instructor.
16

More Related Content

Similar to 206891661 ee2002-lab-manual-fall-2013

239587360 ee200-lab-manual
239587360 ee200-lab-manual239587360 ee200-lab-manual
239587360 ee200-lab-manualhomeworkping4
 
1 P a g e A semester of Experiments for ECE 225 .docx
1  P a g e  A semester of Experiments for ECE 225  .docx1  P a g e  A semester of Experiments for ECE 225  .docx
1 P a g e A semester of Experiments for ECE 225 .docxmercysuttle
 
Course Home - Lab Report CriteriaThe formal Lab Report is .docx
Course Home - Lab Report CriteriaThe formal Lab Report is .docxCourse Home - Lab Report CriteriaThe formal Lab Report is .docx
Course Home - Lab Report CriteriaThe formal Lab Report is .docxvanesaburnand
 
EEE-214 Electronics Lab Manual.pdf
EEE-214 Electronics Lab Manual.pdfEEE-214 Electronics Lab Manual.pdf
EEE-214 Electronics Lab Manual.pdfmAkEiTeAsY13
 
Analog Communications Lab Laboratory Manual
Analog Communications Lab Laboratory ManualAnalog Communications Lab Laboratory Manual
Analog Communications Lab Laboratory ManualJanelle Martinez
 
ELCM 390 orientation
ELCM 390 orientationELCM 390 orientation
ELCM 390 orientationlisalouisesw
 
ELCM 390 orientation
ELCM 390 orientationELCM 390 orientation
ELCM 390 orientationlisalouisesw
 
Ecet 365 Enhance teaching / snaptutorial.com
Ecet 365   Enhance teaching / snaptutorial.comEcet 365   Enhance teaching / snaptutorial.com
Ecet 365 Enhance teaching / snaptutorial.comDavis116a
 
ME 121 Syllabus_FALL_2016_090216
ME 121 Syllabus_FALL_2016_090216ME 121 Syllabus_FALL_2016_090216
ME 121 Syllabus_FALL_2016_090216Matthew Pasch
 
Introduction to Electrical Engineering Laboratory
Introduction to Electrical Engineering LaboratoryIntroduction to Electrical Engineering Laboratory
Introduction to Electrical Engineering LaboratoryIsuru Premaratne
 
ECET 365 Exceptional Education / snaptutorial.com
ECET 365 Exceptional Education / snaptutorial.comECET 365 Exceptional Education / snaptutorial.com
ECET 365 Exceptional Education / snaptutorial.comdonaldzs109
 
ECET 365 Success Begins/Newtonhelp.com
ECET 365 Success Begins/Newtonhelp.comECET 365 Success Begins/Newtonhelp.com
ECET 365 Success Begins/Newtonhelp.comledlang1
 
Overview of lab 2016.pdf
Overview of lab 2016.pdfOverview of lab 2016.pdf
Overview of lab 2016.pdfsaya155805
 
Ecet 365 Education Redefined - snaptutorial.com
Ecet 365    Education Redefined - snaptutorial.comEcet 365    Education Redefined - snaptutorial.com
Ecet 365 Education Redefined - snaptutorial.comDavisMurphyC85
 
Lab manual for Basic electrical and electronics engineering for first year
Lab manual for Basic electrical and electronics engineering for first yearLab manual for Basic electrical and electronics engineering for first year
Lab manual for Basic electrical and electronics engineering for first yearOmkar Rane
 
ECET 365 Success Begins /newtonhelp.com 
ECET 365 Success Begins /newtonhelp.com ECET 365 Success Begins /newtonhelp.com 
ECET 365 Success Begins /newtonhelp.com myblue134
 

Similar to 206891661 ee2002-lab-manual-fall-2013 (20)

239587360 ee200-lab-manual
239587360 ee200-lab-manual239587360 ee200-lab-manual
239587360 ee200-lab-manual
 
1 P a g e A semester of Experiments for ECE 225 .docx
1  P a g e  A semester of Experiments for ECE 225  .docx1  P a g e  A semester of Experiments for ECE 225  .docx
1 P a g e A semester of Experiments for ECE 225 .docx
 
Course Home - Lab Report CriteriaThe formal Lab Report is .docx
Course Home - Lab Report CriteriaThe formal Lab Report is .docxCourse Home - Lab Report CriteriaThe formal Lab Report is .docx
Course Home - Lab Report CriteriaThe formal Lab Report is .docx
 
EEE-214 Electronics Lab Manual.pdf
EEE-214 Electronics Lab Manual.pdfEEE-214 Electronics Lab Manual.pdf
EEE-214 Electronics Lab Manual.pdf
 
Analog Communications Lab Laboratory Manual
Analog Communications Lab Laboratory ManualAnalog Communications Lab Laboratory Manual
Analog Communications Lab Laboratory Manual
 
ELCM 390 orientation
ELCM 390 orientationELCM 390 orientation
ELCM 390 orientation
 
ELCM 390 orientation
ELCM 390 orientationELCM 390 orientation
ELCM 390 orientation
 
Coupled tanks courseware
Coupled tanks coursewareCoupled tanks courseware
Coupled tanks courseware
 
Ecet 365 Enhance teaching / snaptutorial.com
Ecet 365   Enhance teaching / snaptutorial.comEcet 365   Enhance teaching / snaptutorial.com
Ecet 365 Enhance teaching / snaptutorial.com
 
Syllabus_VT_ECE_2054_Spring2015
Syllabus_VT_ECE_2054_Spring2015Syllabus_VT_ECE_2054_Spring2015
Syllabus_VT_ECE_2054_Spring2015
 
ME 121 Syllabus_FALL_2016_090216
ME 121 Syllabus_FALL_2016_090216ME 121 Syllabus_FALL_2016_090216
ME 121 Syllabus_FALL_2016_090216
 
Introduction to Electrical Engineering Laboratory
Introduction to Electrical Engineering LaboratoryIntroduction to Electrical Engineering Laboratory
Introduction to Electrical Engineering Laboratory
 
electronics lab.doc
electronics lab.docelectronics lab.doc
electronics lab.doc
 
ECET 365 Exceptional Education / snaptutorial.com
ECET 365 Exceptional Education / snaptutorial.comECET 365 Exceptional Education / snaptutorial.com
ECET 365 Exceptional Education / snaptutorial.com
 
ECET 365 Success Begins/Newtonhelp.com
ECET 365 Success Begins/Newtonhelp.comECET 365 Success Begins/Newtonhelp.com
ECET 365 Success Begins/Newtonhelp.com
 
Overview of lab 2016.pdf
Overview of lab 2016.pdfOverview of lab 2016.pdf
Overview of lab 2016.pdf
 
Ecet 365 Education Redefined - snaptutorial.com
Ecet 365    Education Redefined - snaptutorial.comEcet 365    Education Redefined - snaptutorial.com
Ecet 365 Education Redefined - snaptutorial.com
 
Coupled tanks
Coupled tanksCoupled tanks
Coupled tanks
 
Lab manual for Basic electrical and electronics engineering for first year
Lab manual for Basic electrical and electronics engineering for first yearLab manual for Basic electrical and electronics engineering for first year
Lab manual for Basic electrical and electronics engineering for first year
 
ECET 365 Success Begins /newtonhelp.com 
ECET 365 Success Begins /newtonhelp.com ECET 365 Success Begins /newtonhelp.com 
ECET 365 Success Begins /newtonhelp.com 
 

More from homeworkping7

207797480 effective-study-skills-3
207797480 effective-study-skills-3207797480 effective-study-skills-3
207797480 effective-study-skills-3homeworkping7
 
207745685 b-777-oral-study
207745685 b-777-oral-study207745685 b-777-oral-study
207745685 b-777-oral-studyhomeworkping7
 
207702106 spec-pro-cases
207702106 spec-pro-cases207702106 spec-pro-cases
207702106 spec-pro-caseshomeworkping7
 
207619526 urc-case-study
207619526 urc-case-study207619526 urc-case-study
207619526 urc-case-studyhomeworkping7
 
207528705 family-case-study-1
207528705 family-case-study-1207528705 family-case-study-1
207528705 family-case-study-1homeworkping7
 
207492751 examples-of-unethical-behavior-in-the-workplace
207492751 examples-of-unethical-behavior-in-the-workplace207492751 examples-of-unethical-behavior-in-the-workplace
207492751 examples-of-unethical-behavior-in-the-workplacehomeworkping7
 
207372012 long-case-rawalo-dedi
207372012 long-case-rawalo-dedi207372012 long-case-rawalo-dedi
207372012 long-case-rawalo-dedihomeworkping7
 
207287040 a-study-on-impact-of-ites-sectors-in-india
207287040 a-study-on-impact-of-ites-sectors-in-india207287040 a-study-on-impact-of-ites-sectors-in-india
207287040 a-study-on-impact-of-ites-sectors-in-indiahomeworkping7
 
207285085 classic-knitwear-case-study
207285085 classic-knitwear-case-study207285085 classic-knitwear-case-study
207285085 classic-knitwear-case-studyhomeworkping7
 
207244508 united-color-of-benaton
207244508 united-color-of-benaton207244508 united-color-of-benaton
207244508 united-color-of-benatonhomeworkping7
 
207135483 oblicon-case-digestsxavier
207135483 oblicon-case-digestsxavier207135483 oblicon-case-digestsxavier
207135483 oblicon-case-digestsxavierhomeworkping7
 
207095812 supply-chain-management
207095812 supply-chain-management207095812 supply-chain-management
207095812 supply-chain-managementhomeworkping7
 
207043126 ikea-case-study-solution
207043126 ikea-case-study-solution207043126 ikea-case-study-solution
207043126 ikea-case-study-solutionhomeworkping7
 
206915421 avatar-case-study
206915421 avatar-case-study206915421 avatar-case-study
206915421 avatar-case-studyhomeworkping7
 
206885611 eskom-ee-simama-ranta-2014
206885611 eskom-ee-simama-ranta-2014206885611 eskom-ee-simama-ranta-2014
206885611 eskom-ee-simama-ranta-2014homeworkping7
 
206883782 lawyers-fiduciary-obligations
206883782 lawyers-fiduciary-obligations206883782 lawyers-fiduciary-obligations
206883782 lawyers-fiduciary-obligationshomeworkping7
 
206718637 a-study-on-quality-of-work-life-of-employees
206718637 a-study-on-quality-of-work-life-of-employees206718637 a-study-on-quality-of-work-life-of-employees
206718637 a-study-on-quality-of-work-life-of-employeeshomeworkping7
 
206569099 ben-final-case-study-osmak
206569099 ben-final-case-study-osmak206569099 ben-final-case-study-osmak
206569099 ben-final-case-study-osmakhomeworkping7
 

More from homeworkping7 (20)

207797480 effective-study-skills-3
207797480 effective-study-skills-3207797480 effective-study-skills-3
207797480 effective-study-skills-3
 
207745685 b-777-oral-study
207745685 b-777-oral-study207745685 b-777-oral-study
207745685 b-777-oral-study
 
207702106 spec-pro-cases
207702106 spec-pro-cases207702106 spec-pro-cases
207702106 spec-pro-cases
 
207619526 urc-case-study
207619526 urc-case-study207619526 urc-case-study
207619526 urc-case-study
 
207528705 family-case-study-1
207528705 family-case-study-1207528705 family-case-study-1
207528705 family-case-study-1
 
207492751 examples-of-unethical-behavior-in-the-workplace
207492751 examples-of-unethical-behavior-in-the-workplace207492751 examples-of-unethical-behavior-in-the-workplace
207492751 examples-of-unethical-behavior-in-the-workplace
 
207402181 ee-ass1
207402181 ee-ass1207402181 ee-ass1
207402181 ee-ass1
 
207372012 long-case-rawalo-dedi
207372012 long-case-rawalo-dedi207372012 long-case-rawalo-dedi
207372012 long-case-rawalo-dedi
 
207287040 a-study-on-impact-of-ites-sectors-in-india
207287040 a-study-on-impact-of-ites-sectors-in-india207287040 a-study-on-impact-of-ites-sectors-in-india
207287040 a-study-on-impact-of-ites-sectors-in-india
 
207285085 classic-knitwear-case-study
207285085 classic-knitwear-case-study207285085 classic-knitwear-case-study
207285085 classic-knitwear-case-study
 
207244508 united-color-of-benaton
207244508 united-color-of-benaton207244508 united-color-of-benaton
207244508 united-color-of-benaton
 
207137236 ee2207-lm
207137236 ee2207-lm207137236 ee2207-lm
207137236 ee2207-lm
 
207135483 oblicon-case-digestsxavier
207135483 oblicon-case-digestsxavier207135483 oblicon-case-digestsxavier
207135483 oblicon-case-digestsxavier
 
207095812 supply-chain-management
207095812 supply-chain-management207095812 supply-chain-management
207095812 supply-chain-management
 
207043126 ikea-case-study-solution
207043126 ikea-case-study-solution207043126 ikea-case-study-solution
207043126 ikea-case-study-solution
 
206915421 avatar-case-study
206915421 avatar-case-study206915421 avatar-case-study
206915421 avatar-case-study
 
206885611 eskom-ee-simama-ranta-2014
206885611 eskom-ee-simama-ranta-2014206885611 eskom-ee-simama-ranta-2014
206885611 eskom-ee-simama-ranta-2014
 
206883782 lawyers-fiduciary-obligations
206883782 lawyers-fiduciary-obligations206883782 lawyers-fiduciary-obligations
206883782 lawyers-fiduciary-obligations
 
206718637 a-study-on-quality-of-work-life-of-employees
206718637 a-study-on-quality-of-work-life-of-employees206718637 a-study-on-quality-of-work-life-of-employees
206718637 a-study-on-quality-of-work-life-of-employees
 
206569099 ben-final-case-study-osmak
206569099 ben-final-case-study-osmak206569099 ben-final-case-study-osmak
206569099 ben-final-case-study-osmak
 

Recently uploaded

Presiding Officer Training module 2024 lok sabha elections
Presiding Officer Training module 2024 lok sabha electionsPresiding Officer Training module 2024 lok sabha elections
Presiding Officer Training module 2024 lok sabha electionsanshu789521
 
Introduction to ArtificiaI Intelligence in Higher Education
Introduction to ArtificiaI Intelligence in Higher EducationIntroduction to ArtificiaI Intelligence in Higher Education
Introduction to ArtificiaI Intelligence in Higher Educationpboyjonauth
 
Full Stack Web Development Course for Beginners
Full Stack Web Development Course  for BeginnersFull Stack Web Development Course  for Beginners
Full Stack Web Development Course for BeginnersSabitha Banu
 
Meghan Sutherland In Media Res Media Component
Meghan Sutherland In Media Res Media ComponentMeghan Sutherland In Media Res Media Component
Meghan Sutherland In Media Res Media ComponentInMediaRes1
 
Pharmacognosy Flower 3. Compositae 2023.pdf
Pharmacognosy Flower 3. Compositae 2023.pdfPharmacognosy Flower 3. Compositae 2023.pdf
Pharmacognosy Flower 3. Compositae 2023.pdfMahmoud M. Sallam
 
History Class XII Ch. 3 Kinship, Caste and Class (1).pptx
History Class XII Ch. 3 Kinship, Caste and Class (1).pptxHistory Class XII Ch. 3 Kinship, Caste and Class (1).pptx
History Class XII Ch. 3 Kinship, Caste and Class (1).pptxsocialsciencegdgrohi
 
Painted Grey Ware.pptx, PGW Culture of India
Painted Grey Ware.pptx, PGW Culture of IndiaPainted Grey Ware.pptx, PGW Culture of India
Painted Grey Ware.pptx, PGW Culture of IndiaVirag Sontakke
 
18-04-UA_REPORT_MEDIALITERAСY_INDEX-DM_23-1-final-eng.pdf
18-04-UA_REPORT_MEDIALITERAСY_INDEX-DM_23-1-final-eng.pdf18-04-UA_REPORT_MEDIALITERAСY_INDEX-DM_23-1-final-eng.pdf
18-04-UA_REPORT_MEDIALITERAСY_INDEX-DM_23-1-final-eng.pdfssuser54595a
 
Software Engineering Methodologies (overview)
Software Engineering Methodologies (overview)Software Engineering Methodologies (overview)
Software Engineering Methodologies (overview)eniolaolutunde
 
How to Make a Pirate ship Primary Education.pptx
How to Make a Pirate ship Primary Education.pptxHow to Make a Pirate ship Primary Education.pptx
How to Make a Pirate ship Primary Education.pptxmanuelaromero2013
 
Solving Puzzles Benefits Everyone (English).pptx
Solving Puzzles Benefits Everyone (English).pptxSolving Puzzles Benefits Everyone (English).pptx
Solving Puzzles Benefits Everyone (English).pptxOH TEIK BIN
 
Employee wellbeing at the workplace.pptx
Employee wellbeing at the workplace.pptxEmployee wellbeing at the workplace.pptx
Employee wellbeing at the workplace.pptxNirmalaLoungPoorunde1
 
Proudly South Africa powerpoint Thorisha.pptx
Proudly South Africa powerpoint Thorisha.pptxProudly South Africa powerpoint Thorisha.pptx
Proudly South Africa powerpoint Thorisha.pptxthorishapillay1
 
Interactive Powerpoint_How to Master effective communication
Interactive Powerpoint_How to Master effective communicationInteractive Powerpoint_How to Master effective communication
Interactive Powerpoint_How to Master effective communicationnomboosow
 
CARE OF CHILD IN INCUBATOR..........pptx
CARE OF CHILD IN INCUBATOR..........pptxCARE OF CHILD IN INCUBATOR..........pptx
CARE OF CHILD IN INCUBATOR..........pptxGaneshChakor2
 
Framing an Appropriate Research Question 6b9b26d93da94caf993c038d9efcdedb.pdf
Framing an Appropriate Research Question 6b9b26d93da94caf993c038d9efcdedb.pdfFraming an Appropriate Research Question 6b9b26d93da94caf993c038d9efcdedb.pdf
Framing an Appropriate Research Question 6b9b26d93da94caf993c038d9efcdedb.pdfUjwalaBharambe
 
Organic Name Reactions for the students and aspirants of Chemistry12th.pptx
Organic Name Reactions  for the students and aspirants of Chemistry12th.pptxOrganic Name Reactions  for the students and aspirants of Chemistry12th.pptx
Organic Name Reactions for the students and aspirants of Chemistry12th.pptxVS Mahajan Coaching Centre
 
Hierarchy of management that covers different levels of management
Hierarchy of management that covers different levels of managementHierarchy of management that covers different levels of management
Hierarchy of management that covers different levels of managementmkooblal
 
POINT- BIOCHEMISTRY SEM 2 ENZYMES UNIT 5.pptx
POINT- BIOCHEMISTRY SEM 2 ENZYMES UNIT 5.pptxPOINT- BIOCHEMISTRY SEM 2 ENZYMES UNIT 5.pptx
POINT- BIOCHEMISTRY SEM 2 ENZYMES UNIT 5.pptxSayali Powar
 

Recently uploaded (20)

Presiding Officer Training module 2024 lok sabha elections
Presiding Officer Training module 2024 lok sabha electionsPresiding Officer Training module 2024 lok sabha elections
Presiding Officer Training module 2024 lok sabha elections
 
Introduction to ArtificiaI Intelligence in Higher Education
Introduction to ArtificiaI Intelligence in Higher EducationIntroduction to ArtificiaI Intelligence in Higher Education
Introduction to ArtificiaI Intelligence in Higher Education
 
Full Stack Web Development Course for Beginners
Full Stack Web Development Course  for BeginnersFull Stack Web Development Course  for Beginners
Full Stack Web Development Course for Beginners
 
Meghan Sutherland In Media Res Media Component
Meghan Sutherland In Media Res Media ComponentMeghan Sutherland In Media Res Media Component
Meghan Sutherland In Media Res Media Component
 
Pharmacognosy Flower 3. Compositae 2023.pdf
Pharmacognosy Flower 3. Compositae 2023.pdfPharmacognosy Flower 3. Compositae 2023.pdf
Pharmacognosy Flower 3. Compositae 2023.pdf
 
History Class XII Ch. 3 Kinship, Caste and Class (1).pptx
History Class XII Ch. 3 Kinship, Caste and Class (1).pptxHistory Class XII Ch. 3 Kinship, Caste and Class (1).pptx
History Class XII Ch. 3 Kinship, Caste and Class (1).pptx
 
Painted Grey Ware.pptx, PGW Culture of India
Painted Grey Ware.pptx, PGW Culture of IndiaPainted Grey Ware.pptx, PGW Culture of India
Painted Grey Ware.pptx, PGW Culture of India
 
18-04-UA_REPORT_MEDIALITERAСY_INDEX-DM_23-1-final-eng.pdf
18-04-UA_REPORT_MEDIALITERAСY_INDEX-DM_23-1-final-eng.pdf18-04-UA_REPORT_MEDIALITERAСY_INDEX-DM_23-1-final-eng.pdf
18-04-UA_REPORT_MEDIALITERAСY_INDEX-DM_23-1-final-eng.pdf
 
Software Engineering Methodologies (overview)
Software Engineering Methodologies (overview)Software Engineering Methodologies (overview)
Software Engineering Methodologies (overview)
 
How to Make a Pirate ship Primary Education.pptx
How to Make a Pirate ship Primary Education.pptxHow to Make a Pirate ship Primary Education.pptx
How to Make a Pirate ship Primary Education.pptx
 
Solving Puzzles Benefits Everyone (English).pptx
Solving Puzzles Benefits Everyone (English).pptxSolving Puzzles Benefits Everyone (English).pptx
Solving Puzzles Benefits Everyone (English).pptx
 
Employee wellbeing at the workplace.pptx
Employee wellbeing at the workplace.pptxEmployee wellbeing at the workplace.pptx
Employee wellbeing at the workplace.pptx
 
Proudly South Africa powerpoint Thorisha.pptx
Proudly South Africa powerpoint Thorisha.pptxProudly South Africa powerpoint Thorisha.pptx
Proudly South Africa powerpoint Thorisha.pptx
 
Interactive Powerpoint_How to Master effective communication
Interactive Powerpoint_How to Master effective communicationInteractive Powerpoint_How to Master effective communication
Interactive Powerpoint_How to Master effective communication
 
CARE OF CHILD IN INCUBATOR..........pptx
CARE OF CHILD IN INCUBATOR..........pptxCARE OF CHILD IN INCUBATOR..........pptx
CARE OF CHILD IN INCUBATOR..........pptx
 
Model Call Girl in Tilak Nagar Delhi reach out to us at 🔝9953056974🔝
Model Call Girl in Tilak Nagar Delhi reach out to us at 🔝9953056974🔝Model Call Girl in Tilak Nagar Delhi reach out to us at 🔝9953056974🔝
Model Call Girl in Tilak Nagar Delhi reach out to us at 🔝9953056974🔝
 
Framing an Appropriate Research Question 6b9b26d93da94caf993c038d9efcdedb.pdf
Framing an Appropriate Research Question 6b9b26d93da94caf993c038d9efcdedb.pdfFraming an Appropriate Research Question 6b9b26d93da94caf993c038d9efcdedb.pdf
Framing an Appropriate Research Question 6b9b26d93da94caf993c038d9efcdedb.pdf
 
Organic Name Reactions for the students and aspirants of Chemistry12th.pptx
Organic Name Reactions  for the students and aspirants of Chemistry12th.pptxOrganic Name Reactions  for the students and aspirants of Chemistry12th.pptx
Organic Name Reactions for the students and aspirants of Chemistry12th.pptx
 
Hierarchy of management that covers different levels of management
Hierarchy of management that covers different levels of managementHierarchy of management that covers different levels of management
Hierarchy of management that covers different levels of management
 
POINT- BIOCHEMISTRY SEM 2 ENZYMES UNIT 5.pptx
POINT- BIOCHEMISTRY SEM 2 ENZYMES UNIT 5.pptxPOINT- BIOCHEMISTRY SEM 2 ENZYMES UNIT 5.pptx
POINT- BIOCHEMISTRY SEM 2 ENZYMES UNIT 5.pptx
 

206891661 ee2002-lab-manual-fall-2013

  • 1. Get Homework/Assignment Done Homeworkping.com Homework Help https://www.homeworkping.com/ Research Paper help https://www.homeworkping.com/ Online Tutoring https://www.homeworkping.com/ click here for freelancing tutoring sites University of Minnesota Department of Electrical and Computer Engineering
  • 2. EE 2002 Laboratory Manual An Introductory Circuits/Electronics Laboratory Course Introduction You will find this laboratory to be different than those you have experienced up to this time. It was designed with several objectives in mind. First, it is intended to supplement the lecture course EE2001 and can only be carried out with the maximum benefit if you are acquainted with the topics being discussed there. Second, it is intended to develop your self-confidence in laboratory procedures and in drawing conclusions from observations. As a consequence the instructions are very spare and assume you will be able to extract conclusions from each experiment and will relate parts of the total lab to each other without being explicitly asked to do so. Important Points - Your grade in this course will depend principally on your in-lab work. - You are expected to maintain a lab notebook. It must contain a running account of the experiment. It is not intended to be a book into which you copy notes previously gathered on the back of an envelope. It must however be legible and coherent. Write in such a way that another person could perform the same experiment based on your account, and this same person could understand the conclusions that you drew from your data. It is not necessary to hide your mistakes. If you make a mistake in an entry simply draw a line through that entry and start over - you will not be penalized for this. - The lab notebook should have the following characteristics: - It should be a bound notebook (spiral bound is OK). - Lab entries should be dated, and should include: - Complete circuit diagrams. 2 Revised 9/11/15
  • 3. - Explanation of circuit, methods, procedures, etc. - All calculations for designs. - All measurements (including component values). - All analysis and comparisons of data with theory. - Homework - There is no formal lab homework or pre-lab work in this course, but it will pay great dividends for you to make a careful reading of the experiment description before arriving in the laboratory. You will also note that some parts of the "experiments" involve analytical work which can be better done elsewhere. Most problems students have with this course are due to lack of preparation prior to coming to lab. If after reading through the lab and consulting the relevant section of your EE2001 text you do not understand something, seek out either your TA or the faculty member in charge of the lab. - If you do not spend at least 30 to 40 minutes studying the experiment, making notes, circuit diagrams, calculations, etc. in your laboratory notebook, prior to coming into the lab, you will not finish the experiments. It will be obvious to everyone in the class, including your classmates, your Teaching Assistant, and your professor, that you have come in unprepared. And you will receive no extra help for such poor performance. - MILESTONES. - In each experiment there will be a few “milestones”. These are specific tasks which must be accomplished and demonstrated to the TA or professor before going on to the next item. All milestones must be completed or you will not pass the course. If the milestones are not completed by the end of the quarter you will receive an F for the course. While the milestones are not a part of the grade formula, delays in milestone completion will unavoidably delay the submission of your lab notebook with the corresponding grade penalty. Lab notebooks and lab reports will not be accepted if the milestones for the corresponding lab have not been completed. - Grades Grades will be determined from the following components of the course: Lab Notebooks - 30% Lab Practical Exams - 40% Take them seriously, they are forty minutes to one hour in duration and they account for a significant portion of your final grade. Lab Reports - 30% Lab notebooks will be collected up to three times during the quarter. They will be due at 4:30 PM three working days after the scheduled completion date of a lab. Lab reports will be collected one week after scheduled completion of the corresponding lab. You will be given a schedule during the first week of class which will contain all lab practical exam dates and notebook and lab report due dates. 3 Revised 9/11/15
  • 4. - Late Penalties. The penalties for late notebooks or lab reports are as follows: 1 or 2 days late: 3% deducted from your FINAL SCORE. 3 or 4 days late - an additional 3% deducted from your FINAL SCORE. and so on... Check the class website for a separate handout detailing the requirements for the lab reports. - Housekeeping Requirements. No food or drink to is be brought into the lab and most especially is not to be placed on the lab benches. At the conclusion of each laboratory session, all cables, etc. are to be returned to the proper wire racks and any borrowed equipment (there should be no borrowed equipment without the approval of the TA) returned to its proper location. The only items on the lab bench when you leave should be the equipment normally found on each bench. The TA will record a demerit against your record in his gradebook each time you fail to meet the above standards. Four or more demerits at the end of the term after grades have been computed will result in grade reduction of one level (A to A-, A- to B+, etc.). If for some reason, you find the lab bench does not meet the above standards when you first come in, inform your TA immediately. You are still responsible for leaving the lab bench neat when you leave. Experiment Schedule – Fall Semesters Week # Experiment Title 1 Equipment Familiarization 2 DC Measurements 3 DC Measurements 4 Circuit Theorems 5 Lab Quiz #1 6 Op Amps 7 I-V Curves and load lines 8 Diodes and rectification 9 MOSFET characteristics and amplifiers 10 MOSFET amplifiers 11 Lab Quiz #2 12 RC and RL Transients 13 No Labs - Thanksgiving 14 RLC Transients 15 Catchup Experiment Schedule –Spring Semesters Week # Experiment Title 1 No Labs 2 Equipment Familiarization 3 DC Measurements 4 DC Measurements 4 Revised 9/11/15
  • 5. 5 Circuit Theorems 6 Lab Quiz #1 7 I-V curves and Load Lines 8 Diodes and Rectification 9 MOSFET characteristics and amplifiers 10 MOSFET characteristics and amplifiers 11 Op Amps 12 Lab Quiz #2 13 RC and RL Transients 14 RLC Transients 15 CMOS Logic Inverter 5 Revised 9/11/15
  • 6. Experiment #1: Lab Procedures & Equipment Familiarization Session #1 Introduction The lab instructor will explain procedures and expectations for this course. He will then demonstrate the use of the digital multimeter (DMM), oscilloscope, function generator, dc power supply, and how to wire circuits on the protoboard in each student lab kit. The student should then spend the rest of the lab t to become more familiar with the equipment. Measurements 1. Connect the 0-20V positive dc supply terminals from the DC power supply to Ch1 of the scope and to the as shown in Fig. 1-1. Vary the setting of the dc output and compare with the reading of the DMM and the scope Figure 1-1. Connection of dc power supply digital multimetes (DMM) and oscilloscope for measuring dc voltagse. Be sure that the DMMis set to read DColts and that Ch1 of the scope is dc coupled with the proper vertical scale factor. 2. Display a 4 V peak-to-peak sinewave at a frequency of 1 kHz on the oscilloscope. Connect the function generator to the oscilloscope as shown in Fig.1- 2 to obtain the display. Adjust both the vertical sensitivity (volts per division) and horizontal (time base) sensitivity (seconds, milliseconds, microseconds) to obtain a good display showing two or three cycles of the waveform. Figure 1- 2. Connection of function generator to oscilloscope for displaying and measuring ac waveforms. The connection of the DMM to measure rms voltages is also shown. 3. Measure the amplitude of this ac waveform with the DMM set on the ac voltage mode. Compare this reading with the base-to-peak value you observe on the oscilloscope. The voltage measurements in steps #2 and step #3 should have different values. The DMM is calibrated to display the rms value of a sinewave which equals 0.707 of the base-to-peak value of a sinewave. 6 0 – 20V 0 – 20V + - 0 - 6V Triple DC power supply Oscilloscope DMM + + - - Oscillocope DMMFunction generator Oscilloscope Ch1 Outer case of BNC connector is connected to power system ground (3rd prong on AC plug).
  • 7. Other waveforms such as square waves and triangular waves will have different rms-to-base-to-peak ratios as measurements of step #5 will illustrate. 4, Repeat steps 23 and 34 with square waves and then triangle waves. A square wave has an rms value which is equal to the base-to-peak value. A triangle wave has an rms value value which is 0.578 of the base-to-peak value. . 5. Construct the circuit shown below in Fig. 1-3, sometimes termed a voltage divider. Use a 4 V peak-to-peak 1 kHz sinewave for the input and measure the output voltage with the oscilloscope and DMM. The point of this step is to become familiar with using the protoboard to construct circuits and make connections to sources and measurement instruments. Examine the layout of the protoboard shown below in Fig. 1-4 and note that a specific column of component insertion holes are shorted together. Each individual terminal of a component should be inserted into a separate column as illustrated for a resistor unless it is desired to have terminals shorted together. Electrical connections to the function generator and oscilloscope are made via so-called BNC connector terminals. The outer cases of these connectors are directly connected to the ground (ground pin) of the ac power plug. When these instruments are connected to the AC power outlets, all of the instruments grounds (BNC outer cases) are shorted together as indicated in the figure. Any instrument that connects to the AC power system is configured in this manner (for reasons of safety). Thus it is not possible to connect the oscilloscope so as to measure the voltage across the 4 kΩ resistor because the 1 k resistor wouldΩ then be shorted out. Fig. 1-3. Voltage divider circuit and instrument grounding. Fig. 1-4. Diagram of protoboard which is used to construct circuits for laboratory measurements. 6. Construct the circuit of Fig. 1-5. Set the DMM to measure dc currents. In this configuration the DMM is being used to measure current. 7
  • 8. Figure 1-5. Circuit arrangement for measuring current through a resistor. Compare the current measured by the DMM with the current output indicated by the dc power supply display. They should be the same. 7. Construct the circuit of Fig. 1-6 and use it to measure the resistance of several of the resistors in your lab kit. Make sure to use the proper set of terminals on the DMM and set the DMM to measure resistance. Figure 1-6. Circuit for determining values of resistors. Compare the reading of the DMM with the value of resistance indicated by the color code on the resistor body. Experiment #2: DC Measurements Sessions #2 and #3 Experiments 1. Measure the voltage of a nominal 1.5v AAA cell to the nearest millivolt. 2. Determine experimentally the value of resistor that, when place across the cell, will make a measurable change in the measured cell voltage. Calculate the internal resistance of the cell. 3. Measure the voltage range of each of the power supply outputs. A later experiment will require a voltage which can be adjusted over the range 0 to 40v. Decide how you would provide such a voltage. 4. Set a power supply output to the value of the cell voltage measured in item 1. Determine the change in this voltage when the supply is loaded with the resistor used in item 2. 5. Design a circuit to light the red light- emitting diode (LED). The LED current must be about 15 ma (no more!). The diode voltage will be about 1v but you must not connect a voltage source directly to the diode because the current is a very strong function of this voltage and chances are that the diode current would exceed the maximum allowed. NOTE: The short lead of the diode is the cathode, i.e. the negative lead. _________________________________ MILESTONE #2-1: Demonstrate your LED circuit to your instructor, making sure that meters are connected to show diode current and voltage and that there is no possibility of exceeding the specified maximum diode current. __________________________________ Demonstration 8 DC Power Supply DMM 1 kΩ Protoboard AC (110 Vrms 60 Hz) power plug Built-in ground IDC DMM
  • 9. The instructor will demonstrate the use of the oscilloscope to measure periodic waveforms and to display one variable versus another. The signal generator will also be demonstrated. Experiments 6. Connect a voltage divider to an output of the power supply. Design it to give an output that is 1/3 of the supply voltage and so that neither the power ratings of the resistors nor the current rating of the supply are exceeded. The voltage output of the divider must not change by more then 1% when loaded with 10KΩ. 7. Design a current divider that will provide a 1/3 - 2/3 current split. Observe the current and power limitations as you did in the previous item. Another design constraint is that the current meters inserted to measure the current division ratio must not upset this ratio. __________________________________ MILESTONE #2-2: Demonstrate your current divider. Show that the current meters have no effect on the current division. __________________________________ 8. Construct a non-trivial resistive circuit with at least 2 loops and at least 3 resistors in each loop. Verify Kirchhoff's laws for this circuit. Notice that this item is more "open ended", i.e. there is more room for individual initiative. These lab instructions will be increasingly presented in this mode. __________________________________ MILESTONE #2-3: Demonstrate your working circuit. Be prepared to show one or two branch voltages and how they compare to those calculated in your notes. __________________________________ Experiment #3: Circuit Theorems Session #4 Experiments 1. Construct a resistive circuit containing series and parallel branches and a DC voltage source. Measure the voltage at at least 2 nodes (relative to a reference node) as a function of the source voltage. Measure the current in at least 2 branches as a function of the source voltage. 2. Construct the circuit shown below. Use the triple power supply at the lab bench. Note that all three of the outputs have floating terminals, i.e. not connected to ground. Verify the superposition theorem for at least 2 nodes and 2 branches. 3. Design and construct another resistive network containing 3 voltage sources. Determine selected node voltages and branch currents analytically and experimentally. 4. Construct the circuit shown below. . 9
  • 10. Determine, experimentally and analytically. the Thevenin equivalent at the port shown. __________________________________ MILESTONE #3-1: Explain to your instructor how you carried out item 4. Quiz #1 on Exps. #1, 2, and 3 Session #5 Experiment #4: Op Amps Session #6 Demonstration Your instructor will demonstrate some applications of operational amplifiers. Experiments 1. To ensure that the output of the amplifier is zero when the differential input is zero ("offset nulling") the scheme shown is used. (The potentiometer is adjusted to force the output to zero when the input terminals are both zero.) Design and construct a non-inverting amplifier with a voltage gain of approximately 10, null its offset and measure the gain over the complete range of input voltages. 2. Power the opamp with +5 and -5v supplies and monitor its output when one input is grounded and the other varied a few millivolts on either side of zero. 3. Repeat with the roles of the input terminals interchanged. 4. Design and construct a circuit which will indicate whether an unknown voltage is greater than or less than a given reference voltage. The latter should be capable of being varied between -5 and +5 volts. __________________________________ MILESTONE #7-1: Demonstrate how your circuit can convert a sine wave to a square wave with a variable duty cycle. __________________________________ 5. To your comparator circuit of item 4 add green and red LED's so that the green lights up when the input voltage is less than the reference and the red when it is greater. 6. Using resistors in the few KΩ range, design a voltage divider to provide an output of about 5v from a 15v source. 7. Determine the load on the divider which will drop the output voltage to 75% of the no load value. 8. Construct a 741 buffer (unity gain, non- inverting amplifier) to insert between the output of the divider and the load determined in item 7. 10
  • 11. Experiment #5: I-V Curves and Load Lines Session #7 Demonstration The instructor will demonstrate the small signal resistance versus dc current level for a diode and will discuss the load line method. Experiments 1. Measure the current vs. voltage relation of the incandescent lamp supplied. Limit the current thru the lamp to 100 mA maximum. 2. Using your data from item 1 and the load line approach, determine the lamp current expected for the following values of power supply voltage and series resistor. Voltage Resistance 6V 100 Ω 3V 100Ω 3. Check the results of item 2 by direct measurement. 4. Build this circuit and, driving it with the signal generator, display on the scope the output voltage versus the input voltage. 5. Change the circuit so that it limits for negative input voltages. 6. Change the circuit so that it limits at +2 v. 7. Change the circuit so that it limits at +2v and also at -2v. __________________________________ MILESTONE #5-1: Demonstrate your circuit of item 7. __________________________________ 8. Show the influence of your circuit of item 7 on various input periodic waveforms. Experiment #6: Diodes & Rectification Session #8 . Experiments 1. Measure the current-voltage relation for the 1N4740 diode over its entire allowable ranges of voltage and current. Obtain a collection of data points. 2. Use the data of item 1 to determine the small signal resistance of the diode at forward currents of 10, 20 and 30 ma. 3. Devise a large-signal model for your Zener diode, applicable in the reverse breakdown region for currents from 10 to 50 ma. 4. Repeat the forward bias measurements of step 1 using the DiodeIV and use the 11 Demonstration The measurements in steps 1 and 2 were point-by-point manual measurements. These measurements can be automated using the PXI equipment run under the control of a LabView VI (virtual instrument) entitled DiodeIV which is found in the UofMNIV folder. Your lab instructor will demonstrate the use of this virtual instrument.
  • 12. saved data to repeat step 2. Compare with the manually acquired results. 5. Examine the output of this circuit for 1 KHz sinusoidal input amplitudes from 0.5 to 5v. 6. Investigate the following power supply circuit (known as a “bridge” circuit). Note: The output is floating with respect to ground (i.e. both ends of the output are off of ground). Hence a single scope channel cannot be put across the load. Instead both channels of the scope must be set up as shown. The polarity of Ch 1 should be inverted with respect to Ch 0. Both channels must have the same V/cm setting and both reference levels (zero voltage lines) must lie on top of each other. When the scope is set up in this manner, it is acting as a so-called pseudo-differential input. Trigger the scope from Ch 0. 7. Determine the effect of placing a large capacitor across the load of the circuit of item 6. Make sure you observe the proper polarity when connecting the capacitor. __________________________________ MILESTONE #6-1: Demonstrate the load voltage of the circuit of item 6, with and without the “filter” capacitor. __________________________________ Experiment #7: MOSFET Characteristics and Amplifiers Sessions #9 and #10 Demonstration – session #9 The instructor will demonstrate the use of a LabView VI (found in the UofMNIV folder) entitled FETVI which automates the measurements of FET output characteristics (drain current as a function of drain-source voltage with gate-source voltage as a parameter) and transfer characteristics (drain current as a function of gate-source voltage). Experiments The experiments below all involve measurements on a MOSFET. You will use the 2N7000 n-channel enhancement MOSFETs which are part of your lab kit. The diagram shown below shows the pinouts. 1. Use the FETVI to measure ID versus VDS for various values of VGS for two separate 2N7000 MOSFETs. Determine the transconductance of each device at 12
  • 13. several drain current levels. The drain- source voltage should go to at least 5V to insure the devices go into the active (saturation) region but do not exceed 10V. Limit the maximum drain current to 40 mA or less. 2. Determine the threshold voltage of each device. __________________________________ MILESTONE #7-1: Explain to your instructor how you deduced the threshold voltages. __________________________________ 3. Use the data of item 1 to determine the conductance parameters (K) for the 2 devices. Using a reasonable value of carrier mobility, determine the oxide thickness for the 2 devices. 4. Determine the channel length modulation parameter (λ) or equivalently the Early voltage VA = 1/λ for the n- channel MOSFET using the data from step 1. Demonstration – session #9 The instructor will demonstrate some methods of biasing FET’s. Experiments 5. Design circuit arrangement(s) to measure the small-signal ac transconductance for both of the devices used in step #1. Make the measurements at 1 kHz and at several values of dc drain current. __________________________________ MILESTONE #7-2: Before taking any measurements, explain the circuit to your instructor. __________________________________ 6. Construct and test the common source MOSFET amplifiier shown below using one of the n-channel MOSFET measured in Step #1. Measure the following small signal parameters at a frequency of 1 kHz: a. Input resistance Rin seen at the Vi terminals. b. Voltage gain Vo/Vi c. Power drawn from the 10 V power supply. d. Maximum undistorted sinewave output voltage swing in volts pp. __________________________________ MILESTONE #7-3: Demonstrate your operating amplifier to your instructor. 7. Design and construct the MOSFET current mirror (current sink) shown below using the 2N7000 MOSFETS. Determine the range of Rload over which the current through the resistor is a reasonably constant current of 5 mA. 13
  • 14. Quiz #2 (Exps. 1-7) Session #11 Experiment #8 Transients in RC and RL Circuits Sessions #12 1. Construct a simple RC single time constant circuit of the form shown below. Choose component values such as to make the time constant about 0.1ms and determine the time constant experimentally by observing output voltage when a square wave is applied to the input port. The value of R should be significantly larger than the output resistance of the source proving the input voltage Vin. 2. Measure the rise and fall time of the output waveform in step #1. MILESTONE #8-1. Demonstrate your measurement of the rise and fall time measured in step #2 to your lab instructor. __________________________________ 3. Apply a square wave to the circuit used in Step #1 and note the output waveform. The period of the square wave should be much shorter than the time constant found in step #1. 4. Many applications require that a sharp pulse be generated to mark the time at which a rapid change occurs in a signal. Design a simple circuit based on the work of the preceding items which will generate a sharp spike whenever the square wave input changes sign. 5. The circuit used in step #4 is a differentiator circuit over some range of input frequencies. Apply a triangular wave to the circuit used in step #3. Vary the frequency of the triangular wave and determine approximately the highest frequency that the circuit behaves as a differentiator. 6. Construct the single RL single time constant circuit shown below. Use the 100 mH inductor in your lab kit and use a 1 kΩ resistor for R. Measure the time constant of the circuit. 7. Determine if the RL circuit of step #6 is and integrator or differentiator. Approximately determine the maximum frequency (if the circuit is a differentiator) or the minimum frequency (if the circuit is 14
  • 15. an integrator) that the circuit will function as a differentiator or integrator. MILESTONE #8-2. Show the operation of the RL circuit of step #7 as either a differentiator or integrator and show the maximum or minimum frequency of operation as either a differentiator or integrator. __________________________________ 8. Take the components (R and L) used in the circuit for steps #5 and #6 and construct a circuit that has the same square wave response as the circuit of step #1. Determine the rise and fall time of the output waveform. Experiment #9 Transients in RLC Circuits Session #13 1. Construct the RLC circuit shown below. Drive the circuit with a 2V p-p square wave with a frequency of 100 Hz. Using the observed output waveform, determine the resonant frequency fo(2 fπ o={LC}-0.5) and quality factor Q (Q= 2 fπ oL/RL) of the circuit. 2. Replace the 5 nF capacitance with a 20 nF capacitance Again determine the resonant frequency and quality factor using the same input signal as in step #1. __________________________________ MILESTONE #9-1. Demonstrate the operation of the series resonant circuit of step #1 to your instructor. Using your measured value of Q, estimate the inductor series resistance RL and show your lab instructor. 3. Construct the parallel RLC circuit shown below. Drive the circuit with a 4V p-p square wave with a frequency of 200 Hz. Using the observed output voltage, determine the resonant frequency and quality factor Q of the circuit. 4. Replace the 5 nF capacitance with a 20 nF capacitance Again determine the resonant frequency and quality factor using the same input signal as in step #3. 5. Revise the circuit of step #4 so that it is critically damped (Qp = 0.5) without changing the value of the capacitor or inductor. Drive the circuit with the same input signal as in step #3 and verify that the circuit is critically damped. What value of resistance critically damps the circuit? Experiment #10: CMOS Logic Inverter Session #14 (NOT DONE IN FALL SEMESTERS) 1. Measure the transfer curve Vy versus Va for one of the six CMOS inverters on the 78HCU04 IC in you lab kit. Bias the inverter with 5V (i.e. VCC = 5V). Vary 15 46 kΩ 100 mHVin Vout + + - - 5 nF
  • 16. VA from 0-5V. See the pinout diagram and logic diagram below. Be sure that the VA terminals of the five unused inverters are shorted to ground so that they cannot influence the measurements. (If the VA of the unused inverters are left floating, they may acquire a charge and hence a voltage that could turn on the unused inverters.) 2. Use your measured transfer curve to determine the logic level voltages (positive logic) VOH, VOL, VIH, and VIL. Estimate the noise margin of the inverter from these voltage levels. 3. Load the output of an inverter with a 10 nF capacitor. Determine the average power drawn from the 5V VCC supply as you vary the frequency of a 5V base-to- peak square wave to the input A of the inverter. Go to frequencies as high as 1 MHz. Use the interface circuit shown below to apply the input signal from the function generator to inverter input. The purpose of this interface circuit is to prevent negative going pulses from being applied to the inverter. 4. Measure the propagation delay of the inverter using the ring oscillator shown below. It can be shown that the propagation delay is given by tpd = T/(2N) where T is the period of oscillation of the ring oscillator and N is then number of inverters in the oscillator. As before use 5V for the VCC supply. If the circuit is set up properly, the circuit will oscillate (produce periodic waveforms) without any ac input MILESTONE #9-1. Demonstrate your measurement of the propagation delay to your lab instructor. 16