Sonagachi ( Call Girls ) Kolkata ✔ 6297143586 ✔ Hot Model With Sexy Bhabi Rea...
15832945
1. STATISTICS OF SURFACE-LAYER TURBULENCE OVER TERRAIN
WITH METRE-SCALE HETEROGENEITY
EDGAR L ANDREAS1 , REGINALD J. HILL2 , JAMES R. GOSZ3 ,
DOUGLAS I. MOORE3 , WILLIAM D. OTTO2 and ACHANTA D. SARMA4
1
U.S. Army Cold Regions Research and Engineering Laboratory, 72 Lyme Road, Hanover, New
Hampshire 03755-1290, U.S.A.
2
National Oceanic and Atmospheric Administration, Environmental Technology Laboratory, 325
Broadway, Boulder, Colorado 80303-3328, U.S.A.
3
Biology Department, University of New Mexico, Albuquerque, New Mexico 87131, U.S.A.
4
R. & T. Unit for Navigational Electronics, Osmania University, Hyderabad – 500007, India
(Received in final form 23 June, 1997)
Abstract. The Sevilleta National Wildlife Refuge has patchy vegetation in sandy soil. During midday
and at night, the surface sources and sinks for heat and moisture may thus be different. Although
the Sevilleta is broad and level, its metre-scale heterogeneity could therefore violate an assumption
on which Monin-Obukhov similarity theory (MOST) relies. To test the applicability of MOST in
such a setting, we measured the standard deviations of vertical (w ) and longitudinal velocity (u ),
temperature (t ), and humidity (q ), the temperature-humidity covariance (tq ), and the temperature
skewness (St ). Dividing the former five quantities by the appropriate flux scales (u , t , and q )
j j j j j j
yielded the nondimensional statistics w =u , u =u , t = t , q = q , and tq=t q . w =u , t = t ,
and St have magnitudes and variations with stability similar to those reported in the literature and,
thus, seem to obey MOST. Though u =u is often presumed not to obey MOST, our u =u data also
j j
agree with MOST scaling arguments. While q = q has the same dependence on stability as t = t , j j
its magnitude is 28% larger. When we ignore tq=t q values measured during sunrise and sunset
transitions – when MOST is not expected to apply – this statistic has essentially the same magnitude
and stability dependence as t =t 2 . In a flow that truly obeys MOST, t =t 2 , q =q 2 , and
tq=t q should all have the same functional form. That q =q 2 differs from the other two suggests
that the Sevilleta has an interesting surface not compatible with MOST. The sources of humidity
reflect the patchiness while, despite the patchiness, the sources of heat seem uniformly distributed.
Key words: Bowen ratio, Heterogeneous terrain, Monin–Obukhov similarity, Skewness of temper-
ature, Sonic anemometer/thermometer, Statistics of turbulence
1. Introduction
Monin–Obukhov similarity theory (MOST) has been the most important develop-
ment in boundary-layer meteorology in the last 50 years. By unifying the inter-
pretation of diverse observations, it provided the theoretical foundation on which
boundary-layer meteorology has risen as a discipline.
Yet, despite the success of MOST in unifying theory and observations, disturb-
ing uncertainties persist in some of the universal functions that it predicts should
exist. Compare, for example, the recent summaries by Panofsky and Dutton (1984),
Sorbjan (1989), and Kaimal and Finnigan (1994). In light of this persistent uncer-
tainty, it is still important to report high-quality turbulence data that may help
Boundary-Layer Meteorology 86: 379–408, 1998.
c 1998 Kluwer Academic Publishers. Printed in the Netherlands.
2. 380 EDGAR L ANDREAS ET AL.
narrow the error bars on the Monin–Obukhov similarity functions and, indeed,
answer questions about MOST’s applicability.
Although MOST is founded on the assumption of horizontal homogeneity, it
really is the only conceptual framework we have for treating near-surface turbulence
in the atmospheric boundary layer. Consequently, much current research focuses
on extending MOST to heterogeneous surfaces (e.g., Beljaars and Holtslag, 1991;
Roth and Oke, 1993; Roth, 1993; Katul et al., 1995).
Here our objective is also to use MOST to investigate turbulence statistics over
a heterogeneous surface – but one that is heterogeneous only at scales from tens
of centimetres to several metres. At larger scales, our site is homogeneous. We did
our work at the Sevilleta National Wildlife Refuge, a semi-arid grassland between
Albuquerque and Socorro, New Mexico. The Sevilleta’s vegetation is patchy, with
bare ground between clumps of plants. It is easy to imagine that, during daytime,
the bare ground is a heat source in the late summer, and the plants are water vapour
sources. Because of this source heterogeneity, the statistics of temperature and
humidity and, especially, their covariance might not follow the same similarity
relations, as MOST predicts they should (Hill, 1989).
Our results, however, suggest that the surface heat sources are not as heteroge-
neous as the plant cover. The measured nondimensional temperature variance and
temperature skewness values follow Monin–Obukhov similarity functions similar
to those already reported in the literature. The nondimensional humidity variance,
on the other hand, follows a similarity relation that is 60% above the temperature
relation. But then the nondimensional temperature-humidity covariance coinciden-
tally follows practically the same similarity relation as does temperature variance.
This latter result is possible because the temperature-humidity correlation coeffi-
cient – even during stationary periods – typically has an absolute value of 0.8 or
less. We conclude that this behaviour of the temperature-humidity covariance is
evidence of how the Sevilleta’s metre-scale heterogeneity leads to violations of
MOST. In a flow that strictly obeys MOST, the correlation coefficient between any
two conservative scalars must be 1 (Hill, 1989).
2. Theoretical Background
Monin–Obukhov similarity theory predicts the following relationships (e.g., Wyn-
gaard, 1973; Sorbjan, 1989, p. 69 ff.; Hill, 1989):
w = (z=L);
u 33 (2.1)
t = (z=L);
jt j tt (2.2)
q
jqj = qq (z=L); (2.3)
3. STATISTICS OF SURFACE-LAYER TURBULENCE 381
tq = (z=L):
tq tq (2.4)
Here, w , t , and q are the standard deviations in vertical velocity, temperature,
and specific humidity, and tq is the temperature-humidity covariance, where t and
q are, respectively, the turbulent fluctuations in temperature and specific humidity,
and the overbar denotes a time average. u , t , and q are flux scales such that
u2 = uw, ut = wt, and uq = wq are, respectively, the kinematic
surface stress, temperature flux, and specific humidity flux. In addition, z is the
measurement height, and L is the Obukhov length,
L 1 = gkwt3v ;
Tv u (2.5)
where g is the acceleration of gravity, k (= 0.4) is the von K´ rm´ n constant,
a a
Tv = T (1 + 0:61Q) (2.6)
is a representative virtual temperature of the atmospheric surface layer (ASL), and
wtv = wt(1 + 0:61Q) + 0:61Twq (2.7)
is the virtual temperature flux. Also in (2.6) and (2.7), T and Q are representative
surface-layer values of air temperature and specific humidity.
In Equations (2.1)–(2.4), the crux of MOST is the functions; these are nondi-
mensional – presumably universal – functions of the stability parameter z=L.
Although MOST predicts that universal forms for should exist, the actual func-
tions must be found experimentally. MOST does, however, provide insights into
the functional forms of the s for very unstable and very stable stratification.
Because in very unstable or free-convection conditions, u loses its significance
as the appropriate velocity scale, it is common to define a free-convection velocity
scale (e.g., Hess, 1992)
=
!1 3
uf = zgwtv :
Tv (2.8)
This scale, in turn, lets us define new temperature and humidity scales,
=
!1 3
wt = Tv wt3
tf = u ;
f zgwtv (2.9)
=
!1 3
qf = wq = Tv wq
3
uf zgwtv : (2.10)
4. 382 EDGAR L ANDREAS ET AL.
Because u and, thus, t and q lose their significance gradually as the ASL
approaches free convection, we can recast Equations (2.8)–(2.10) for large as
uf = k 1=3 ( )1=3;
u (2.11)
tf = qf = k1=3( ) 1=3 :
t q (2.12)
The three scales uf , tf , and qf , with (2.11) and (2.12), lead immediately to the
well-known predictions for the asymptotic behaviours of 33 , tt , and qq in free
convection (e.g., Wyngaard, 1973; Sorbjan, 1989, p. 71 ff.),
33 ( ) = A3u ( )1=3; (2.13)
tt ( ) = Atu( ) 1=3 ; (2.14)
qq ( ) = Aqu( ) 1=3; (2.15)
where A3u , Atu , and Aqu are constants.
In very stable conditions, the turbulent eddies are small and often never interact
with the surface. Consequently, the height of the observation, z , has no significance.
This is z -less stratification (Wyngaard, 1973; Dias et al., 1995). MOST suggests that
the asymptotic behaviours of the functions in the limit of very stable stratification
(i.e., large ) are
33 ( ) = A3s; (2.16)
tt ( ) = Ats; (2.17)
qq ( ) = Aqs; (2.18)
where A3s , Ats , and Aqs are constants.
We also study the temperature skewness,
t3
St 3 ; (2.19)
t
where t3 is the third moment of temperature. Businger (1973) stated that it is not
possible to use MOST to predict the asymptotic behaviour of St , as has been done
for 33 , tt , and qq . He now, however, agrees that the following MOST arguments
are accurate (J. A. Businger, 1995, personal communication).
We can rewrite St as
t3 tf 3 jtj 3 :
St = t3 t
f t (2.20)
5. STATISTICS OF SURFACE-LAYER TURBULENCE 383
In the asymptotic limit of free convection (i.e., large ),
t3 = Bu;
t3
f
(2.21)
a constant. Thus, substituting (2.12), (2.14), and (2.21) in (2.20) yields
St = Bu[k( ) 1
][Atu3 ( )] = kBu=A3 ;
tu (2.22)
a constant. That is, in the free-convection limit, MOST predicts that St becomes a
constant.
In very stable conditions (i.e., for large ), on the other hand, MOST suggests
t3 = B ;
t3 s (2.23)
yet another constant. But we can also rewrite the skewness as
St = t3 j j :
t3 t 3 (2.24)
t
Thus, with (2.17) and (2.23), (2.24) becomes
St = Bs=A3 ;
ts (2.25)
which is again a constant. That is, in z -less stratification also, St approaches a
constant.
Monin and Yaglom (1971, p. 462) also give these two asymptotic predictions
for temperature skewness, but without proof. The same arguments also hold for
humidity skewness.
3. The Sevilleta
The Sevilleta National Wildlife Refuge is in the rift valley of the Rio Grande
River; our research site was in the area known as McKenzie Flats (34 210 5.1500 N,
106 410 9.4700 W). Although mountains rise 1000 m above the valley floor to the
east and to the far west, McKenzie Flats itself is a large (100 km2 ) grassland
area that is relatively level and fairly homogeneous at kilometre scales. Otto et al.
(1995) give other details of the site, including maps.
On a scale of tens of centimetres to several metres, however, the Sevilleta’s
vegetation is patchy (see Figure 1). Vegetation transect studies are done annually in
this area. These consist of 400-m-line-intercept measurements at 1 cm resolution
that yield percentages covered by bare ground, litter, and various plant species.
6. 384 EDGAR L ANDREAS ET AL.
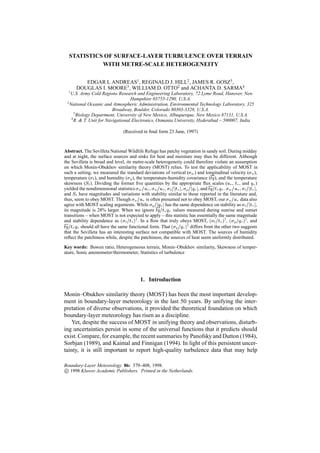
Figure 1. Patchy vegetation characterizes the Sevilleta. The patchiness, however, is visible only in
the foreground here because the vegetation occludes the line-of-sight in the background. In the insert,
the scale is in centimetres.
7. STATISTICS OF SURFACE-LAYER TURBULENCE 385
In the late summer of 1991, vegetation covered 37.7% of the area; bare ground,
33.3%; and litter, 29.0%. The dominant plant species (see Figure 1) were black
grama (Bouteloua eripoda), with 18.0% coverage, and blue grama (Bouteloua
gracilis), with 8.8% coverage. These values also correspond closely to the leaf area
index because of the low stature of these plants.
During our experiment, plant pedestals, typically, were 5 cm above the surface,
leaves reached 30 cm, and seed stalks reached 60 cm. The spacing between clumps
of plants was on the order 20–30 cm. Turner et al. (1991) and Gosz (1993, 1995)
give additional details of the Sevilleta’s vegetation.
We collected the data described here on 4–16 August 1991. August is the rainy
season in New Mexico. The Sevilleta had, at least, light rain on 10 of the 13 days
of our experiment. Some storms yielded heavy rain, with one log entry showing 1
cm of rain in an hour. Dew was common in the morning. As a consequence, the
turbulent sensible and latent heat fluxes were, generally, of comparable magnitude.
4. The Data
4.1. DATA COLLECTION AND PROCESSING
A three-axis ‘Kaimal’ sonic anemometer/thermometer made by Applied Technolo-
gies, Inc. (ATI; Boulder, Colorado) was our primary turbulence instrument. This
was positioned at the top of a thin beam with the center of the w-anemometer path
4 m above the ground. A sampling height of 4 m is sufficient to allay concern over
the loss of high-frequncy response because of the path-averaging in this instrument
(Kaimal and Finnigan, 1994, p. 219). The ATI sonic provides digital values of the
three velocity components and temperature 10 times per second. We logged these
data through the communications port of a personal computer. Each three-axis
sonic run started on the hour and continued for 40.96 minutes. We made 69 such
runs.
After the experiment, we computed the turbulence statistics for each sonic run.
This analysis included routines to remove spikes and detrend the time series. We
also rotated the statistics into a coordinate frame in which the mean transverse and
vertical velocity components and the mean transverse turbulent stresses were all
zero. The statistics thus computed included run averages of uw , wt, u , t , L, w ,
u, t , and t3 , where u is the standard deviation in longitudinal velocity.
Fifty metres southeast of the three-axis sonic tower was our so-called eddy-
correlation tower that held turbulence instruments made by Campbell Scientific,
Inc. (Logan, Utah). Here, again 4 m above the ground, were a vertically oriented
single-axis sonic anemometer, a 76-m chromel-constantan thermocouple, and a
krypton hygrometer. A Campbell data logger sampled these instruments at 10 Hz
and automatically computed averages from the top of the hour to 40 minutes after
the hour; these eddy-correlation statistics, thus, coincided with those from the
8. 386 EDGAR L ANDREAS ET AL.
three-axis sonic. Statistics from these instruments included w , t , q , wt, wq , and
tq. We have 118 runs with these data. Using u from the three-axis sonic, we could
also compute t and q from these data. There are 30 of these coincident runs.
Midway between the sonic and eddy-correlation towers was a Campbell Bowen
ratio station. This measured the Bowen ratio, defined as
Bo = Lpwt = Lptq ;
c
wq
c (4.1)
v v
by measuring temperature and dew point at two heights. That is, the Bowen ratio
station approximated the Bowen ratio as
Bo = L p(Q2 T1 )) :
c (T
v 2 Q1
(4.2)
In (4.1) and (4.2), cp is the specific heat of air at constant pressure, and Lv is the
latent heat of vaporization of water. On this Bowen-ratio tower, matched 76-m-
diameter chromel-constantan thermocouples placed at heights of 0.87 and 2.83 m
measured the vertical temperature gradient. At the same two heights, air intakes
led to a single cooled-mirror dew-point hygrometer. At 2-minute intervals, a pump
and valve alternately sent air from one intake and then the other to the hygrometer.
The dew points at the two heights were thus measured. A second Campbell data
logger, again synchronized to sample for 40 minutes starting on the hour, collected
these temperature and dew-point data, calculated the vertical temperature (T2 T1)
and specific humidity (Q2 Q1 ) differences, and output 40-minute averages of
the Bowen ratio estimated according to (4.2). Although the Bowen ratio station
yielded other data, which we mention briefly later, here we primarily use these
Bowen ratios (in the Appendix).
Schotanus et al. (1983) and Kaimal and Gaynor (1991) explain that the tem-
perature measured by a sonic thermometer is not a true temperature; it contains
humidity information also. If ts is the instantaneous temperature measured by a
e
sonic thermometer,
tes = t(1 + 0:51q);
~ ~ (4.3)
where t and q are the instantaneous temperature and specific humidity in the sonic
~ ~
path. Notice, (4.3) is not very different from the virtual temperature, (2.6). Kaimal
and Gaynor demonstrate that the sonic temperature can, therefore, be used directly
for computing the Obukhov length [see (2.5)] without humidity corrections.
Since we also use the sonic temperature to compute t and t3 , we worry that
these might be biased by humidity. In the Appendix, however, we demonstrate
that, for the range of Bowen ratios we encountered, the statistics of interest here,
t=jt j and t3=t3 , can be computed directly from the sonic temperature without
corrections for humidity.
9. STATISTICS OF SURFACE-LAYER TURBULENCE 387
4.2. QUALITY CONTROL
The three-axis ATI sonic anemometer/thermometer and the fast-responding tem-
perature and humidity sensors on the eddy-correlation tower were fixed in place
to accept southerly winds coming up the Rio Grande Valley. Of course, the winds
were not always head-on to the ATI sonic. But because of the thoughtful design of
this instrument, it can measure the wind vector accurately even in flows that are not
head-on. Kaimal et al. (1990) show that this anemometer has no directional bias
for winds 45 from head-on. We, however, interpret their data as suggesting that
there is no bias for winds to almost 90 from head-on.
We graded our sonic runs on the basis of mean wind direction and the variability
in the direction. We label runs with an average wind direction within 90 of head-
on to the sonic and with small directional variability our ‘best’ data, and those with a
mean wind direction within 90 of head-on but with higher directional variability
‘questionable’ data. We reject runs with winds coming predominantly from the
backside of the sonic or with high directional variability. Figure 2 shows wind-
direction histograms for typical runs that we identified as ‘best’, ‘questionable’,
and ‘rejected’.
Of the 69 original runs, we judged 31 as ‘best’ and 11 as ‘questionable’ and
rejected 27 for use in our analysis. As will be seen later, most of the questionable
runs occurred in lighter winds and were therefore associated with moderately
unstable stratification.
5. Turbulence Statistics
5.1. DISPLACEMENT HEIGHT
Over surfaces with vegetation, it is often necessary to account for the displacement
height d in the scaling. Then in Equations (2.1)–(2.4), for example, the correct
height scale would not be the height above ground z but rather z d (e.g., Lloyd et
al., 1991; Roth, 1993; Roth and Oke, 1993). Typically, d is 60–70% of the height
h of the vegetation if the vegetation is dense (Stanhill, 1969; Monteith, 1980;
Wieringa, 1993). With the patchy vegetation of the Sevilleta, however, we suspect
that d will be a smaller percentage of h (Wieringa, 1993). Since d is interpreted as
the average height within a canopy where the momentum is absorbed (Raupach,
1992; Wieringa, 1993), h at the Sevilleta would be the height below which the
plants are most dense. That is, h should be roughly what we earlier called the leaf
height, 30 cm. Hence, d may have been as large as 20 cm during our experiment
but likely was smaller.
Since d is defined in the context of momentum exchange, we can investigate its
importance to us by considering the wind speed profile
u ln z d
U (z) = k
z d
z0 m L (5.1)
10. 388 EDGAR L ANDREAS ET AL.
Figure 2. Three-axis sonic wind direction histograms for typical runs that we judged to yield the best
data, questionable data, and data that we rejected. 0 is head-on to the sonic.
11. STATISTICS OF SURFACE-LAYER TURBULENCE 389
or, more specifically, the drag coefficient at neutral stability, evaluated for a refer-
ence height of 10 m (e.g., Andreas and Murphy, 1986),
CDN 10 = k2 : (5.2)
[kCDz=2
1
ln[(z d)=10] + m [(z d)=L]]2
In (5.1), z0 is the roughness length, which is monotonically related to CDN 10 by
CDN 10 = [ln[(10 k d)=z ]]2 ;
2
(5.3)
0
where d and z0 must both be in metres. In (5.1) and (5.2), m is a stability
correction. For unstable stratification, we used the Businger-Dyer formulation for
m (Andreas and Murphy, 1986); for stable stratification, we used
m [(z d)=L] = 5[(z d)=L]: (5.4)
Also in (5.2),
CDz = [u =U (z)]2 : (5.5)
All the quantities in (5.2) necessary to compute CDN 10 – namely, U (z ), u ,
and L – come directly from the three-axis sonic anemometer/thermometer. We
thus computed CDN 10 for two possible displacement heights: the maximum likely
value, 20 cm, and the minimum, 0 cm. Figure 3 shows CDN 10 plotted as a function
of stability with d = 0 cm and only for three-axis sonic runs for which j j 0:2.
Confining our analysis to this stability range minimizes the importance of the
stability correction necessary in (5.2).
In Figure 3, the mean value of CDN 10 is 5.36 10 3 , and the standard deviation
of the mean is 0.08 10 3. From (5.3), the corresponding value of the roughness
length, z0 , is 4.2 cm. We also computed CDN 10 values using d = 20 cm for the same
runs depicted in Figure 3. The mean of these CDN 10 values is 5.30 10 3 , and the
standard deviation of this mean is again 0.08 10 3 . Consequently, on the basis
of a Student’s t-test, we can reject the hypothesis that the means of the two CDN 10
distributions (one with d = 0 cm, and one with d = 20 cm) are the same only at the
37% significance level. In other words, the means are not statistically different, and
we can henceforth exclude any concern for the displacement height in our analysis.
Evidently, the displacement height is less than 20 cm, as we supposed.
5.2. VARIANCE AND COVARIANCE STATISTICS
Figure 4 shows w =u plotted versus . The stability range that these data cover is
fairly wide, 4 1. The solid line in the figure is:
12. 390 EDGAR L ANDREAS ET AL.
j j
Figure 3. Neutral-stability, 10-m drag coefficients for three-axis sonic runs for which z=L 0:2.
Here the displacement height d is taken as 0 cm.
Figure 4. Nondimensional standard deviation in vertical velocity as a function of stability. The
vertical velocity data came from the three-axis ATI sonic anemometer/thermometer and from the
single-axis Campbell sonic anemometer. For both data sets, u and L came from the ATI sonic. The
line represents Equation (5.6).
13. STATISTICS OF SURFACE-LAYER TURBULENCE 391
for 4 0:1,
w =u = 1:20(0:70 3:0 )1=3; (5.6a)
for 0:1 0,
w =u = 1:20; (5.6b)
for 0 1,
u=u = 1:20(1 + 0:2 ): (5.6c)
The formulation on the unstable side [(5.6a) and (5.6b)] is our own since w =u
seems to be constant for near-neutral stability. Andreas and Paulson (1979) and
H¨ gstr¨ m (1990) also report that w =u is independent of for 0:1 0.
o o
Kader and Yaglom (1990) justify the existence of this constant region theoretically
and call it the dynamic sublayer.
In the free-convection limit, (5.6a) becomes w =u = 1:73( )1=3 , as (2.13)
predicts. The multiplicative constant here is within the range of previously reported
values (e.g., Panofsky and Dutton, 1984, p. 161; Sorbjan, 1989, p. 75; Hedde and
Durand, 1994).
On the stable side of Figure 4, (5.6c) has Kaimal and Finnigan’s (1994, p. 16)
stability dependence with a slightly smaller multiplicative constant: 1.20 instead of
1.25. Our value of w =u at neutral stability, 1.20, is within the range of previously
reported values (e.g., Panofsky and Dutton, 1984, p. 160 ff.; Hedde and Durand,
1994). Andreas and Paulson (1979) and H¨ gstr¨ m (1990), however, suggest that
o o
the value of w =u at neutral stability may vary; it depends on the measurement
height and probably other variables. H¨ gstr¨ m proposes that the relation
o o
w =u j0 = 0:12 ln(zf=u ) + 1:99 (5.7)
predicts w =u at neutral stability, where f is the absolute magnitude of the Coriolis
parameter. For the Sevilleta data (with f based on 34 north latitude, and u
0:4 m s 1 for our near-neutral runs), (5.7) predicts w =u 1:14 at neutral
stability, in fair agreement with our fitted result, 1.20.
Compared to reports of w =u , the literature contains relatively few plots of
u=u . This may be because u=u is commonly presumed not to obey MOST (e.g.,
Panofsky, 1973; Panofsky and Dutton, 1984, p. 165; Sorbjan, 1989, p. 77) because
large-scale motions, which do not scale with z , influence u . Nevertheless, Bradley
and Antonia (1979), Kader and Yaglom (1990), and Hedde and Durand (1994),
among others, treat u =u as a MOST statistic. In fact, Kader and Yaglom disparage
the u results of Panofsky et al. (1977) – which are the primary evidence for the
u dependence on the inversion height, zi, in unstable stratification – stating that
their ‘conclusions : : : do not seem to be very reliable’ because their measurements
14. 392 EDGAR L ANDREAS ET AL.
Figure 5. Nondimensional standard deviation in longitudinal velocity as a function of stability. All
these data came from the three-axis ATI sonic anemometer/thermometer. The line represents Equation
(5.8).
were ‘at relatively large heights’. Kader and Yaglom, thus, conclude that ‘there
have been no reliable measurements of’ u for z=L 0:1 in the atmospheric
surface layer.
In light of this perceived deficiency, we present Figure 5 with our u =u data
plotted versus z=L. These are true atmospheric surface-layer statistics because, our
measurement height was 4 m. The line in the figure is:
for 4 0:1,
u=u = 5:49( )1=3; (5.8a)
for 0:1
0,
u=u = 2:55; (5.8b)
for 0 1,
u=u = 2:55(1 + 0:8 ): (5.8c)
MOST does seem useful in organizing our u data. On the unstable side of
Figure 5, u =u is constant for 0:1 0, as is w =u in Figure 4. This
stability region corresponds to what Kader and Yaglom (1990) call the dynamic
sublayer, where MOST predicts that both w =u and u =u should be constant. As
increases, u=u becomes proportional to ( )1=3, as MOST predicts following
15. STATISTICS OF SURFACE-LAYER TURBULENCE 393
Figure 6. Nondimensional standard deviations in temperature as a function of stability. The data
derive from the three-axis ATI sonic anemometer/thermometer or from the Campbell eddy-correlation
instruments, as noted. For all data, u (necessary for computing t ) and L came from the ATI sonic.
The line represents Equation (5.9) with C = 3.2.
the same arguments that led to (2.13). In near-neutral stability, u =u = 2:55, a
value that agrees very well with most other observations of this quantity in neutral
stratification (e.g., Ariel and Nadezhina, 1976; Stull, 1988, p. 366; Sorbjan, 1989,
p. 69 ff.; Kader and Yaglom, 1990). In conclusion, for z=zi 1, MOST seems to
be a useful context for organizing u data.
Figures 6 and 7 show, respectively, the nondimensional standard deviations for
temperature and humidity. We fitted the data in both of these figures with lines of
the same form:
for 4 0,
s=js j = C (1 28:4 ) 1=3; (5.9a)
for 0 1,
s=js j = C ; (5.9b)
where s is the scalar standard deviation and s is the corresponding flux scale.
For temperature (Figure 6), C = 3.2; for humidity (Figure 7), C = 4.1.
The temperature data from the eddy-correlation tower plotted in Figure 6 (the
squares) are more scattered than the data from the three-axis sonic (the circles)
and, on the unstable side, even appear to be biased somewhat high. On the stable
side of Figure 6, there is no obvious bias. This scatter is not unexpected because
of the way we had to compute t =jt j. For the three-axis sonic points in Figure 6,
16. 394 EDGAR L ANDREAS ET AL.
Figure 7. Nondimensional standard deviations in specific humidity as a function of stability. All
these data came from the Campbell eddy-correlation instruments, but u (necessary for computing
q ) and L came from the ATI sonic. The line represents Equation (5.9) with C = 4.1.
u, t , and wt (which yielded t = wt=u ) all came from the same instrument.
Thus random scatter in t was likely mitigated by coincident scatter in wt. For
the eddy-correlation points in Figure 6, however, only t and wt came from the
eddy-correlation instruments; u (which yielded t = wt=u ) and z=L still came
from the three-axis sonic. Thus, the fact that another instrument, 50 m away,
was necessary for deriving the eddy-correlation t =jt j values makes the scatter
reasonable.
With the exception of the ( ) 1=3 behaviour in the free-convection limit, there
is little consensus as to the form of (5.9a). Our function has the stability dependence
recommended by De Bruin et al. (1993).
There is even less guidance as to the behaviour of tt ( ) and qq ( ) on the
stable side of Figures 6 and 7 (e.g., Panofsky and Dutton, 1984, p. 169 ff.; Sorbjan,
1989, p. 75). Our data, though, definitely do not follow Kaimal and Finnigan’s
(1994, p. 16) suggestion that tt decreases with increasing . On the basis of (2.17)
and (2.18), we interpret Figures 6 and 7 as suggesting that tt ( ) and qq ( ) are
independent of throughout the stable region [see (5.9b)]. Weaver (1990) reaches
the same conclusion.
In the atmospheric surface layer above horizontally homogeneous surfaces, tem-
perature and humidity statistics are often presumed to differ little (e.g., Brutsaert,
1982, p. 67 ff; Panofsky and Dutton, 1984, p. 170 ff.). Ohtaki (1985) and Hedde and
Durand (1994) confirm that over homogeneous surfaces, such as dense vegetation
or the ocean, this is true. Likewise, on reviewing many data sets collected over fairly
17. STATISTICS OF SURFACE-LAYER TURBULENCE 395
homogeneous surfaces, Ariel and Nadezhina (1976) conclude that temperature and
humidity statistics ‘have similar characteristics’. But for more complex surfaces,
Smedman-H¨ gstr¨ m (1973) and Beljaars et al. (1983) find that nondimensional
o o
temperature and humidity standard deviations have different values at the same
stability, as we have found.
Katul et al. (1995) suggest that, even over homogeneous surfaces, temperature
and humidity statistics could differ because temperature is an active scalar conta-
minant while moisture is generally not. Such an argument logically implies then
that t =jt j and q =jq j would be relatively alike in near-neutral stability but would
diverge as j j increases and temperature assumes a more active role in the dynam-
ics. That is, the shapes of plots of t =jt j and q =jq j versus would be different.
In Figures 6 and 7, however, our t =jt j and q =jq j data exhibit the same shape –
the same stability dependence – for 4 1.
This hypothesis that temperature is an active scalar also implies that the propor-
tionality of t =jt j to ( ) 1=3 should break down with increasing atmospheric
instability, since this prediction relies strictly on MOST and, thus, takes no account
of temperature’s active role in flow dynamics. But, as we mentioned, the propor-
tionality of t =jt j to ( ) 1=3 is the most robust feature of this statistic. Therefore,
if temperature does behave as an active scalar, evidence of this does not have any
obvious manifestation in its variance statistics. As a result, temperature’s presumed
active role in the dynamics does not seem to explain the difference in the t =jt j
and q =jq j levels in Figures 6 and 7.
De Bruin et al. (1993) recommend that C = 2.9 for tt in (5.9a). This is not
much different from our value of 3.2. Notice, with this constant, that (5.9) implies
that t =jt j approaches 3.2 at neutral stability (see Figure 6). Most investigations,
however, find values of t =jt j between 2 and 3 at neutral stability (e.g., Tillman,
1972; Ohtaki, 1985; H¨ gstr¨ m, 1990; Kader and Yaglom, 1990; Kaimal and Finni-
o o
gan, 1994, p. 16), but few had as many data for 0:1 0:1 as we have.
Beljaars et al. (1983) and Wang and Mitsuta (1991) do report that t =jt j is 3.5 and
3.0, respectively, at neutral stability.
There are not as many observations of q =jq j in the literature. With C = 4.1
in (5.9), we suggest that q =jq j = 4:1 at neutral stability. Ohtaki (1985), on the
other hand, suggests that t =jt j = q =jq j = 2:5 at neutral stability. Beljaars et
al. (1983) likewise suggest that q =jq j = 2:5 at neutral stability; but unlike our
and Ohtaki’s results, this value is much less than their value for t =jt j at neutral
stability, 3.5. Hedde and Durand (1994) report that t =jt j = q =jq j in the free-
convection region but do not have enough data near neutral stability to infer values
here. Thus, the humidity data lead to no consensus.
The fact that both nondimensional temperature and humidity standard deviations
have the same dependence on stability in (5.9) and that this dependence has been
reported elsewhere (i.e., De Bruin et al., 1993) supports MOST. The fact that, at the
Sevilleta, the magnitudes of these two statistics are different is contrary to MOST.
Another test of MOST over the Sevilleta, where we expect that during daytime the
18. 396 EDGAR L ANDREAS ET AL.
Figure 8. Nondimensional temperature-humidity covariance as a function of stability. All the tq data
came from the Campbell eddy-correlation instruments. The u (necessary for computing t and q )
and L values came from the ATI sonic. The line represents Equation (5.10).
sources of heat and moisture are different, is to look at the temperature-humidity
covariance.
Figure 8 shows tq=t q as a function of stability. For each data point in Figure 8,
we needed measurements of wt, wq , and tq from the eddy-correlation tower and
simultaneous measurements of u and L from the three-axis sonic. As we mentioned
earlier, there are 30 of these coincident runs.
The line in Figure 8 is:
for 4 0,
tq=tq = 10(1 28:4 ) 2=3 ; (5.10a)
for 0 1,
tq=tq = 10: (5.10b)
Using (2.3), (2.4), and (5.9), we can also write this as
tq tq t q
tq = t q jtj jqj = 0:76tt ( )qq ( ); (5.11a)
2 ( ):
tt (5.11b)
This implies that the t q correlation coefficient, tq=t q , has a typical magnitude
of 0.76.
19. STATISTICS OF SURFACE-LAYER TURBULENCE 397
By writing (5.11b) we do not mean to suggest any fundamental relation-
ship. This near-equality is probably just coincidence since tt ( ) 6= qq ( ) and
tq=tq 6= 2 ( ).
qq
Equation (5.11a) is a generalization of MOST as applied to tq=t q above hetero-
geneous surfaces. If a flow truly obeys MOST, then tt = qq and jtq=t q j = 1
(e.g., Hill, 1989). Consequently, instead of (5.11a), we would have tq=t q =
tt ( )qq ( ). But Hill (1989) emphasizes that scalar-scalar correlations, such as
tq, are sensitive indicators of deviations from MOST. Consequently, Figure 8 and
our fitting its data with (5.11a) confirms that some feature of the Sevilleta violates
the conditions on which MOST relies.
Among the 30 points available for plotting in Figure 8 are some that fell far
from (5.10). On scrutinizing these points, we found that all came from the sunrise
and sunset transitions – periods when the steady-state assumption on which MOST
relies is invalid.
Therefore, to further investigate MOST as it applies to tq , we constructed
Figure 9. Here we plot the t q correlation as a function of local time. Remember
that each run started on the hour and lasted 40 minutes. Thus, the times plotted in
Figure 9 are the starting times for the runs. These data show a clear diurnal cycle.
The t q correlation is high and positive from mid-morning until late afternoon;
during the night the correlation is negative. Consequently, there are two transitions
during which tq crosses zero – one around sunrise and the other around sunset.
The wild outliers in Figure 8 came from these transition periods; the well-behaved
points in Figure 8 came from daytime measurements for negative and from
nighttime measurements for positive. Typical magnitudes of the t q correlation
for these well-behaved points are as we suggest in (5.11a), 0.76.
The fact that jtq=t q j is never 1 in Figure 9 confirms that the Sevilleta data vio-
late MOST. Priestley and Hill (1985) speculate that jtq=t q j may not be perfectly
1 as a consequence of entrainment from heights where the gradients of potential
temperature and specific humidity differ from their near-surface averages. De Bruin
et al. (1993) offer a similar explanation for imperfect t q correlation but with
an added constraint. For their data, the surface sensible heat flux was large; conse-
quently, large boundary-layer eddies – for example, through “top-down” diffusion
(Wyngaard and Brost, 1984) – had a small effect on near-surface temperature fluc-
tuations. On the other hand, their surface latent heat flux was small, so the large
eddies affected the humidity fluctuations much more than the temperature fluctu-
ations. For such conditions, t and q would be poorly correlated, and q would be
only weakly related to q . Figure 7, however, shows that, for our Sevilleta data, q
and q are closely related.
Figure 10 provides further insight into the hypothesis by De Bruin et al. (1993).
Here we plot tq=t q versus the Bowen ratio, Bo, where Bo came from (4.1) with
wt and wq values measured on the eddy-correlation tower. In making this plot, we
excluded t q and Bowen ratio pairs collected during nonstationary periods as
indicated by high variability in simultaneous scintillometer data (Otto et al., 1995).
20. 398 EDGAR L ANDREAS ET AL.
Figure 9. The t q correlation as a function of local time. All of these data came from the Campbell
eddy-correlation instruments. The 2s indicate that there are two data points with the same coordinates.
The stability values (i.e., z=L) in Figure 10 came from wind speed and heat flux
data available from the Campbell Bowen ratio station (Otto et al., 1996; Hill et al.,
1997).
The point Figure 10 makes is that, generally, neither the sensible nor the latent
heat flux was negligible in comparison to the other at the Sevilleta: The magnitude
of Bo is typically 1, and, during the day at least, both sensible and latent heat
fluxes were usually 100–200 W m 2 . Thus, the points in the upper right quadrant
in Figure 10 are daytime values, when both sensible and latent heat fluxes were
positive. The points in the lower left quadrant are nighttime values, when the latent
heat flux was still usually positive, but the sensible heat flux was negative.
Our conclusion on seeing Figure 10 is that the explanation for jtq=t q j values
less than 1 suggested by De Bruin et al. (1993) is not applicable for the Sevilleta,
at least during daytime. The latent heat flux was not so small that large boundary-
layer eddies could have dominated the variability in surface-level q values. We
thus reiterate our hypothesis that the metre-scale surface heterogeneity leads to
distributed heat and moisture sources that cannot produce temperature and humidity
fluctuations with perfect correlation or anticorrelation.
In summary, turbulence in the surface layer over the Sevilleta violates MOST,
but not violently. The behaviour of tt ( ) is consistent with other reports in the
literature. That the stability dependence in qq ( ) and tq ( ) is like that for tt ( )
is another result consistent with MOST. But the fact that qq does not have the
same value as tt for all values is a breakdown in MOST. Because qq is sig-
nificantly larger than tt though the magnitude of the Bowen ratio is typically 1,
21. STATISTICS OF SURFACE-LAYER TURBULENCE 399
Figure 10. The t q correlation versus the Bowen ratio. The data points came from the Campbell
eddy-correlation instruments; we used data from the Campbell Bowen ratio station to assign z=L
values (Otto et al., 1996; Hill et al., 1997). The data have also been screened to exclude nonstationary
periods as judged by high variability in simultaneous scintillometer measurements (Otto et al., 1995).
this breakdown seems to result because the surface moisture sources are hetero-
geneously distributed while the temperature sources are more homogeneous. The
evidence in (5.11a) and Figures 9 and 10 that temperature and humidity do not
have perfect positive or negative correlation also argues against MOST and corrob-
orates our conclusion that its breakdown results because the surface temperature
and moisture sources are not similarly distributed.
5.3. TEMPERATURE SKEWNESS
Businger (1973) suggests that one possible use of the temperature skewness is for
estimating u and wt. Figure 11 shows our temperature skewness data as a function
of stability. Because the data came from only the ATI sonic, there are fewer points
than in some of the other plots; but the stability range covered is still 4 1.
The solid line in Figure 11 is our least-squares fit to the data:
22. 400 EDGAR L ANDREAS ET AL.
Figure 11. Temperature skewness versus stability. All these data came from the ATI sonic thermome-
ter. The solid line represents Equation (5.12); the dashed line is from Tillman (1972); the dotted line
shows the asymptotic free-convection limit, relation (5.13).
for 4 0:01,
St = 0:255 ln( ) + 1:044; (5.12a)
for 0.01 1,
St = 0:15: (5.12b)
The only similar relations between skewness data and stability that we know of
are those by Tillman (1972; or see Businger, 1973) and Antonia et al. (1981). Ohtaki
(1985) also shows plots of temperature, humidity, and carbon dioxide skewness;
but his absolute values are smaller than ours and those in the Tillman and Antonia
sets and too scattered to fit with stability relations. Wyngaard and Sundararajan
(1979) also plot temperature skewness data but do not fit a line. The dashed line
in Figure 11, Tillman’s result, is essentially identical to our (5.12a). Antonia et
al. likewise compare Tillman’s fit with two data sets they had and find negligible
differences.
Sreenivasan et al. (1978) suggest that measuring temperature skewness requires
very long averaging times. Their suggested relation between the averaging time
for skewness, Tsk , and the mean-square error in the measured skewness, 2 , is
Tsk U=z = 180=2, where U is the mean wind speed at height z. Since our averaging
time was 40.96 minutes and since U=z was typically 1 s 1 for our data, this
relation implies that our skewness data should typically have a root-mean-square
23. STATISTICS OF SURFACE-LAYER TURBULENCE 401
error of about 27%. The scatter in the data in Figure 11 is roughly in line with
this assessment; and these data are more scattered than those in Figures 4–7, the
variance statistics, which require much shorter averaging times to yield comparable
accuracy (Sreenivasan et al., 1978).
Nevertheless, the similarity between our skewness data and the fits reported
by Tillman (1972) and Antonia et al. (1981) suggests that we have enough data
to capture the general trend in skewness with stability and also corroborates our
conclusion in the Appendix that, for the Sevilleta data, the sonic-temperature
skewness is essentially equal to the true-temperature skewness. Lastly, the similarity
of these three data sets confirms our conclusion in the last section that, over the
Sevilleta, temperature statistics obey MOST.
Earlier we showed that, in very unstable and very stable stratification, the
temperature skewness should approach constants. In Figure 11, St appears to
be constant throughout the stable region [see (5.11b)]. On the unstable side of
Figure 11, St likewise seems to be constant for large . The dotted line in the
figure is
St = 0:82 (5.13)
for 0:2. Tillman’s (1972) data do not show this asymptotic limit in free
convection, but he has only six data points for 0:2 and only one point
with 0:7. Surprisingly, Antonia et al. (1981) do not find this asymptotic
limit in their temperature skewness data either, although they have roughly 40
data points for which 0:2. On the other hand, the 13 temperature skewness
values for which 0:8 that Wyngaard and Sundararajan (1979) plot tend to a
constant value of approximately 1, in good agreement with (5.13). Ohtaki’s (1985)
temperature, humidity, and carbon dioxide skewness data also all seem to be nearly
constant for 0:2; but the absolute values of his constants are about half as
large as ours, 0.82, and the value implied by Wyngaard and Sundararajan’s data.
Clearly, there is still work to do on the similarity behaviour of scalar skewness.
6. Conclusions
The Sevilleta’s metre-scale heterogeneity provides an interesting surface over
which to evaluate turbulence statistics. Despite the heterogeneity, some turbulence
statistics appear to obey Monin-Obukhov similarity theory, while others deviate
mildly. For example, w =u , t =jt j, and t3 =t , in general, depend on stability for
3
4 1 in ways that have been reported before and, thus, follow MOST. If
anything, w =u is the most deviant of this group. We find that w =u is constant
for 0:1 0, as Kader and Yaglom (1990) recommend, while most others
suggest that, for unstable stratification, w =u increases monotonically with .
Statistics involving humidity, on the other hand, do not truly follow MOST;
q =jq j has the same stability dependence as t =jt j but is 28% larger. Likewise,
24. 402 EDGAR L ANDREAS ET AL.
tq=jt qj has the same stability dependence as t2=t2 but is 24% smaller than
tq =t q. We believe these inequalities result because, at the Sevilleta, the surface
sources of heat and moisture are not the same. The surface heat sources seem to
be homogeneously distributed – at least, in part, because of the uniformity of the
radiative forcing (Katul et al., 1995) – and, thus, lead to temperature statistics similar
to those found over more ideal surfaces. The surface moisture sources, in contrast,
seem to be heterogeneously distributed, as is the vegetation. Thus, the turbulent
humidity fluctuations (parameterized as q ) are relatively large when compared to
the total moisture flux. In other words, the heterogeneity fosters unusually large
q =jq j values.
Yet another way of saying this is, because of the heterogeneity, the t q
correlation is not exactly +1 or 1. During midday and late night, when temperature
and humidity have high positive or negative correlation over homogeneous surfaces,
we find the magnitude of the t q correlation over the Sevilleta to be, typically,
0.76. As a consequence, the Sevilleta does not support MOST when the statistic of
interest involves humidity. A corollary is that other photosynthetic gases, such as
carbon dioxide, will not obey MOST over such a surface either.
Acknowledgements
We thank Greg Shore and Yorgos Marinakis (both at the University of New Mexico)
and Jim Wilson (from the Environmental Technology Laboratory) for help with
the data collection. Rod Frehlich, Markus Furger, Ken Gage, and two anonymous
reviewers offered helpful comments on the manuscript. The U.S. Department of
the Army supported this work through Project 4A161102AT24; the U.S. National
Science Foundation supported it with grant BSR-89-18216. This is contribution
110 to the Sevilleta Long-Term Ecological Research Program.
Appendix: Temperature Statistics from a Sonic Thermometer
The instantaneous temperature measured by a sonic thermometer (ts ) is related to
e
the actual instantaneous temperature (t) and specific humidity (q ) by (Schotanus et
~ ~
al., 1983; Kaimal and Gaynor, 1991)
tes = t(1 + 0:51q):
~ ~ (A1)
By using the Reynolds decompositions,
tes = Ts + ts; (A2a)
t = T + t;
~ (A2b)
q = Q + q;
~ (A2c)
25. STATISTICS OF SURFACE-LAYER TURBULENCE 403
where upper-case letters denote averages and unhatted lower-case letters denote
turbulent fluctuations, we can derive (to first order)
Ts = T (1 + 0:51Q); (A3)
ts = t(1 + 0:51Q) + 0:51Tq: (A4)
The turbulent vertical sonic-temperature flux is then
wts u ts = wt(1 + 0:51Q) + 0:51Twq; (A5)
where w is the turbulent vertical velocity fluctuation. From (4.1), we realize that
we can write this in terms of the Bowen ratio,
:51Q) + 0:51T ;
uts = wt (1 + 0
DBo (A6)
where D Lv =cp is roughly 2500 K. In turn, we can also define the sonic-
temperature flux scale,
:51Q) + 0:51T :
ts = t (1 + 0
DBo (A7)
From (A4), the sonic-temperature variance is
ts = t2(1 + 0:51Q)2 + 2(0:51T )(1 + 0:51Q)tq + (0:51T )2q :
2 2
(A8)
Thus, from (A7) and (A8), the nondimensional temperature variance statistic that
we compute from the sonic thermometer is
#
tq
1 + 2 2 + 2
q 2
ts 2 = t 2 t t #
ts t ; (A9)
2 2
1+
DBo + DBo
where
= 1 +:5151Q :
0 T
0:
(A10)
The experimental findings that we report in Section 5 are that (t =t )2 =
1:6(q =q )2 and that tq=t q (t =t )2 . Hence, in the numerator of (A9)
tq = tq t 2 q = 1 ;
t2 tq t t DBo (A11)
26. 404 EDGAR L ANDREAS ET AL.
q 2
=
q 2
t 2
q 2 = 1:6 :
t q t t (DBo)2
(A12)
Thus, (A9) becomes
2
2 3
0:6
ts = t 61 +
2 2 6
DBo 7 : 7
ts t 4 6
1+
27 5
(A13)
DBo
During our experiment at the Sevilleta, 150 K, D 2500 K, and the Bowen
ratio rarely was measured to have an absolute value less than 0.3. Therefore,
34. (A14)
Consequently, the bracketed term in (A13) is nearly 1, and the equation reduces to
ts 2 = t 2 :
ts t (A15)
The unadjusted, nondimensional sonic-temperature variance is, to second order,
equal to the true nondimensional temperature variance.
We likewise consider the skewness measured by the sonic thermometer. The
third moment of sonic temperature is, from (A4),
!
3t2 q 32 tq 2 3 q3 :
t s t
3 = 3 (1 + 0:51Q) 3
1+ + + (A16)
t3 t3 t3
From (A8), (A11), and (A12), we see that
2 1=2
2 3
0:6
6
ts = t(1 + 0:51Q) 1 + DBo 61 + DBo 2 7 ;
6 7
(A17)
4 7 5
1+
DBo
where we have already argued that the term to the 1/2 power is virtually 1. Thus,
the sonic-temperature skewness, Sts = t3 =ts , is related to the true temperature
s
3
skewness, St = t3 =t , by
3
!
3t2 q 32 tq 2 3 q3
St 1+ + +
Sts = t3 t3 t3 : (A18)
3
1+
DBo
35. STATISTICS OF SURFACE-LAYER TURBULENCE 405
Let us define some additional Monin-Obukhov similarity functions:
t3
ttt ( ) t3 ; (A19)
ttq ( ) tt2 qq ;
2
(A20)
tqq ( ) ttqq2 ;
2
(A21)
qqq ( ) q3 :
3
q
(A22)
With these, the terms in the numerator of (A18) become
t2q = t2 q t3 q = ttq 1 ;
t 3 t2 q t3 t ttt DBo
(A23)
tq2 = tq2 t3 q 2 = tqq 1 ;
t 3 tq t3 t
2 ttt (DBo)2 (A24)
q3 = q3 t3 q 3 = qqq 1 :
t 3 q t3 t
3 ttt (DBo)3 (A25)
Substituting (A23)–(A25) in (A18) and doing a binomial expansion of the
denominator yields
#
ttq + 3 2 tqq + 3 qqq
3
Sts = St 1 + DBo DBo ttt DBo ttt
ttt
#
3
2
1 DBo + 6 DBo : (A26)
Using the binomial expansion is valid because, at the Sevilleta, j=DBoj 0:2.
For the Sevilleta measurements, we expect, jttq j jttt j, jtqq j jttt j, and
jttt j jqqq j. Hence, we can safely ignore third-order terms in (A26).
On multiplying the right-hand side of (A26) out, we finally get
#
Sts = St 1 + DBo ttq 3 2 9 ttq + 3 tqq + 6 :
ttt 1 +
DBo ttt ttt
(A27)
36. 406 EDGAR L ANDREAS ET AL.
In unstable conditions, we expect ttt , ttq , tqq , and qqq to all be negative. In
stable conditions, they should all be positive. Thus, the ratios of similarity functions
in (A27) should always be positive. Consequently, in a surface layer that truly obeys
MOST (i.e., the temperature and humidity fluctuations are highly correlated), the
bracketed term in (A27) is nearly 1. Over the Sevilleta, where the t q correlation
was not perfect, the ratios of third-order similarity functions in (A27) will likely
be less than 1. But from our observations of tt , qq , and tq , we expect that
these ratios of third-order functions will not be far from 1. Thus, (A27) suggests
that, to second order, the sonic-temperature skewness equals the true temperature
skewness.
References
Andreas, E. L. and Murphy, B.: 1986, ‘Bulk Transfer Coefficients for Heat and Momentum over
Leads and Polynyas’, J. Phys. Oceanogr. 16, 1875–1883.
Andreas, E. L. and Paulson, C. A.: 1979, ‘Velocity Spectra and Cospectra and Integral Statistics over
Arctic Leads’, Quart. J. Roy. Meteorol. Soc. 105, 1053–1070.
Antonia, R. A., Chambers, A. J., and Bradley, E. F.: 1981, ‘Temperature Structure in the Atmospheric
Surface Layer: II. The Budget of Mean Cube Fluctuations’, Boundary-Layer Meteorol. 20, 293–
307.
Ariel, N. Z. and Nadezhina, Ye. D.: 1976, ‘Dimensionless Turbulence Characteristics under Various
Stratification Conditions’, Izv., Atmos. Oceanic Phys. 12, 492–497.
Beljaars, A. C. M. and Holtslag, A. A. M.: 1991, ‘Flux Parameterization over Land Surfaces for
Atmospheric Models’, J. Appl. Meteorol. 30, 327–341.
Beljaars, A. C. M., Schotanus, P., and Nieuwstadt, F. T. M.: 1983, ‘Surface Layer Similarity under
Nonuniform Fetch Conditions’, J. Clim. Appl. Meteorol. 22, 1800–1810.
Bradley, E. F. and Antonia, R. A.: 1979, ‘Structure Parameters in the Atmospheric Surface Layer’,
Quart. J. Roy. Meteorol. Soc. 105, 695–705.
Brutsaert, W. A.: 1982, Evaporation into the Atmosphere: Theory, History, and Applications, D.
Reidel, Dordrecht, 299 pp.
Businger, J. A.: 1973, ‘Turbulent Transfer in the Atmospheric Surface Layer’, in D. A. Haugen (ed.),
Workshop on Micrometeorology, American Meteorological Society, Boston, pp. 67–100.
De Bruin, H. A. R., Kohsiek, W., and Van Den Hurk, B. J. J. M.: 1993, ‘A Verification of Some
Methods to Determine the Fluxes of Momentum, Sensible Heat, and Water Vapour Using Stan-
dard Deviation and Structure Parameter of Scalar Meteorological Quantities’, Boundary-Layer
Meteorol. 63, 231–257.
Dias, N. L., Brutsaert, W., and Wesely, M. L.: 1995, ‘Z -less Stratification under Stable Conditions’,
Boundary-Layer Meteorol. 75, 175–187.
Gosz, J. R.: 1993, ‘Ecotone Hierarchies’, Ecol. Appl. 3, 369–376.
Gosz, J. R.: 1995, ‘Edges and Natural Resource Management: Future Directions’, Ecol. Int. 22,
17–34.
Hedde, T. and Durand, P.: 1994, ‘Turbulence Intensities and Bulk Coefficients in the Surface Layer
above the Sea’, Boundary-Layer Meteorol. 71, 415–432.
Hess, G. D.: 1992, ‘Observations and Scaling of the Atmospheric Boundary Layer’, Aust. Meteorol.
Mag. 41, 79–99.
Hill, R. J.: 1989, ‘Implications of Monin-Obukhov Similarity Theory for Scalar Quantities’, J. Atmos.
Sci. 46, 2236–2244.
Hill, R. J., Otto, W. D., Sarma, A. D., Wilson, J. J., Andreas, E. L., Gosz, J. R., and Moore, D. I.:
1997, ‘An Evaluation of the Scintillation Method for Obtaining Fluxes of Momentum and Heat’,
NOAA Tech. Memo. ERL ETL-275, Environmental Technology Laboratory, Boulder, Colo., 55
pp.
37. STATISTICS OF SURFACE-LAYER TURBULENCE 407
H¨ gstr¨ m, U.: 1990, ‘Analysis of Turbulence Structure in the Surface Layer with a Modified Similarity
o o
Formulation for Near Neutral Conditions’, J. Atmos. Sci. 47, 1949–1972.
Kader, B. A. and Yaglom, A. M.: 1990, ‘Mean Fields and Fluctuation Moments in Unstably Stratified
Turbulent Boundary Layers’, J. Fluid Mech. 212, 637–662.
Kaimal, J. C. and Finnigan, J. J.: 1994, Atmospheric Boundary Layer Flows: Their Structure and
Measurement, Oxford University Press, New York, 289 pp.
Kaimal, J. C. and Gaynor, J. E.: 1991, ‘Another Look at Sonic Thermometry’, Boundary-Layer
Meteorol. 56, 401–410.
Kaimal, J. C., Gaynor, J. E., Zimmerman, H. A., and Zimmerman, G. A.: 1990, ‘Minimizing Flow
Distortion Errors in a Sonic Anemometer’, Boundary-Layer Meteorol. 53, 103–115.
Katul, G., Goltz, S. M., Hsieh, C.-I., Cheng, Y., Mowry, F., and Sigmon, J.: 1995, ‘Estimation
of Surface Heat and Momentum Fluxes Using the Flux-Variance Method above Uniform and
Non-uniform Terrain’, Boundary-Layer Meteorol. 74, 237–260.
Lloyd, C. R., Culf, A. D. , Dolman, A. J., and Gash, J. H. C.: 1991, ‘Estimates of Sensible Heat Flux
from Observations of Temperature Fluctuations’, Boundary-Layer Meteorol. 57, 311–322.
Monin, A. S. and Yaglom, A. M.: 1971, Statistical Fluid Mechanics: Mechanics of Turbulence, Vol.
1, MIT Press, Cambridge, Mass., 769 pp.
Monteith, J. L.: 1980, Principles of Environmental Physics, Edward Arnold, London, 241 pp.
Ohtaki, E.: 1985, ‘On the Similarity in Atmospheric Fluctuations of Carbon Dioxide, Water Vapor
and Temperature over Vegetated Fields’, Boundary-Layer Meteorol. 32, 25–37.
Otto, W. D., Hill, R. J., Wilson, J. J., Sarma, A. D., Gosz, J. R., Moore, D. I. and Andreas, E. L.:
1995, ‘Results from Optical Scintillometers Operated at Sevilleta, New Mexico’, NOAA Tech.
Memo. ERL ETL-248, Environmental Technology Laboratory, Boulder, Colo., 29 pp.
Otto, W. D., Hill, R. J., Wilson, J. J., Sarma, A. D., Andreas, E. L., Gosz, J. R., and Moore, D. I.:
1996, ‘Datasets of the Scintillation Experiment at Sevilleta, New Mexico’, NOAA Tech. Memo.
ERL ETL-261, Environmental Technology Laboratory, Boulder, Colo., 42 pp.
Panofsky, H. A.: 1973, ‘Tower Micrometeorology’, in D. A. Haugen (ed.), Workshop on Micromete-
orology, American Meteorological Society, Boston, pp. 151–176.
Panofsky, H. A. and Dutton, J. A.: 1984, Atmospheric Turbulence: Models and Methods for Engi-
neering Applications, John Wiley and Sons, New York, 397 pp.
Panofsky, H. A., Tennekes, H., Lenschow, D. H., and Wyngaard, J. C.: 1977, ‘The Characteristics of
Turbulent Velocity Components in the Surface Layer under Convective Conditions’, Boundary-
Layer Meteorol. 11, 355–361.
Priestley, J. T. and Hill, R. J.: 1985, ‘Measuring High-Frequency Humidity, Temperature and Radio
Refractive Index in the Surface Layer’, J. Atmos. Oceanic Technol. 2, 233–251.
Raupach, M. R.: 1992, ‘Drag and Drag Partition on Rough Surfaces’, Boundary-Layer Meteorol. 60,
375–395.
Roth, M.: 1993, ‘Turbulent Transfer Relationships over an Urban Surface. II: Integral Statistics’,
Quart. J. Roy. Meteorol. Soc. 119, 1105–1120.
Roth, M. and Oke, T. R.: 1993, ‘Turbulent Transfer Relationships over an Urban Surface. I: Spectral
Characteristics’, Quart. J. Roy. Meteorol. Soc. 119, 1071–1104.
Schotanus, P., Nieuwstadt, F. T. M. and De Bruin, H. A. R.: 1983, ‘Temperature Measurements with a
Sonic Anemometer and Its Application to Heat and Moisture Fluxes’, Boundary-Layer Meteorol.
26, 81–93.
Smedman-H¨ gstr¨ m, A.-S.: 1973, ‘Temperature and Humidity Spectra in the Atmospheric Surface
o o
Layer’, Boundary-Layer Meteorol. 3, 329–347.
Sorbjan, Z.: 1989, Structure of the Atmospheric Boundary Layer, Prentice Hall, Englewood Cliffs,
N. J., 317 pp.
Sreenivasan, K. R., Chambers, A. J., and Antonia, R. A.: 1978, ‘Accuracy of Moments of Velocity and
Scalar Fluctuations in the Atmospheric Surface Layer’, Boundary-Layer Meteorol. 14, 341–359.
Stanhill, G.: 1969, ‘A Simple Instrument for the Field Measurement of Turbulent Diffusion Flux’, J.
Appl. Meteorol. 8, 509–513.
Stull, R. B.: 1988, An Introduction to Boundary Layer Meteorology, Kluwer, Dordrecht, 666 pp.
38. 408 EDGAR L ANDREAS ET AL.
Tillman, J. E.: 1972, ‘The Indirect Determination of Stability, Heat and Momentum Fluxes in the
Atmospheric Boundary Layer from Simple Scalar Variables during Dry Unstable Conditions’, J.
Appl. Meteorol. 11, 783–792.
Turner, S. J., O’Neill, R. V., Conley, W., Conley, M. R., and Humphries, H. C.: 1991, ‘Pattern and
Scale: Statistics for Landscape Ecology’, in M. G. Turner and R. H. Gardner (eds.), Quantitative
Methods in Landscape Ecology, Springer-Verlag, New York, 17–49.
Wang, J. and Mitsuta, Y.: 1991, ‘Turbulence Structure and Transfer Characteristics in the Surface
Layer of the HEIFE Gobi Area’, J. Meteorol. Soc. Japan 69, 587–593.
Weaver, H. L.: 1990, ‘Temperature and Humidity Flux-Variance Relations Determined by One-
Dimensional Eddy Correlation’, Boundary-Layer Meteorol. 53, 77–91.
Wieringa, J.: 1993, ‘Representative Roughness Parameters for Homogeneous Terrain’, Boundary-
Layer Meteorol. 63, 323–363.
Wyngaard, J. C.: 1973, ‘On Surface-Layer Turbulence’, in D. A. Haugen (ed.), Workshop on Microm-
eteorology, American Meteorological Society, Boston, pp. 101–149.
Wyngaard, J. C. and Brost, R. A.: 1984, ‘Top-down and Bottom-up Diffusion of a Scalar in the
Convective Boundary Layer’, J. Atmos. Sci. 41, 102–112.
Wyngaard, J. C. and Sundararajan, A.: 1979, ‘The Temperature Skewness Budget in the Lower
Atmosphere and Its Implications for Turbulence Modeling’, in F. Durst, B. E. Laundere, F. W.
Schmidt, and J. H. Whitelaw (eds.), Turbulent Shear Flows I, Springer-Verlag, Berlin, 319–326.