Newton Crime Sci (2015) 430 DOI 10.1186s40163-015-0040-7.docx
1. Newton Crime Sci (2015) 4:30
DOI 10.1186/s40163-015-0040-7
R E S E A R C H
Crime and the NTE: multi-classification
crime (MCC) hot spots in time and space
Andrew Newton*
Abstract
This paper examines crime hot spots near licensed premises in
the night-time economy (NTE) to investigate whether
hot spots of four different classification of crime and disorder
co-occur in time and place, namely violence, disorder,
drugs and criminal damage. It introduces the concept of multi-
classification crime (MCC) hot spots; the presence
of hot spots of more than one crime classification at the same
place. Furthermore, it explores the temporal patterns
of identified MCC hot spots, to determine if they exhibit
distinct spatio-temporal patterns. Getis Ord (GI*) hot spot
analysis was used to identify locations of statistically
significant hot spots of each of the four crime and disorder clas-
sifications. Strong spatial correlations were found between
licensed premises and each of the four crime and disorder
classifications analysed. MCC hot spots were also identified
near licensed premises. Temporal profiling of the MCC hot
spots revealed all four crime types were simultaneously present
in time and place, near licensed premises, on Friday
through Sunday in the early hours of the morning around
premise closing times. At other times, criminal damage and
drugs hot spots were found to occur earlier in the evening, and
disorder and violence at later time periods. Criminal
3. venience stores, restaurants, cafes, takeaways, cinemas
and social clubs. Sherman (1995, p 36) defines crime hot
spots as ‘small places in which the occurrence of crime
is so frequent that it is highly predictable, at least over
a 1-year period and this paper examines hot spots over
12–36 months. In addition to the known geographical
clustering of crime near licensed premises, NTE hot spot
areas also exhibit clear temporal patterns, especially on
Friday and Saturday evenings and early mornings, which
correspond with premise closing times (Block and Block,
1995; Newton and Hirschfield 2009b; Popova, Giesbre-
cht, Bekmuradov, & Patra, 2009; Uittenbogaard and Cec-
cato, 2012; Conrow, Aldstadt, & Mendoza, 2015). Thus
there are clear spatial and temporal patterns to NTE
crime hot spots.
There is a sound theoretical basis for the presence of hot
spots in the vicinity of licensed premises. Routine activity
theory (Cohen and Felson, 1979) and crime pattern the-
ory (Brantingham and Brantingham, 1993) contend that
persons, both potential offenders and victims, exhibit sys-
tematic movement patterns governed by their day to day
undertakings, termed routine activities. Certain places
Open Access
*Correspondence: [email protected]
The Applied Criminology Centre, The University of
Huddersfield,
Queensgate, Huddersfield HD1 3DH, UK
http://creativecommons.org/licenses/by/4.0/
http://creativecommons.org/licenses/by/4.0/
http://crossmark.crossref.org/dialog/?doi=10.1186/s40163-015-
0040-7&domain=pdf
4. Page 2 of 12Newton Crime Sci (2015) 4:30
are frequented regularly, for example home, place of work
or leisure, termed activity nodes. The routes travelled
between nodes are known as paths. This movement devel-
ops a person’s awareness space, and crime is shown to be
more likely on the edges of these activity nodes (Bow-
ers, 2014). Places at which several offenders and victims
converge form multiple awareness spaces, which increase
the likelihood of crime. Eck, Clarke, and Guerette (2007)
identify a number of ‘risky facilities’ where concentrations
of crime are evident. Indeed, a small minority of facili-
ties contribute the majority of offences at all risky facili-
ties, termed the ‘iron law of troublesome places’ (Wilcox
and Eck, 2011: 476). Examples include shopping centres,
busy road junctions, hospitals, schools, train and bus sta-
tions, and entertainment districts. Places with clusters of
licensed premises represent recreational activity nodes,
where there is a convergence of people in time and space.
This coming together may create unplanned but favoura-
ble crime opportunities, termed crime generators; or draw
in offenders to bars and localities with known opportuni-
ties for offending, termed crime attractors (Brantingham
& Brantingham, 1995). Within NTE areas both of these
eventualities are plausible.
A number of explanations exist for the occurrence of
crime in NTE areas (for good overviews see Finney, 2004;
Graham & Homel, 2008). These include: cultural factors,
relating to societies use and acceptance of alcohol; per-
son factors based on an individual’s responses and beliefs
about alcohol consumption; the psychopharmacologi-
cal properties of alcohol and their influence on an indi-
vidual’s behaviour; and contextual factors, the physical
5. and social circumstances of where and when alcohol is
consumed. Recently a focus for NTE research has been
on premise density and premise opening hours. Explana-
tions for crime have focussed on: NTE places deemed to
have ‘too many’ licensed premises, those saturated with a
high density of premises (Livingston, 2008; Pridemore &
Grubesic, 2013); and, premises open ‘too long’, with con-
cerns over the length of time premises can remain open
for, based around extensions granted in trading hours
(Chikritzhs & Stockwell, 2002; Holmes et al., 2014). What
is clear is the relationship between crime and alcohol is
multi-faceted. A useful explanation is offered by Elvins
and Hadfield (2003) who suggest a combination of fac-
tors are likely account for crime in NTE areas, including:
places with high densities of licensed premises in urban
areas; the convergence of large number of persons at
these places; crowding of persons within drinking ven-
ues in close proximity in confined spaces, often leading to
‘vertical drinking’; the consumption of alcohol, often in
large quantities; poor management of NTE places; and,
the cumulative build up of ‘environmental stresses’ over
the course of an evening.
Efforts to tackle problems of crime in the NTE have
predominantly but not exclusively focussed on: better
place management (Madensen & Eck, 2008); alcohol edu-
cation and awareness schemes; regulation of licensing,
legislation and enforcement (Hadfield and Newton 2010);
increasing the costs of unit prices of alcohol (Booth et al.,
2008); regulating the number of, and opening times of
premises (Chikritzhs & Stockwell, 2002); and high vis-
ibility police patrols. Whilst the merits of each approach
have and will continue to be debated in the literature (see
Graham & Homel, 2008; Humphreys & Eisner, 2014; Hol-
mes et al., 2014), the focus of this paper is on the use of
police patrols in NTE areas.
6. A recent movement in policing has been a resurgence
of hot spot policing, ‘targeted on foot patrols’, fuelled by
the willingness of a number of police forces to implement
randomised control trials (RCTs) of hot spot policing
effectiveness (Ratcliffe, Taniguchi, Groff, & Wood, 2011;
Braga, Papachristos, & Hureau, 2012; Groff et al., 2015).
Successes are evident for hot spot policing targeting bur-
glary, repeat calls for service, nuisance bars, drugs, and
violent crime, in particular when focussed on hot spots
defined tightly in both place and time. A caveat identi-
fied in the literature is that the effectiveness of the polic-
ing tactic used often is dependent on the type of hot spot
policed.
The process of hot spot policing involves identifying
hot spot areas, and then subsequently targeting patrols at
these places in a systematic fashion. It is contended here
that this reflects more general current trends in policing,1
of using evidence gleaned from crime analysis or crime
intelligence to inform police response. Many including
the author advocate a problem solving/evidence based
approach to policing and crime reduction. Two of the
most well know examples of this are Problem Orientated
Policing (Goldstein, 1990) and Intelligence Led Policing
(Ratcliffe, 2008). At the simplest level of explanation, the
analyst or police officer is encouraged to: firstly identify a
crime problem through some form of suitable analysis of
crime or other data; then, to further examine the identi-
fied problem to understand the mechanisms driving it
and the context of its setting; the next step is to identify
and implement possible solutions; and the final stage is to
monitor and or evaluate the effectiveness of the measure
implemented.
This paper focusses on the first stage of the pro-
7. cess, known as ‘scanning’ in the SARA model (Ashby
& Chainey, 2012) or ‘Intelligence’ in the 5Is approach
1 In the UK the College of Policing has recently launched the
What Works
Crime Reduction Centre,
http://whatworks.college.police.uk/Pages/default.
aspx; the US has a long standing Centre for Problem Orientated
Policing
(POP) http://www.popcenter.org/about/?p=whatiscpop; and the
Society of
Evidence Based Policing launched in 2012
http://www.sebp.police.uk/.
http://whatworks.college.police.uk/Pages/default.aspx
http://whatworks.college.police.uk/Pages/default.aspx
http://www.popcenter.org/about/?p=whatiscpop
http://www.sebp.police.uk/
Page 3 of 12Newton Crime Sci (2015) 4:30
(Ekblom, 2011). The process of identifying crime hot
spots for subsequent deployment of hot spot policing
tends to be atemporal. This is a reflection of both soft-
ware availability and analytical skills (Newton and Fel-
son, 2015). Furthermore, sample sizes are larger when
crime is not dissected by time of day, which increases the
robustness of hot spot analysis. Moreover, once a crime
hot spot has been identified, subsequent analysis by time
of day enables identification of when to implement hot
spot policing at detected hot spots. Perhaps an important
component of high crime places overlooked here is that
analysts are encouraged to be crime specific, and thus
tend to examine single crime classifications, for example
violent crime. This is not unexpected, the spatial patterns
8. of burglary will not closely resemble those of street rob-
bery, nor should they be expected to.
However, areas with concentrations of licensed prem-
ises are known to be highly criminogenic and not just for
violence. Associations have been demonstrated between
licensed premises and a number of crime types, most
notably violence and aggression, but also criminal dam-
age, disorder, and drug use (Scott & Dedel, 2006; Graham
& Homel, 2008; Newton and Hirschfield, 2009b). Indeed
Yang (2010) demonstrated longitudinally that correlations
in time and place exist between violence and disorder.
Furthermore, offenders have been shown to be versatile
in the types of crime they commit (Roach & Pease, 2014),
and indeed police may overestimate the specialised nature
of offending. Thus, if offenders are known to commit sev-
eral types of crime, and several types of crimes have been
shown to be related to NTE places, should analysis of crime
at these places be focussed on single crime classifications?
This discussion has demonstrated that: particular NTE
places experience more than one crime type; offenders
are known to be versatile in the types of crime they com-
mit, and that one of the limitations of spatio-temporal
analysis is that segmenting data in both time and place
can substantially reduce sample size. Combing several
‘related’ crime types into a single analysis is a possible
solution here. Therefore, this research aims to investi-
gate whether multi-classification crime (MCC) hot spots
exist near licensed premises, and if so, do they exhibit
distinctive spatio-temporal patterns. More specifically, it
examines four crime types known to be associated with
licensed premises, namely violence against the person,
criminal damage, drugs, and disorder incidents (anti-
social behaviour), to ascertain how these crimes manifest
in NTE hot spots both in time and place. The following
9. research questions were formulated for this study.
Research questions:
• Is there spatial correspondence between the locations
of hot spots for different crime and disorder classi-
fications near licensed premises (violence, criminal
damage, disorder and drugs)?
• Do MCC hot spots correspond temporally, that is to
say, when a place is a hot spot for violence, is it also a
hot spot for criminal damage?
• Do MCC hot spots fluctuate over time, for example
does a place experience criminal damage, and then
later in the day or a different day of the week experi-
ence violence against the person?
Methods
Data
This study used crime and disorder data for an
anonymised case study area in England. Its residential
population is approximately 1.5 million persons and
includes a mixture of large towns and several rural vil-
lages, covering a geographical area of approximately
600 km2. Offence data were obtained for the 3 years
period 1st January 2007 to 31st December 2009 for
crimes categorised as violence against the person
(VAP), criminal damage (CD), and drugs; based on
the UK Home Office 2010 counting rules for recorded
crime. Incident data for calls for service for disorder
(non-crimed) were also obtained for the 12 month
period 1st January to 31st December 2007. An addi-
tional dataset used was a licensed premise database
for the case study area, and 6047 premises were iden-
10. tified as ‘open’ during the considered time period
(2007–2009).
Data processing
The crime and disorder data were cleaned to include
only those containing a known time of offence, and
those with geo-spatial references outside of the case
study area were also excluded. This resulted in a sam-
ple of: 64,440 VAP offences; 83,159 CD offences; 18,270
drugs offences, and 346,022 disorder incidents. A Geo-
graphical Information Science (GIS) software program
was used to calculate the distance from each offence
or incident to the nearest licensed premise, and the
results of this are shown in Table 1. This demonstrates
that for all crime and disorder types the mean distance
to a licensed premise was approximately 130–170 m.
Median distances ranged from 80 to 125 m. Considering
these distances and other studies using buffer analysis
to examine crime near licensed premises (Newton and
Hirschfield, 2009b; Ratcliffe, 2012), a 250 m thresh-
old was selected as an appropriate distance to repre-
sent crime and disorder ‘near’ licensed premises in
this study. As shown in Table 2, for all crime and dis-
order types analysed, 50–65 % of all crime and disorder
offences (varying by crime or disorder classification)
occurred within 250 m of a licensed premise.
Page 4 of 12Newton Crime Sci (2015) 4:30
The temporal nature of offences
It was previously identified that NTE hot spots exhibit
distinct spatial and temporal patterns, with crime peaks
evident on Friday and Saturday evening, or the early
hours of Saturday and Sunday morning, around premise
11. closing times. In order to examine this further the time of
all crime and disorder in NTE hot spots (within 250 m)
were re-coded with a value representing both the time of
day and day of week (termed week-hour, ‘WH’ for this
study). There are a total of 168 h in a week, and thus each
crime and disorder incident was assigned a WH2 value
from 6 to 173.
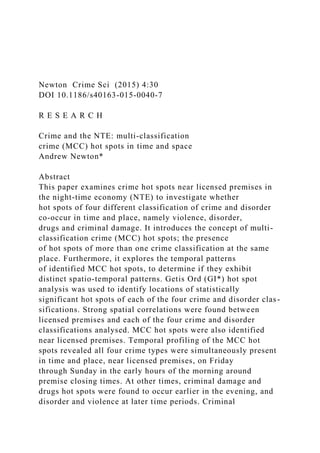
Figure 1 shows the weekly temporal distribution of
each crime and disorder type and reveals distinctive pat-
terns in the WH of VAP, CD, drugs and disorder. For all
crime and disorder types there are clear peaks during the
evening and early hours of the morning on all days. How-
ever, there are some differences in the patterns observed;
the highest peaks for disorder are on Friday evening fol-
lowed by Saturday evening, with lower peaks from Sun-
day though to Thursday; VAP peaks on Saturday evening,
followed by Sunday, Saturday, and Monday, with lower
peaks Tuesday to Thursday; drug offences peak on Satur-
day evenings, followed by Friday and Sunday, with more
2 A value of 6 represents the time period 6.00 a.m. to 6.59 a.m.
on a Sunday
morning; 23 represents 11.00 p.m. to 11.59 p.m. on a Sunday
evening; 24
represents midnight to 0.59 a.m. on a Monday morning; 47
represents 11.00
p.m. to 11.59 p.m. on a Monday evening; 48 is midnight to 0.59
a.m. on a
Tuesday; and so forth. A look up reference for this is provided
in Additional
file 1: Appendix S1.
irregular peaks during the rest of the week; for CD the
highest peaks are Sunday evening, followed by Saturday
and Friday; peaks during the rest of the week are again
12. lower, but the reduction is less than that of other crime
types. Disorder, CD and drugs also exhibit two separate
peaks during Saturday evenings which are not evident for
VAP. CD tends to have two distinct peaks in the evening
most days of the week, unlike disorder and VAP which
have single evening peaks all days except Saturday. Over-
all, there are clear and distinct temporal patterns evident
for each crime type.
It is possible that using 3 years of data may skew the
results as the temporal patterns of each crime may have
changed over time. In order to test this the WH val-
ues for each time period were compared by year, thus
WH values for 2007 were compared with those of 2008
(2007–2008), and WH values for 2008 compared with
those of 2009 (2008–2009). Mann–Whitney tests were
used to compare the means (non-parametric independ-
ent samples). The results were as follows: for VAP 2007–
2008, z = − 0.253, p = 0.8; for VAP 2008–2009 z = − 0.7,
p = 0.48; for CD 2007–2008 z = − 0.35, p = 0.25; for
CD 2008–2009 z = −0.18, p = 0.6, for drugs 2007–2008
z = −1.5, p = 0.12, and for drugs 2008–2009 z = −0.46,
p = 0.09. This suggests that there were no significant dif-
ferences in WH crime times for VAP, CD or drugs over
any of the comparative time periods, and therefore that
the WH temporal patterns of each of the three crime
types remained stable over the 3 years period. As only
12 months of data were available for disorder, tests for
this were not conducted. However, it is assumed that
these are also likely to have remained stable, based on the
stability of the recorded crime results.
Identifying hot‑spots
A range of methods can be used to identify crime hot
spots including thematic mapping, kernel density estima-
tions, nearest neighbourhood hierarchical clustering, and
13. the Getis Ord GI* statistic (Eck, Chainey, Cameron, &
Wilson, 2005; Chainey & Ratcliffe, 2005; Levine, 2015).
For this analysis the Getis-Ord GI* method (Getis & Ord,
1992; Ratcliffe, 2010; Chainey, 2014) was used to identify
significant hot spot areas of crime around licensed prem-
ises. The advantage of this method over other hot spot
mapping techniques is that it identifies small grid areas
that are statistically significant, and returns a z3 score that
measures the strength or intensity of the clustering and
its significance. This method also produces tightly
defined hot spot areas appropriate for hot spot policing.
3 The higher the z score the greater the clustering, and a z score
equal to or
above 1.960 is significant at the 95 % confidence level, and
equal to or above
2.576 significant at the 99 % level.
Table 1 Average distances of offences to licensed prem-
ises (metres)
Offence/incident N Distance to nearest licensed
premise (m)
Mean Median SD
Disorder 346,022 167.5 119.5 197.7
Violence against person 64,640 132.4 84.2 173.4
Criminal damage 83,159 163.4 124.6 178.6
Drugs 18,270 149.1 85.4 225.6
Table 2 Percentage of offences and incidents near licensed
premises (within 250 m)
14. Offence/incident N < 250 m Percentage Total N
Disorder 188,756 54.6 346,022
Violence against person 41,538 64.3 64,640
Criminal damage 44,570 53.6 83,159
Drugs 11,870 65.0 18,270
Page 5 of 12Newton Crime Sci (2015) 4:30
Using the GIS software a 250 m grid matrix was gener-
ated across the study area resulting in 104,958 grids. A
GIS was used to count the number of crimes in each grid
repeated for VAP, CD drug offences, and disorder inci-
dents. This analysis used all crimes within the case study
area. An alternative approach would be to only select
crimes within 250 m of premises, but this may skew the
hot spot generation. For each of the four classifications of
crime and disorder, GI* hot spots were calculated4 using
ArcGIS spatial statistics toolbox. Figure 2 shows the case
study area, the 250 m grids, and the location of licensed
premises. The results of the hot spot analysis are shown
in Fig. 3a–d, which maps the location of hot spots. Note
in these maps only grids which are clustered with 99 %
confidence or greater (z ≥ 2.576) are displayed, with hot
spots superimposed by the locations of licensed premises
4 The parameters for this were to use a fixed distance band,
with a threshold
(spatial lag) of 355 m (based on 250 m grids).
15. in the case study area. The images are rotated for
anonymity.
There are distinct spatial hot spots evident in Fig. 3,
which correlate with urban areas containing high densi-
ties of licensed premises. Upon first glance similar hot
spot patterns are apparent for VAP, CD, disorder and
drugs. However a more detailed visual inspection reveals
subtle differences. The extent of the hot spots around
urban centres is greater for VAP and disorder, and more
tightly concentrated for drugs and CD. Towards the bot-
tom of the case study area there are hot spots of VAP, CD
and disorder, but not for drug offences. Towards the right
of the map there is an area with large concentrations
of VAP, drugs, disorder, and CD, but close inspection
reveals the extent of this is much more spread for VAP
than the other three crime types. On these maps only
grid cells that are significant hot spots at 99 % confidence
interval are displayed. There were 2970 such cells, and
these cells are now examined further.
Fig. 1 Weekly-hourly2 crime frequencies (Sunday to Saturday)
four each of four crime types (a–d). CD criminal damage, VAP
violence against person
Page 6 of 12Newton Crime Sci (2015) 4:30
Results
The first research question was to examine the degree
to which hot spots of different crime classifications co-
exist spatially, in other words occur at the same place.
Analysis of all grids in the study area using Spearman’s
Rank revealed strong statistically significant correlations
for each crime and disorder type (Table 3) with the loca-
16. tion of licensed premises; the strongest relationship was
between premises and disorder, followed by CD, VAP,
and drugs. All crime and disorder types were correlated
with premises at R > 0.7, p < 0.01 which indicates a high
degree of correlation between the location of licensed
premises, and crime and disorder events in the case study
area.
Further analysis was undertaken using only grids sig-
nificant at the 99 % level (2970) which contained a sig-
nificant hot spot for at least one of the four crime and
disorder classifications examined. 2435 grids contained
a licensed premise, and unsurprisingly all of these grids
were identified as a statistically significant hot spot for
at least one crime type. Further analysis revealed 2485
grids of the 2970 were hot spots for VAP (83 %), 2385
for CD (80 %), 2160 for disorder (72.7 %), and 1307 for
drugs (44 %). Each grid could contain a hot spot for one,
two, three, or all four crime types, and a Conjunctive
Case Analysis (CCA, Miethe, Hart, & Regoeczi, 2008)
was used to examine the 256 (44) possible combinations
here.5 The results of this are presented in Table 4. This
found 1214 grids, 40 % of the significant crime hot spot
grids, were statistically significant hot spots for all four
crime classifications. A further 663 grids (22 %) were
significant hot spots for at least three types of crime.
This shows strong evidence of an overlap in the location
of hot spots for VAP, disorder, CD and drugs near
licensed premises and suggests strong evidence in the
case study area that MCC hot spots are present near
licensed premises.
Profiling the ‘hottest’ hot spots
The research has thus far demonstrated that MCC hot
spots are present spatially, thus hot spots of VAP are also
17. hot spots of CD for example. The purpose of research
questions two and three are to further examine the MCC
hot spots temporally, to ascertain whether the different
crime types found in the MCC hot spots occur at the
same time, at different times of day, or different days of
the week. Therefore the top twenty hot spot grids were
identified for further profiling. To determine these top
twenty cells, the ‘hottest hot spots’, cells that were statisti-
cally significant hot spots for all four types of crime and
disorder (VAP, CD, drugs and disorder) were identified.
There were 1214 of these cells. Cells with the highest
combined z scores6 were selected to represent the twenty
‘hottest’ hot spots. A profile of each of these cells is pro-
vided in Table 5. At these twenty 250 m grid cells over the
3 years period (12 months for disorder) there were a high
number of crime and disorder incidents ranging from: 78
to 802 for VAP; 252 to 1736 for disorder; 37 to 182 for
CD; and 8 to 265 for drugs. The number of license prem-
ises in each grid ranged from a minimum of 3 to a maxi-
mum of 96. In order to examine the temporal profiles of
these cells, the WH values of each crime type for each
cell was calculated, and the results of this are presented
in Fig. 4. The frequencies of offences by time of day were
divided into five equal quintiles, and these are colour
coded as per the table key. Those in red represent the
20 % of times with the highest levels of crime for each
classification, VAP, CD, disorder and drugs.
Figure 4 shows the temporal profiles of the 20 hot-
test MCC hot spots. There were seven WH time periods
(each WH is 1 h of the week) that had high levels (col-
oured red in Figure) of crime and disorder for all four
crime and disorder categories at the same time and
same place: Thursday 2.00 a.m. to 2.59 a.m.; Friday 1.00
5 An alternative here may be the use of Multiple Classification
31. o
n
ch03.indd 73 11/12/15 4:24 pm
F
O
S
T
E
R
,
C
E
D
R
I
C
1
6
9
2
T
S
74 Unit 1: That’s Life
ChECk in
From reading this chapter, you will be able to:
32. • Explain how differences caused by inherited
organellescould have societal implications.
• Describe how the characteristics that are valued
change from culture to culture and over time.
• Outline the cell theory, list and describe types
of cells, and explain endosymbiosis.
• List and describe the organellesfound in a
cell, and explain their main functions.
• Explain the processes of diffusion, osmosis,
facilitated diffusion, active transport, and bulk
transport.
The Case of the Meddling houseguest:
A Friendship Divided
Theta and Joules liked their friend Sally, but when they entered
college, they learned
that Sally was different. When they were all young, they played
together on the block,
went to each other’s birthday parties, and had some great
sleepovers. “We had a lot of
fun with Sally in sixth grade . . . I wish she could join our
sorority,” said Theta. Aghast at
the thought, Joules replied, “Don’t even say it – you know what
that would mean for us.
We shouldn’t even admit that we know her.”
“Why can I not hang out with people I like? . . . Am I not
allowed to be Sally’s
friend because of some test?” thought Theta. “There is no law
against me being friends
with Sally!” exclaimed Theta, after a long pause. Joules
dismissed Theta smugly, “You
know you can’t do it. It will never happen.” They were
expecting Sally to come into the
dorm any minute. Sally was expecting to hang out with them as
usual. But on this day,
33. their friendship had to end. On this day, Joules and Theta were
going to pledge their new
sorority . . . and Sally did not have the mark.
It was an advanced society, in 2113 with all of the comforts –
space travel beyond
the solar system, teleporting, and no more diseases that the
ancients had; instead there
were life spans approaching two centuries for the marked
people. Humans had it better
than ever, and teens had the world in their hands. Everyone with
parents that had any
sense had a mark on their children to denote their superior
genetic lineage. People in
the line of descent from genetically modified mitochondria had
an “M” on the inside
of their ears. Their life expectancy was much higher and their
health much better than
those without the mark. Finding out about one’s mitochondrial
DNA was easy, with tests
dating back over 100 years to trace the origin of one’s genes.
Mitochondria are organelles that make energy for a cell; they
are inherited from
mother to children because they have their own genetic material
and divide on their
own. Mitochondria are, in fact, separate structures existing
within our cells. They were
absorbed some 2.5 billion years ago, with their own set of DNA,
making them houseg-
uests in our bodies.
The genes in the mitochondria stay intact from generation to
generation. “This is
why the mark was so important – the health benefits,” thought
Theta. Mitochondrial
34. DNA with modified genes of a particular line of mitochondria
made people much health-
ier, free of many diseases in the society of this story.
Mitochondria are the meddling
houseguests in the title because defects in them cause a range of
diseases. For example,
Mitochondria
Is the organelle that
makes energy for a
cell.
Organelle (subcel-
lular structure)
Structures that
function within cells in
a discrete manner
ch03.indd 74 11/12/15 4:24 pm
F
O
S
T
E
R
,
C
E
D
R
I
C
35. 1
6
9
2
T
S
Chapter 3: The Cell As a City 75
mitochondrial defects in the 21st century were responsible for
many ailments, ranging
from heart disease and diabetes to chronic sweating, optic nerve
disorders, and epilepsy.
Joules told Theta, “People without the mark are jealous of us
because they die earlier
and have a worse life with more diseases. You know Sally
would never understand us.
Sally’s genes are still from the 21st century.” But something
still bothered Theta: She
liked Sally. Sally came into the dorm and Joules explained that
they were leaving for the
sorority. Sally knew what that meant and said good-bye. Theta
looked deeply at Sally,
realizing that their past was gone and that they would not see
each other again as friends.
Sally and Theta both had a single tear in their eyes and they
knew they were part of each
other’s youth . . . and that meant something.
But Theta looked back one last time and said thoughtfully to
herself, “She’s not one
of us.”
36. Culture, Biology, and social stratification
Culture plays an important role in defining what is desirable
and valued in society. Often
decisions on what it means to be “better” are based on cell
biology. Our genetic material
makes each of us unique and guides the workings of our cells.
We all have the same set
of cell structures or organelles, but, as in our story, genetic
variations give each per-
son unique characteristics. While the opening story is science
fiction, its possibilities
are real. Gene technology is improving human health and has
the potential to “design”
human genes and organelles, possibly leading to social issues
like those described in the
conflict faced by Sally, Joules, and Theta.
Biological differences may lead to social changes based on what
a society values
at any one time. For example, research shows that certain
biological features are used
to decide social value of people: symmetry of one’s face, body
fat distribution in both
genders, and musculature in males; smooth skin, good teeth, and
a uniform gait. These
are all biologically determined, based on how our cell structures
work together. Much
as mitochondrial inheritance, described in the story dictates
health and organismal func-
tioning, all cell structures give living systems their
characteristics.
Historically, all cultures have used biology to classify people.
Humans are suscepti-
ble to group messages, such as the one that influenced Theta’s
37. and Joules’ final decision
to abandon their friendship with Sally. The average American is
exposed to about 3,000
marketing messages per day. This sets up a value system that
requires us to reflect on
how biology and society can affect our thinking.
ChECk Up sECTion
The exclusion of people in our futuristic science
fiction storyreflects a theme in human
society and
history. As a result of cell differences
between Theta and Sally, their friendship ended
– each possessed
a different type of mitochondrion.
Choose a particular situation in which a social
stratification (layering) system is set up in a
society,
in which one group thinks it is better
than another. You may choose a present system
or one of the
past. Is the stratification system reasonable? Is
the system based on cell biology? What
are the system’s
benefits? What are its drawbacks?
ch03.indd 75 11/12/15 4:24 pm
F
O
S
T
E
R
38. ,
C
E
D
R
I
C
1
6
9
2
T
S
76 Unit 1: That’s Life
BOdy Art And Skin BiOlOgy in SOciety
Body alterations in the quest for physical
beauty are as old as history. Egyptians
used cosmetics in their First Dynasty (3100–2907 BC).
Hairstyles, corsets, body-
weight goals, and body piercing and tattooing trends
have changed through human
history. Scars have been viewed as masculine and a
mark of courage, and tattoos
were drawn and carved in ancient European,
Egyptian, and Japanese worlds.
Body art was popular in modern western society
among the upper classes in
the early19th century. It lost favor due to stories
39. of disease spreading because
of unsanitary tattoo practices. Only the lower
classes adopted body art to show
group affiliation. Tattooing has recently gained
popularity; but body art has been
used as a symbol of self-expression and as a
social-stratification mechanism in
many cultures: Indian tattoos mark caste;
Polynesians used marks for showing mar-
ital status; the Nazis marked groups from their
elite SS to concentration camp pris-
oners; and U.S. gangs use it to showgroup
membership. Tattooing has been firmly
established in societies and continues to growin
popularityin the United States.
The canvas for tattoos is skin, which is part of
the integumentary system
and has a variety of functions in humans (Figure
3.1). It
• maintains temperature;
• stores blood and fat; and
• provides a protective layer.
We will discuss this important system in a later
chapter.
In this chapter, we will look at the structure and function of the
eukaryotic cell. We
will see that, while there are marked differences between plant
and animal cells, the
basic processes carried out at the cellular level are remarkably
the same, as are those of
simple, unicellular organisms. We will compare the organelles
(structures) of the cell
to functions of a city to emphasize that all parts are needed.
Each organelle has its own
41. o
m
ch03.indd 76 11/12/15 4:24 pm
F
O
S
T
E
R
,
C
E
D
R
I
C
1
6
9
2
T
S
Chapter 3: The Cell As a City 77
Exploring the Cell
The Microscope
The human body is composed of over 10 trillion cells, and there
are over 200 different
types of cells in a typical animal body, with an amazing variety
48. 78 Unit 1: That’s Life
to be visible to our naked eyes and can only be identified by
using microscopes to
magnify them.
There are several types of microscopes; perhaps the one with
which you are already
familiar is the compound light microscope. The compound light
microscope uses two
lenses: an ocular and an objective lens. Each of these is a
convex lens, meaning that its
center is thicker than its ends. Convex lenses bring light to a
central, converging point to
magnify the specimen. A microscope’s parts are seen in Figure
3.3.
The purpose of a microscope is to magnify subcellular parts.
What is magnifica-
tion? Magnification is the amount by which an image size is
larger than the object’s size.
If a hair cell’s image is 10 times bigger than its original object,
the magnification is 10
times. If it is 100 times bigger, then the magnification is 100
times. The microscope uses
two lenses to magnify the specimen: an ocular (eyepiece), which
generally magnifies
between 10 and 20 times, and a series of objective lenses (each
with higher magnifica-
tions). The total magnification of a specimen is equal to the
ocular (in this example let’s
use10 times) times the magnification of one of the objective
lenses.
Most animal cells are only 10–30 µm in width. It would take
over 20 cells to span the
49. width of a single millimeter. Recall that a millimeter is only as
wide as the wire used to
make a paper clip. See Table 3.1 for measurements used for
looking at living structures.
How were cells and their smaller components discovered using
the microscope?
Anton van Leeuwenhoek and Marcello Malpighi built
microscopes in the late 1600s. At
this time, those instruments were very rudimentary. They
consisted of a lens or a com-
bination of lenses to magnify smaller objects, including cells.
Both scientists used their
instruments to observe blood, plants, single-celled animals, and
even sperm. Van Leeu-
wenhoek’s microscope is shown in Figure 3.4. At about the
same time that van Leeuwen-
hoek and Malpighi were making their observations, Robert
Hooke (1635–1703) coined
the term cell, as he peered through a primitive microscope of
his own construction.
When he viewed tissues of a cork plant, Hooke saw what
seemed to be small cavities
separated by walls, similar to rooms or “cells” in a monastery
(see Figure 3.4). These
cells are defined as functioning units separated from the
nonliving world.
Although it has progressed in design, materials, and technology,
the compound light
microscope is based on the same principle as in the 17th
century: light bends as it passes
through the specimen to create a magnified image. Some amount
of light always bends
compound light
52. Chapter 3: The Cell As a City 79
when hitting the edges of the lens, causing scattering in a
random way. The random
scattering of light, called diffraction is bad for getting a clear
focus on the image. Dif-
fraction also limits the resolution of the image. Resolution is
defined as the ability to see
two close objects as separate. (Think about looking at two lines
on a chalkboard that is
very far away; chances are they blur together and look like one
messy line.) In fact, the
human eye has a resolving power of about 100 µm or 1/10th of a
millimeter for close-up
images. In other words, two lines on a paper closer than 1/10th
of a millimeter apart look
blurry to us. The light microscope is limited in the same way by
diffraction because the
diffracted rays create blurry images.
diffraction
The random scattering
of light.
resolution
Is the ability to see
two closeobjects as
separate.
Figure 3.4 Hooke’s microscope from the 1600s
and van Leeuwenhoek with his
microscope. These simple microscopes led to
the first descriptions of cells. Van
Leeuwenhoek’smicroscope consisted of a small
53. sphere of glassin a holder.
1 centimeter (cm) =
1/100 meter or 0.4 inch
3 cm
Ch
ick
en
e
gg
(th
e
"y
ol
k"
)
1 mm
Fr
og
e
gg
, f
ish
e
54. gg
1 meter = 102 cm = 103 mm = 106 µm =109 nm
Unaided human eye
1 millimeter (mm) =
1/1,000 meter
1 micrometer (µm) =
1/1,000,000 meter
1 nanometer (nm) =
1/1,000,000 meter
100 µm
Hu
m
an
e
gg
Light microscopes
Electron microscopes
10–100
Ty
pi
ca
l p
61. O
S
T
E
R
,
C
E
D
R
I
C
1
6
9
2
T
S
80 Unit 1: That’s Life
Higher magnification under the microscope leads to greater
diffraction. This is the
reason a compound light microscope can magnify only up to
1000–1500 times (under
oil immersion), after which there is too much diffraction for a
clear image to be formed.
To overcome the effect of diffraction and achieve clarity at
higher magnifications, oil is
placed on the slide. However, even with oil immersion, only the
large nucleus of a cell
can be seen; other organelles appear as small dots or not at all.
62. So how did the more complex world of even smaller structures
within cells get dis-
covered? The 1930s saw the development of the electron
microscope that allowed for
magnifications of over 200,000 times greater than that of the
human eye. There are two
types of electron microscopes: transmission electron microscope
(TEM) and scanning
electron microscope (SEM). Transmission electron microscopy
allows a resolving power
of roughly 0.5 nm (see Table 3.1) that visualizes structures as
small as five times the
diameter of a hydrogen atom. Electron microscopes use
electrons instead of light, which
limits diffraction and increases resolution. Magnets instead of
lenses focus electrons to
create the image. The electrons pass through very thin slices of
the specimen and form
an image.
A SEM looks at the surfaces of objects in detail, while a TEM
magnifies structures
within a cell. The SEM has a resolving power slightly less than
the TEM, at 10 nm. (A
depiction of an electron microscope is shown in Figure 3.5.)
Electron microscopy has
led to many scientific developments, uncovering subcellular
structures to help us under-
stand cell biology. Seeing a mitochondrion enables us to better
understand diseases and
perhaps, if our opening story becomes reality, improve societal
health through its use.
Cell Theory
Fairly recent advances in microscopy have allowed scientists to
63. learn about the structure
and function of even the tiniest components of cells, but the cell
theory, which states key
ideas about cells, developed a long time ago. We have seen that
scientists began study-
ing cells in the early 1700s. About a century later, in 1838, a
German botanist named
Matthias Schleiden (1804–1881) concluded that all plants he
observed were composed
of cells. In the next year, Theodor Schwann (1810–1882)
extended Schleiden’s ideas,
transmission elec-
tron microscope
(teM)
A type of electron
microscope that
magnifies structures
within a cell.
Scanning electron
microscope (SeM)
An electron
microscope that
looks at the surfaces
of objects in detail
by focusing a beam
of electrons on the
surface of the object.
Figure 3.5 a. A researchersits at a modern
electron microscope. b. Apple tree pollen
grains on cells, an
electron micrograph.
66. 2
T
S
Chapter 3: The Cell As a City 81
observing that all animals are also made of cells. But how did
these cells come to survive
generation after generation? The celebrated pathologist Rudolf
Virchow (1821–1902)
concluded in 1858 that all cells come from preexisting cells (He
wrote this in Latin:
“Cellula e cellula”). These scientists contributed, together, to
the postulates of the cell
theory. The cell theory is a unifying theory in biology that
places the cell as the center of
life and unifies the many branches of biology under its
umbrella. The cell theory states
that:
1) All living organisms are composed of cells.
2) The chemical reactions that occur within cells are separate
from their
environment.
3) All cells arise from other cells.
4) Cells contain within them hereditary information that is
passed down from par-
ent cell to offspring cell.
The cell theory showed not only that cells are the basic unit of
life, but that there is
continuity from generation to generation. Genetic material is
67. inherited in what we refer
today as the cell.
Types of Cells
Microscopes allowed researchers to examine differences
between organisms that had
previously been impossible to determine. A current
classification of organisms defines
five kingdoms, with organisms in those kingdoms having
similar types of cells (There
is some debate arguing inclusion of Archaea bacteria as a
separate kingdom, and a six-
system classification scheme is thus also accepted). Cells of
organisms in the five king-
doms each have many internal differences, as summarized in
Table 3.2. Images of some
organisms of each kingdom are given in Figure 3.17 as
examples.
Prokaryotes (bacteria) are composed of cells containing no
membrane-bound
nucleus and no compartments or membranous organelles. They
are much smaller than
eukaryotes, by almost 10 times. Prokaryotic genetic material is
“naked,” without the
protection of a membrane and nucleus. They are composed of
very few cell parts: a
membrane, cytoplasm, and only protein-producing units called
ribosomes. Even without
most structures found in other organisms, prokaryotes contain
genetic material to repro-
duce and direct the functions of the chemical reactions
occurring within its cytoplasm.
group domain cell type cell number cell Wall component energy
Acquisition
69. S
T
E
R
,
C
E
D
R
I
C
1
6
9
2
T
S
82 Unit 1: That’s Life
Prokaryotes have a simple set-up, but all of the needed
equipment to carry out life func-
tions. Bacteria have a rapid rate of cell division and a faster
metabolism than eukaryotes.
Most organisms on Earth, in terms of sheer number, are
prokaryotes.
• As indicated in Chapter 1, prokaryotes include organisms in
the Bacteria and
Archae domains. These organisms will be discussed further in
Chapter 8.
70. All other organisms (plants, animals, fungi, and protists) are
eukaryotes. Cells of
eukaryotes are complex, containing a membrane-bound nucleus
that houses genetic
material. Eukaryotic cells comprise compartments that form a
variety of smaller internal
structures, or organelles. Eukaryotic cells are the focus of this
chapter, which will give
an overview of the primary organelles and their functions
(Figure 3.6).
Eukaryotes may be examined by dividing into its four groups:
plants, animals, fungi,
and protists. Plants contain cells that are surrounded by a cell
wall, a rigid structure giv-
ing its organisms support. Plant cells contain chloroplasts,
which enable plants to carry
out photosynthesis, using energy from sunlight to make food.
• Plant cell walls contain cellulose, which gives structure to
plants as discussed
in Chapter 2. The process of photosynthesis, producing food for
plants, will be
further discussed in Chapter 4.
Plants also have large vacuoles or storage compartments to hold
water and minerals for a
plant’s functions. While both plants and animals have a cell
membrane, animal cells are
Photosynthesis
The process by which
green plants use
sunlight to synthesize
nutrients from water
77. 84 Unit 1: That’s Life
less rigid, surrounded only by a cell membrane and lacking a
cell wall for support. Both
plants and animals contain membrane-bound organelles, but
animals also contain a set
of small structures called centrioles, which serve in cell
division. Animal cells are also
quite complex, as we will see. While lacking certain organelles,
such as cell walls and
chloroplasts, they have flexible strategies to perform many
functions.
Fungi have cell walls but no chloroplasts. They are not able to
make their own food
and, instead live off of dead and decomposing matter as well as
other living organisms,
centriole
Minute cylindrical
organellesfound in
animal cells, which
serve in cell division
(not given in bold in
text).
(b) C
o
p
yr
ig
h
80. ch03.indd 84 11/12/15 4:24 pm
F
O
S
T
E
R
,
C
E
D
R
I
C
1
6
9
2
T
S
Chapter 3: The Cell As a City 85
to obtain energy. Mushrooms and yeasts are familiar types of
fungi, which will be dis-
cussed in Chapter 7.
Some species of protists are a bit animal-like in that they are
able to move; other
species are a bit plant-like in that they have chloroplasts.
87. Chapter 3: The Cell As a City 87
…
lable at ScienceDirect
Applied Geography 69 (2016) 65e74
Contents lists avai
Applied Geography
journal homepage: www.elsevier.com/locate/apgeog
Street profile analysis: A new method for mapping crime on
major
roadways
Valerie Spicer*, Justin Song, Patricia Brantingham, Andrew
Park, Martin A. Andresen
Institute of Canadian Research Studies, Simon Fraser
University, Burnaby, BC, Canada
a r t i c l e i n f o
Article history:
Received 10 November 2015
Received in revised form
16 February 2016
Accepted 21 February 2016
Available online 4 March 2016
Keywords:
Crime mapping
Environmental criminology
Human movement
89. public safety is a primary planning strategy for many urban
centers
(Loukaitous-Sideris, 2014; Newton, 2004; Skogan, 2015; Smith,
Phillips and King, 2010). These competing infrastructures can
sometimes create very specific crime dynamics that if left unat-
tended over time alter, or in some cases contradict, the original
planning concept for an area (Knapp, 2013; Spicer, 2012). The
new
crime analysis technique presented in this paper can be used to
identify areas where crime surges along major roadways and to
compare these patterns to transecting roadways. This mapping
technique can clearly visualize temporal variances, crime type
comparisons and historical crime trends.
Street profile analysis is ideal for small and linear places where
conventional analytical approaches are not fully suitable for
visu-
alizing of crime in these spaces. Most often, practitioners use
maps
to visualize crime patterns such as kernel density maps and
aggregate address count maps (Chainey & Ratcliffe, 2005;
Chainey,
Tompson, and Uhlig, 2008; Eck and Weisburd, 2005). These
[email protected] (J. Song), [email protected][email protected]
(M.A. Andresen).
techniques are useful in presenting crime patterns throughout an
area in order to expose crime hot spots and high crime
locations.
However, in order to demonstrate crime velocity or variance
along
a linear space, it may be preferable to engage in a graph
approach,
called street profile analysis, where the roadway is the x axis
and
crime count the y axis.
90. To the knowledge of the authors, this is a new crime mapping
technique that can be utilized to study small urban areas along
major roadways and to better understand the dynamics in these
places. The research presented in this paper examines a major
roadway in Burnaby, British Columbia. Burnaby in a
jurisdiction in
Metro Vancouver and the area under study contains several ele-
ments including a large regional shopping centre, a mass trans-
portation station, a major roadway, a bike path, businesses and
multi-dwelling residences. Several street profile views of this
place are presented to demonstrate the variety of crime
dynamics
and the utility of this new mapping technique. A transect meth-
odology is used in conjunction to compare and contrast
roadways
that bisect this major roadway.
From a practitioner perspective, street profile analysis is “user
friendly” and can be produced using most analytical packages.
The
advantage of this approach is that it can clearly define where
crime
specifically peeks, both in space and in time, thus optimizing
pre-
ventative strategies. Compared to techniques such as kernel
density
that diffuses the visual image of crime, this street profile
technique
sharpens the situation and can clearly demonstrate the problem.
The street profile analysis is compared and contrasted to three
Delta:1_given name
Delta:1_surname
Delta:1_given name
Delta:1_surname
Delta:1_given name
91. mailto:[email protected]
mailto:[email protected]
mailto:[email protected]
mailto:[email protected]
mailto:[email protected]
mailto:[email protected]
http://crossmark.crossref.org/dialog/?doi=10.1016/j.apgeog.201
6.02.008&domain=pdf
www.sciencedirect.com/science/journal/01436228
http://www.elsevier.com/locate/apgeog
http://dx.doi.org/10.1016/j.apgeog.2016.02.008
http://dx.doi.org/10.1016/j.apgeog.2016.02.008
http://dx.doi.org/10.1016/j.apgeog.2016.02.008
V. Spicer et al. / Applied Geography 69 (2016) 65e7466
other techniques. The strength and weaknesses of each
technique is
discussed.
2. Mapping framework
Environmental Criminology provides a theoretical framework
for mapping crime in urban areas. Urban infrastructure and its
impact on human movement and directionality influences crime
occurrences by concentrating them into small, definable places.
Crime analysis and mapping techniques can imbed these
theoret-
ical concepts into specific approaches that help to further define
and understand these crime dynamics. The street profile
mapping
technique is based on these concepts of the urban infrastructure
and is designed to demonstrate how crime occurs in small defin-
able places and can surge due to specific dynamics in the
environment.
92. 2.1. City infrastructure
The urban infrastructure contains nodes, paths and edges where
crime is concentrated (Brantingham & Brantingham, 1984).
These
are geographic spaces that also transition through temporal vari-
ances creating definable crime patterns (Brantingham &
Brantingham, 1984, 1993a, b). Nodes are places where human
ac-
tivity is concentrated such as the crossing of two paths or an
attractive place such as a mall. The crime patterns at nodes
should
be viewed as temporal because the activity at these places is not
generally consistent. As a simple example, malls are not usually
open 24 h per day therefore and the potential for shoplifting is
completely eliminated by the closure of the mall while this
same
closure creates the potential for burglary.
Paths are channels designed for human movement (vehicle e
pedestrian e mass transportation e bicycle or foot paths). Edges
are
boundaries between places that transition from one type of place
to
another such as a single-family dwelling area to a commercial
zone.
Like nodes, paths and edges transition through various temporal
states that impact crime patterns. Within this framework, the
street
network is of interest because it links and defines the
interaction
between these elements (Brantingham & Brantingham, 2015;
Davies & Johnson, 2015; Johnson & Summers, 2015;
Vandeviver,
Van Daele, & Vander Beken, 2015).
93. In certain places in the urban environment these three elements
are consolidated and in some ways compressed along certain
street
segments. This can create crime surges and the street profile
analysis can locate these places, then assist in analyzing the
tem-
poral and crime dynamics. In particular, major roadways that
contain activity nodes, high volume pathways and edges are sus-
ceptible to these crime dynamics. Within this context, the street
profile analysis can display the variance in crime density in a
manner that clearly defines the impact of these three elements
on
crime patterns.
2.2. Effectively mapping small places
Crime place theory focuses on crime events in small places such
as specific addresses, business types and block faces (Eck and
Weisburd, 1995). These small places can be categorized by
feature, cluster or facility (Eck and Weisburd, 1995). Features
include aspects such as physical or social structure, while
clusters
can be understood as hot or cool spots, and facilities, or
addresses,
are places such as bars, problem premises, or parks (Eck and
Weisburd, 1995).
Major roadways contain successive small places that create
variability and sudden increases in criminal events along their
trajectory. In a spatial analysis of street segments in Seattle,
WA,
Groff, Weisburd and Yang (2010) found that contiguous street
segments could have very different (sometimes opposite) trajec-
tories. These increases or decreases in crime can be better
under-
stood using the elements defined in crime place theory (features
94. e
clustering e facilities). For instance, the presence of a facility
like a
mall on a major roadway produces criminogenic features such
as
reduced guardianship and increased target opportunity, and also
creates a clustering of criminal events that may lead to small
places
next to one another having very different crime patterns.
Another
example is a strip of licensed establishments also generating a
crime surge.
The street profile analysis can describe the linearity of a major
roadway while at the same time exposing the multiple variances
that can occur in such a place. In particular, this graph
technique
simplifies crime patterns and can produce comparisons on a
single
graph which allows for detailed analysis of crime, place and
time.
2.3. Vizualizing the effect of crime attractors and crime
generators
Crime attractors and crime generators are both small places
with specific characteristics that make them higher crime areas
(Brantingham & Brantingham, 1995). Crime generators are
places
that attract a large number of people such as a shopping or
enter-
tainment district, or a sporting venue. They produce crime
because
there are many people in attendance and also many potential
tar-
gets, thus the opportunity for crime is present, en masse. Crime
95. attractors are also small places, however these are well-known
for
their criminal opportunities and, therefore, attract criminals.
Strongly motivated offenders, usually not from that area, attend
these places for criminal purposes. Some examples of crime
attractors are drug or prostitution markets, or shopping malls
near
a major transit hub.
Crime patterns along major roadways may vary because of the
number and size of crime attractors and generators they contain.
Major roadways are linear spaces in the urban infrastructure
that
often bisect multiple neighborhoods. Crime peaks along these
roadways, and their variance through time and crime type, can
be
better explained using the concepts of attractors and generators.
As
well, when considered longitudinally, the variation in crime
peaks
or the emergence of a crime surge may be the result of a
generator
turning into an attractor. The street profile analysis technique
ex-
poses crime attractors and generators by clearly defining crime
density along the roadway.
2.4. Conceptualizing urban directionality
The relationship between urban directionality and crime has a
long history founded on the concept of spatial criminology
(Frank,
Andresen, Cheng, & Brantingham, 2011; Rengert & Wasilchick,
1985). Research has demonstrated the influence of crime on
macro urban directionality through the criminal attractiveness
of
96. town centers, the impact of mass transportation and the
formation
of criminogenic streets and neighborhoods (Herrman, 2013;
Song,
Spicer, Brantingham and Frank, 2013). The micro and
individual
aspect of directionality is explained by the geometry of crime
(Brantingham & Brantingham, 1981). This perspective helps ex-
plains and further clarify factors such as temporal constraint
(Ratcliffe, 2006), directional bias by crime type (Van Daele &
Bernasco, 2012), and more recently the directional bias of
repeat
property offender within a large-scale sample (Frank, Andresen,
&
Brantingham, 2012; Frank et al., 2011).
The analysis of major roadways is a meso analysis of urban
directionality. Within large metropolitan cities there are smaller
sub-sets of areas and pathways where human activity is concen-
trated for various reasons. These may include attractive
pedestrian
V. Spicer et al. / Applied Geography 69 (2016) 65e74 67
areas, shopping strips, an area known for pubs and restaurants,
business districts, or a college campus. The street profile
mapping
technique allows researchers and practitioners to further under-
stand the impact of these factors on crime patterns along major
roadways. This technique also lends itself to comparative
analysis
between crime density and other factors such as vehicle or
pedestrian traffic.
3. Research study
97. 3.1. Study area
Fig. 1 is the study area and major roadway called Kingsway
runs
through this area from west to east. This arterial street traverses
diagonally three major municipalities in the Metro Vancouver
re-
gion (Vancouver e Burnaby e New Westminster). In some
portions
of this roadway, a Skytrain route runs parallel to Kingsway. The
Skytrain is a light-rail mass transit metro route that is mostly
elevated above ground and services the Metro Vancouver
region.
The study area also includes a bike path that runs parallel to
Kingsway. At the center of the study area is a regional shopping
centre. This shopping centre is the largest mall in British
Columbia.
There are business towers attached as well as high-density
dwell-
ing residences surrounding this mall. The transecting roadways
in
this study area are mostly collector streets except for Royal Oak
that
is a minor arterial street servicing Burnaby. Two transecting
Fig. 1. Stud
roadways e Willingdon Ave and Royal Oak Ave e are
highlighted in
Fig. 1
3.2. Data
This study utilizes data from the Police Information Retrieval
System (PIRS) and GIS Innovation data.
3.2.1. PIRS
98. The Crime Data-Warehouse (CDW) is a collection of datasets
that contains officially reported crime events for Royal
Canadian
Mounted Police (RCMP) jurisdictions in British Columbia.
RCMP
jurisdictions vary in size of police membership and also area
covered. This dataset contains approximately 4.4 million crime
events. The study area is located within the jurisdiction of
Burnaby
RCMP. There are 38,855 crime events from the middle of 2001
to
the middle of 2006 in the study area. The crime events are
reported
offences to the Burnaby RCMP. These events are varied
including,
but not limited to, property crime, violent crime, drug and
traffic
offences. These data contain attributes about the crime event
such
as date, time, location, offender information, and specific crime
type.
3.2.2. GIS innovations data
The 2006 road network data from a company named GIS In-
novations were used to geocode crime event locations. The data
y area.
V. Spicer et al. / Applied Geography 69 (2016) 65e7468
were interpolated to a 98.8% geocoding success rate. This road
network data were also used to visualize the output results.
3.3. Mapping methodology
99. Five mapping techniques are compared to demonstrate the
utility of the new technique proposed in this study. The first
three
are often used for crime analysis: kernel density, aggregate
count to
address and aggregate count to street segment (Chainey &
Ratcliffe,
2005; Weisburd, Groff, & Yang, 2012). These techniques
visualize
crime using a map. The proposed street profile methodology
pre-
sents spatial data in an abstract format on a graph. This
technique is
beneficial when studying major roadways because it lends itself
well to temporal and crime comparison analysis. As well, when
merged with the transect mapping methodology, crime distribu-
tion on adjacent and transecting roadways further amplifies the
crime patterns on the major roadway.
3.3.1. Kernel density
The kernel density function is used in a first instance to
visualize
the data in this study. The search radius was set for three
different
distances: 50, 100, and 250 m. In all three instances, the maps
were
produced using 50 m rasters. A 50-m raster size was selected
because this distance covers on average a half block. Therefore,
this
raster size shows variation at the block level.
3.3.2. Aggregate count to address
This technique aggregates crime to specific addresses. Then
100. further classes of aggregation are formed to show high and low
crime locations. Those crime locations that contain one to three
crime incidents were treated with a slight random perturbation
to
ensure de-identification for privacy purposes and does not
affect
the visualization of the results.
3.3.3. Aggregate count to street segment
This technique is a more recent development in crime analysis.
Both Weisburd et al. (2012) and Curman, Andresen, and
Brantingham (2015) demonstrate the utility of this analysis spe-
cifically when looking at historical crime patterns. In this tech-
nique, crime count is aggregated to the street segment and then
further classes of aggregation can be formed to show high crime
street segments.
3.3.4. Street profile
Unlike the three previous methods, the street profile method is
presented on a graph and used to study areas in a different
manner
to provide another description of the crime problem. The street
profile is created using successive circular buffers that have a
50-
m radius, overlapped at the center point, and aligned with the
roadway. Fig. 2 illustrates the location of the buffers along the
roadways and how these are overlapped in order to consolidate
the
crime that is shown in the street profile.
Once these data are collated, the output is converted to a line
graph and can be exported to Excel and made into a chart.
Trans-
ecting streets can be labeled on the vertical axis to help orient
101. the
viewer.
3.3.5. Line-transect methodology
Line-transect methodology is most often used in ecological
sampling for animals or plants (Manly & Navarro Alberto,
2015).
Lines are placed through the study area in order to establish
sys-
tematic sampling methodology. In this study, we adapt this
approach to the street network in order to analyze patterns of
crime
on the streets that transect the major roadway. When working
with
the street profile method, the line-transect methodology reveals
the condensed and directional nature of crime patterns and how
transecting streets have alternative dynamics. We further add
cir-
cular 50 m buffers to demonstrate crime directionality through a
static visualization. The direction of the buffers is angled in
order to
encompass both sides of each street.
4. Results
The crime events in this study are analyzed and visualized using
the four methods: kernel density, aggregate to address,
aggregate
to street segment and street profile. These visualizations are
dis-
cussed in terms of their utility and limitations.
4.1. Kernel density
This first method utilizes the kernel density function. This is a
102. common technique used in crime analysis and typically
produces
hotspot maps. In these examples, the study area is quite small
therefore the pixelization is very pronounced. More often, the
hotspot maps produced with this technique are of larger areas
and
the pixelization is more smoothed. Such representations can be
problematic. When producing a value for each kernel, the kernel
density method uses a bandwidth to capture the number of
events
within a specified area and then applies a spatial average
(Bailey &
Gatrell, 1995). Though it may be true that most users of kernel
density functions are aware of this limitation, not all of those
who
interpret the resulting maps will be. Three different search radii
were utilized to create the maps in Fig. 3 and are displayed
using
50 m rasters.
The map that utilizes 50-m search radius for single crime events
in Fig. 3 produces a confusing result in that there appears to be
great variation within the study area. This variation may also
lead to
false conclusions about the actual location of crime hotspots
(Song,
Frank, Brantingham, & LeBeau, 2012). The inherent smoothing
ef-
fect of the kernel density function can actually create a hotspot
between two crime locations rather than showing the reality of
the
situation because of the bandwidth and spatial averaging of the
function as mentioned above (Song et al., 2012). As the search
radius is increases to 100 m and 250 m in Fig. 3, the hotspot be-
comes more generalized. Overall, the kernel density function is
best
103. used to provide a broad idea of crime and to locate high crime
areas.
However, in order to understand the specific location and
dynamics
of crimes, other techniques are necessary.
4.2. Aggregate count to address
This second method is also commonly used in crime analysis. In
Fig. 4 crimes are displayed using dots with each one indicating
a
crime. Multiple instances can then be aggregated to display
clus-
ters. Different classes can be created to show high crime
locations.
This technique is useful in identifying high crime locations.
Specifically, the aggregation of crime events is particularly
suitable
when trying to identify high crime locations. Because this tech-
nique is location specific, conducting temporal or crime
compari-
sons is not visually suitable on a single map. Rather, two maps
need
to be placed side by side in order to compare things such as
crime
events by time of day, crime type or over time. Additionally, as
the
density of events at a particular location increases, these dot
maps
become difficult to interpret. If one dot represents each event a
high
volume location becomes saturated with dots quickly. This issue
can be resolved to some extent with the use of graduated dots
(larger dot for a greater number of points). Finally, another
signif-
104. icant concern with this technique, especially when used for
public
distribution, is individual privacy (Kounadi, Bowers and
Leitner,
2015). Privacy concerns arise in areas where there are fewer
Fig. 2. Street profile technique.
Fig. 3. Kernel density comparative visualization 250 m-100 m-
50 m Rasters.
V. Spicer et al. / Applied Geography 69 (2016) 65e74 69
crimes and the marked crime location can potentially identify
the
victim.
4.3. Street segment crime density
This third analysis technique is not as commonly used in crime
analysis, but has become common within the crime and place
literature - see Weisburd (2015) for a recent review and
discussion
of this literature. In Fig. 5, the crime events are aggregated to
the
street segments and, like the aggregate count to address, crime
events on street segments can be further aggregated and placed
into defined classes. Research that investigated the trajectories
of
street segments over time has labeled them in the various
permutations of low, medium, and high-crime as well as stable,
increasing, and decreasing (Curman et al., 2015; Weisburd et
al.,
2012).
This visualization technique is very useful in order to identify
105. high crime street segments (Curman et al., 2015; Weisburd et
al.,
2012). These high crime places could be further analyzed in
order
to determine the environmental dynamics in these locations.
However, like the previous technique, this one also has
comparative
limitations. In order to visually compare street segments for
such
things as night and day crime, longitudinal analysis or crime
type
comparison, two or more maps would need to be compared.
Fig. 4. Aggregate count to address.
V. Spicer et al. / Applied Geography 69 (2016) 65e7470
4.4. Street profile
Unlike the three previous techniques, the street profile tech-
nique is not presented on a map, but rather on a graph. This
sim-
plifies the visualization and therefore allows for comparative
analysis on a single chart. In Fig. 6, crime events are displayed
using
a line graph and this single line shows how crime fluctuates
along a
roadway. In this first example, three separate years are
compared
(2003e2004 e 2005). This longitudinal analysis shows how
crime
is increasing at regional shopping centres and becomes an
obvious
crime attractor. Table 1 accompanies the map to show the actual
percentage increase as well as the raw numbers.
106. There are several benefits to this technique. First, the graph is
simple to read even for non-subject matter experts. Second, the
graph describes the crime dynamic well e is crime going up or
down? Third, the graph shows the variation of crime on
roadways
and helps clearly define high crime places.
Other comparisons can also be completed. In Fig. 7, crime by
day
and night are compared. Clearly, more crime occurs during the
day,
which is congruent with this particular high crime location e a
regional shopping centre.
In Fig. 8, crimes are compared by type. Again, this further clar-
ifies the problem with property crime prevailing, also explained
by
the type of location.
4.5. Transect analysis
The transect analysis is a means to describe in a static manner
the dynamics of crime directionality that is exposed using the
street profile analysis. The street profile graph reveals a
significant
crime surge at the mall with two other lower surges at the
nearby
intersecting streets (Willingdon Ave and Royal Oak Ave). A
further
analysis of these intersecting streets using the transect
methodol-
ogy shows the prominent directionality of crime along
Kingsway. In
Fig. 9, 50 m buffers are used to demonstrate directionality with
the
line transect at intersections. There exists an eastward pull on
107. Kingsway between the intersections of Willingdon Ave and
Royal
Oak Ave. The directional aspect of crime dissipates quite
rapidly
towards the north and south of Kingsway. As well, the crime
den-
sity at these intersections is highly varied with a higher density
on
Kingsway. This contrast is of particular note at Kingsway and
Willingdon where crime density is both at the highest crime
den-
sity category in the Kingsway buffers and second lowest density
in
the Willingdon buffer.
5. Conclusion
In this study, we explore a new technique for understanding
crime in small places within the urban domain. This mapping
technique utilizes a graph approach that can be applied to major
roadways in urban areas. While this technique is applied to
Fig. 5. Street segment crime density.
Fig. 6. Street profile crime density.
V. Spicer et al. / Applied Geography 69 (2016) 65e74 71
reported crime on a roadway, this method would also be useful
in
other types of analysis pertaining to roadways such as traffic
analysis.
In this study, Kingsway is a major pathway for vehicles, a light-
rail mass transit system (Skytrain) line that runs parallel, a bike
path that also runs parallel, and pedestrians who attend the area
108. for
business, shopping and entertainment. The study area contains
very prominent activity nodes such as the Skytrain station and
the
Table 1
Percentage crime by year.
2003 2004 2005
Crime counts 6524 8465 9526
Increase rate (%) e 29.8% 13.7%
Fig. 7. Street profile: night and day comparison.
Fig. 8. Street profile: crime type comparison.
V. Spicer et al. / Applied Geography 69 (2016) 65e7472
largest shopping mall in British Columbia. There are interesting
temporal variations that are revealed using this technique that
allow practitioners and policy makers to better understand the
crime dynamics of major roadways.
This graph approach utilized to display major roadways allows
for numerous comparisons that can help further understand the
dynamics of these places. In particular, this visualization is
easy to
interpret, making it a good tool for describing crime problems
to
policy makers and civic personnel. The most common spatial vi-
sualizations are displayed on maps such as kernel density and
aggregate address counts and these are not as visually simple as
the
street profile. Comparative analyses using maps requires
109. multiple
maps, whereas the street profile technique allows for
comparisons
on a single graph. Moreover, because of their calculations, these
other methods are prone to false inferences regarding the
location
they represent, particularly kernel density. However, the street
profile method handles temporal and longitudinal analysis very
well and can help expose the growing nature of a crime
generator.
Analyzing major roadways is a means to better understand
crime distribution and, thus, allocate resources. In certain in-
stances, major roadways can be densely distributed crime areas
where crime does not bleed significantly past these areas. This
ef-
fect is shown when looking at the transecting streets. In this
study,
the streets that cross Kingsway do not experience the same
crime
surge as there is along Kingsway. Enforcement would likely be
more effective if it mimicked this crime pattern with
concentrated
enforcement along the roadway and targeted crime prevention
Fig. 9. Line-transect: density buffer analysis.
V. Spicer et al. / Applied Geography 69 (2016) 65e74 73
with the businesses and multi-dwelling residences in that area.
Future research into this visualization technique will utilize
data
from other major cities in order to further define the dynamics
that
110. form these places. The street profile method will be used to
look at
and compare different values. In this study, only crime is used
to
form the street profile. However, future research will compare
crime to other civic data such as transportation and pedestrian
traffic flow. This will allow for a more comprehensive under-
standing of crime in the urban domain.
References
Bailey, T. C., & Gatrell, A. C. (1995). Interactive …
RESEARCH ARTICLE
GIS supporting intelligence-led policing
Tegan Herchenradera* and Steven Myhill-Jonesb
aLatitude Geographics, Kitchener, Canada; bLatitude
Geographics, Victoria, Canada
Tightening budgets and increased demand for public
accountability has placed
additional stress on already limited police department resources.
Web-based crime
mapping provides significant improvement over previous
methods of information
dissemination, allowing police departments to continue to work
quickly and effi-
ciently within these limitations. This modern technology has
enabled a more proac-
tive approach to policing, including intelligence led-policing
and public facing crime
maps. As such, officers are now able to better consider spatial
111. patterns related to
historic crime, and determine more informedly where crimes
may occur in the future,
and allocate their limited resources accordingly.
Keywords: intelligence-led policing; transparency; GIS; web-
based mapping;
ArcGIS®; Geocortex®
Introduction
In an information-driven society, police departments are under
increasing pressure to
run an intelligence-led police model. This model asserts that
police can spend less time
reactively responding to crime if supported by a system that
provides data analysis and
crime intelligence, allowing officers to reduce, disrupt, and
prevent crime (Ratcliffe,
2008, n.d.). Alongside this drive for information is the ongoing
demand for departments
to provide increased transparency to the media and citizens. The
Waterloo Region Police
Service (WRPS) and the Vancouver Police Department (VPD)
are two Canadian organi-
zations which have taken the use and sharing of information to
the next level through
the implementation of an intelligence-led policing model. As
this paper will explore,
this has been supported, in part, by providing web-based
mapping and basic geographic
data analysis capabilities to an expanded audience of
stakeholders. In addition to
empowering police officers with the information they need to do
their jobs better, this
work has been naturally extended to serve transparency goals by
113. applications with assistance from Latitude Geographics and
their Geocortex® software
technology for ArcGIS® Server.
With mature GIS implementations already in place, web-based
mapping enables
organizations to reach a wider audience and more fully leverage
their investment in GIS
technology by using GIS-publishing platforms like ESRI®’s
ArcGIS® Server and
ArcGIS® Online. These technologies allow organizations to
publish their spatial data
and related information to the web in the form of services and
applications. The services
include base maps which show a basic representation of the
geography, as well as layers
which are a visual representation of discrete types of features,
such as property bound-
aries, building footprints, or census data. Geocortex® helps
organizations build applica-
tions which consume the published services and introduce
various visualization and
analytical tools which can be used by end users.
Key advantages of using a highly configurable commercial off-
the-shelf (COTS)
solution like Geocortex® come from the significant amount of
pre-built and easily con-
figurable functionality that adapts over time as technologies
progress, the regular addi-
tion of new capabilities and options, and the amortization of
development costs across
numerous licensee organizations. Alternatively, much of the
functionality offered by
Geocortex® would need to be developed by in-house developers
or through third-party
114. professional services. For example, the mapping viewer (which
allows a user to view
the maps and layers published through ArcGIS® Server and/or
ArcGIS® Online) and
associated capabilities might typically be developed as custom
code or built using free
templates as a starting point. Properly engineered COTS
solutions can help public safety
organizations deliver applications more quickly and focus on
domain-specific business
problems instead of financing the one-off development of
software applications and
infrastructure that invariably require subsequent ongoing
investment to keep pace with a
rapidly changing technology space.
Following the intelligence-led policing model, WRPS and VPD
emphasized making
high-quality current data available to officers in their patrol
cars to help them be more
proactive and informed in their patrol tactics. The opportunity
to be more forward-looking
in their actions is due to the capacity of empirical data to
complement an officer’s
experience, hunches, and instincts related to geographic
attention and pattern recognition.
The applications currently show officers information on crime
occurrences across
their district for specified time periods. As the applications
evolve over time, the plan is to
add other types of information to the maps, such as lists of
known sex offenders or
individuals on parole (Herchenrader, personal communication,
13 August 2013; 6
September 2013).
115. Fulfilling the initial objectives for increased public
transparency has been met
through development of public websites that display generalized
occurrence information
suitable for public consumption and the protection of privacy.
Citizens are able to visu-
alize crimes across a general area as well as in defined locations
(e.g. their neighbor-
hood or child’s school).
The goal of this study is to examine the usefulness of web-based
GIS and mapping
applications in a police setting using two real-world
Geocortex®-based implementations
as case studies. To do so, we will outline how each of the
respective police services dis-
seminated information to their officers and to the public prior to
the implementation of
the Geocortex® solution, what issues both VPD and WRPS
experienced with these
methods, what the Geocortex® solution entailed, what the
challenges were with
Police Practice and Research: An International Journal 137
implementing the solution, how the VPD and WRPS plan on
developing the application
in the future, and what the feedback has been from both officers
and the public.
Waterloo regional police service
The problem
116. Prior to their Geocortex® implementation, the WRPS informed
their officers going out
for patrol through two methods: paper briefings and internal
message boards. To inform
the public about crimes in their neighborhood or in the region in
general, the Service
posted maps rendered in static PDF format of the jurisdiction on
their website. These
methods of supplying information to officers and the public had
enduring drawbacks
that warranted attention.
The internal electronic message board available to officers
allowed them to post
information regarding an incident that occurred during their
patrol. A limitation to this
method was the time required for the officer to sit down and
write a post. Given various
time constraints, their availability to do so was at worst
minimal and at best variable.
Posting to the board was not mandatory and it was up to officers
to make time to write
about incidents. As such, the method could not be relied upon to
be kept up to date on
a consistent basis. Though any entry was helpful, by its nature,
it was an incomplete
data source that offered limited potential for consistent use or
meaningful pattern recog-
nition. Another limitation of this method was that there was no
way to search the board
for particular items. Officers gathered information by scrolling
through posts. As such,
it was easy for officers to miss information or be unaware of it
altogether. Paper brief-
ings, created by the Service’s crime analyst, occurred at the
beginning of each shift.
117. Briefings could be missed for a variety of reasons, such as
illness or rushing out due to
a call (Herchenrader, personal communication, 13 August
2013).
Given that the information provided in the briefing was not
available afterwards, the
Service was experiencing an inefficient use of already time-
constrained resources. First,
the Service’s crime analysts were regularly being asked routine
questions, thus taking
their time away from other important tasks. Second, during an
officer’s downtime on
patrol, they were more likely to place themselves in a location
that was ‘convenient and
safe’ (Herchenrader, personal communication, 13 August 2013),
meaning they would go
somewhere which their previous experience informed them
would be a likely place for
problems to occur. Readily available and up-to-date information
could more accurately
and precisely inform an officer so they could locate themselves
at a particular block or
building, or at a new and previously unknown location where
crime would be more pos-
sible to occur.
To inform the public about incidents in the region, static maps
of the region were
made available on the Service’s website. While these maps
provided a wealth of infor-
mation at a defined map scale, this became a drawback in
coming to any useful conclu-
sions. There were many different symbols on the map indicating
different types of
crime and due to the inability to zoom into the map, it was
118. difficult for the user to get a
proper understanding of what was going on in any particular
area.
The solution
In the move towards an intelligence-led policing model, as well
as to provide insight
and transparency to the public, the WRPS decided that a third-
party GIS solution, which
138 T. Herchenrader and S. Myhill-Jones
offered a dynamic, user-adjustable map populated with current
information, was the
answer. They sought to deliver this through an offering of
several interactive mapping
applications, with appropriate data, visualization, and analysis
tools for each intended
audience. Spatially visualizing and highlighting specific crime
data types makes it easier
for officers to observe and draw correlations between
occurrences. Over time, this also
helps officers better identify and track crime as it increases or
decreases and shifts or
maintains its location (Gotway & Schabenberger, 2009).
Analysis can also be extended
beyond the proximity of the crimes. Geospatial data can also
allow officers to take into
account variables such as neighborhood type, street
accessibility, type of property
(Malleson, 2011) as well as various other factors that relate to
the ‘multidimensional,
multifaceted crime problem’ (Rich, 1995). Being enabled to