The document discusses research on growth and fixed mindsets, emphasizing how beliefs about intelligence affect motivation and achievement in students. It highlights the importance of fostering a growth mindset through appropriate praise and educational strategies to improve student engagement and resilience in the face of challenges. The findings suggest that students with growth mindsets are more likely to embrace difficulties and work hard, ultimately leading to better academic outcomes.


![[Modern ideas on children]. Paris: Flamarion.
Blackwell, L., Trzesniewski, K., & Dweck, C.S. (2007). Implicit
Theories of Intelligence Predict Achievement Across an
Adolescent Transition: A Longitudinal Study and an
Intervention. Child Development, 78, 246–263.
Cimpian, A., Arce, H., Markman, E.M., & Dweck, C.S. (2007).
Subtle linguistic cues impact children's motivation.
Psychological Science, 18, 314-316.
Dweck, C.S. (2006). Mindset. New York: Random House.
Ericsson, K.A., Charness, N., Feltovich, P.J., & Hoffman, R.R.
(Eds.) (2006). The Cambridge Handbook of Expertise and
Expert Performance. New York: Cambridge University Press.
Good, C. Aronson, J., & Inzlicht, M. (2003). Improving
adolescents' standardized test performance: An Intervention to
reduce the effects of stereotype threat. Journal of Applied
Developmental Psychology, 24, 645-662.
Hong, Y.Y., Chiu, C., Dweck, C.S., Lin, D., & Wan, W. (1999)
Implicit theories, attributions, and coping: A meaning system
approach. Journal of Personality and Social Psychology, 77,
588–599.
Kamins, M., & Dweck, C.S. (1999). Person vs. process praise
and criticism: Implications for contingent self-worth and
coping. Developmental Psychology, 35,835–847.
Mangels, J. A., Butterfield, B., Lamb, J., Good, C.D., & Dweck,
C.S. (2006). Why do beliefs about intelligence influence
learning success? A social-cognitive-neuroscience model.
Social, Cognitive, and Affective Neuroscience, 1, 75–86.](https://image.slidesharecdn.com/nsg3036w2projectresearchtemplatenamecitebotharticlesr-221201203607-4eaf20c2/75/NSG3036-W2-ProjectResearch-Template-NameCite-both-articles-r-docx-12-2048.jpg)
![Dr. Melanie T. Turk, Duquesne University School
of Nursing, 518 Fisher Hall, 600 Forbes Avenue,
Pittsburgh, PA 15282. E-mail: [email protected]
Accepted: July 19, 2014
doi: 10.1111/jnu.12105
Abstract
Purpose: African immigrants are one of the fastest growing
immigrant groups
to the United States; there is a crucial need to learn about
African immigrants’
beliefs and lifestyle behaviors that may impact health. The
purposes of this
study were to (a) explore the perceptions and practices of
Nigerian immigrants
regarding healthy eating and physical activity in the United
States; (b) assess
the influence of cultural beliefs of Nigerian immigrants on
eating and physical
activity; (c) describe the role that healthcare providers can play
in helping to
promote healthy eating and physical activity; and (d) evaluate
the feasibility
and efficacy of using Photovoice to collect data on the
perceptions and practices
of Nigerian immigrants regarding healthy eating and physical
activity.
Design: Qualitative visual ethnography using Photovoice.
Methods: Thirteen Nigerian immigrants were recruited. Data
were col-
lected using photography and focus group discussions at a
church. Photovoice](https://image.slidesharecdn.com/nsg3036w2projectresearchtemplatenamecitebotharticlesr-221201203607-4eaf20c2/75/NSG3036-W2-ProjectResearch-Template-NameCite-both-articles-r-docx-14-2048.jpg)


![Moderation is healthy is the first theme that
emerged. This theme encompasses the idea that eating
and activity behaviors should not be done to excess in or-
der to remain healthy. Several participants spoke about
the importance of controlling portion sizes. One woman
stated, “I mean, it’s all about portion. I remember my
mom, when she was alive, she was a nurse, and in the
house we could have a small bowl, and no matter what
you want to eat, it has to fit into that bowl.” Another
woman conveyed that while portion size is important,
the taste of foods is important as well; she stated, “Pro-
portion is everything. I’m not going to finish a whole
bowl [of rice]. I’m just going to take a bit. But at the
same time, I’m not going to not eat doughnuts if I feel like
eating doughnuts.” For her, eating foods like doughnuts
could still be seen as healthy if the food was consumed in
moderation. An excessive amount of watching television
and sitting was identified as unhealthy by the statements,
“. . . for unhealthy activity, TV, too much TV,” and “sitting
and studying is unhealthy activity . . . I’m sitting down.”
Another aspect of the moderation is healthy theme re-
ferred to the timing of meals. Eating too late at night
or eating foods that were considered “heavy” late in
the evening was considered unhealthy. This notion was
demonstrated by one woman’s statement, “I know with
our own food too, the time of the day, you can’t eat
pounded yam at 9:00 p.m., and go to bed . . . you’re not
doing anything. It’s just going to sit in there.” Another
woman reinforced this idea with the comment, “We eat
the solid food in the afternoon; we don’t eat solid food at
night.” Eating heavier foods during the day and not eat-
ing at night was consistent with healthier eating habits.
Nigerian ways of living are healthy theme referred](https://image.slidesharecdn.com/nsg3036w2projectresearchtemplatenamecitebotharticlesr-221201203607-4eaf20c2/75/NSG3036-W2-ProjectResearch-Template-NameCite-both-articles-r-docx-25-2048.jpg)
![. . . training that would not only teach how to make
meals, but also teach how to get it healthy.
Participants talked about wanting educational activities
within their community setting. “If you can suggest ac-
tivities that we can do, and if you could give us some sug-
gestions of healthy activities we can use for our [women’s
group] meetings. . . .” Others wanted to explore the pos-
sibility of including a gym in the church hall. “What I
was thinking, was like if you can get like a gym here that
would be a way of encouraging people to do the physical
activity. For us, we can’t go to the gym for free.” Par-
ticipants also thought that nurses and other healthcare
providers “should encourage people to do more cooking
at home instead of going to the restaurants.”
Discussion
Never before utilized with Nigerian immigrants, Pho-
tovoice was a valuable method to explore the beliefs,
perceptions, and practices of these participants regard-
ing healthy eating and physical activity behaviors while
living in the US. This methodology was well received
and easily used by the Nigerians in this study. At the
conclusion of the study, we talked with the participants
about their experiences using the digital camera to cap-
ture their perceptions of unhealthy and healthy lifestyle
behaviors since immigration to the US. All participants
expressed that the camera was easy to use, and that they
enjoyed taking photos and discussing their ideas. The
photo-elicited discussions were rich with descriptions of
healthy and unhealthy Nigerian and American foods and
adaptations that could be applied to improve the health-
iness of certain foods. The facilitated group dialogue cov-
ering each participant’s photos ensured that everyone’s
voice was heard, and a diverse range of perspectives](https://image.slidesharecdn.com/nsg3036w2projectresearchtemplatenamecitebotharticlesr-221201203607-4eaf20c2/75/NSG3036-W2-ProjectResearch-Template-NameCite-both-articles-r-docx-32-2048.jpg)
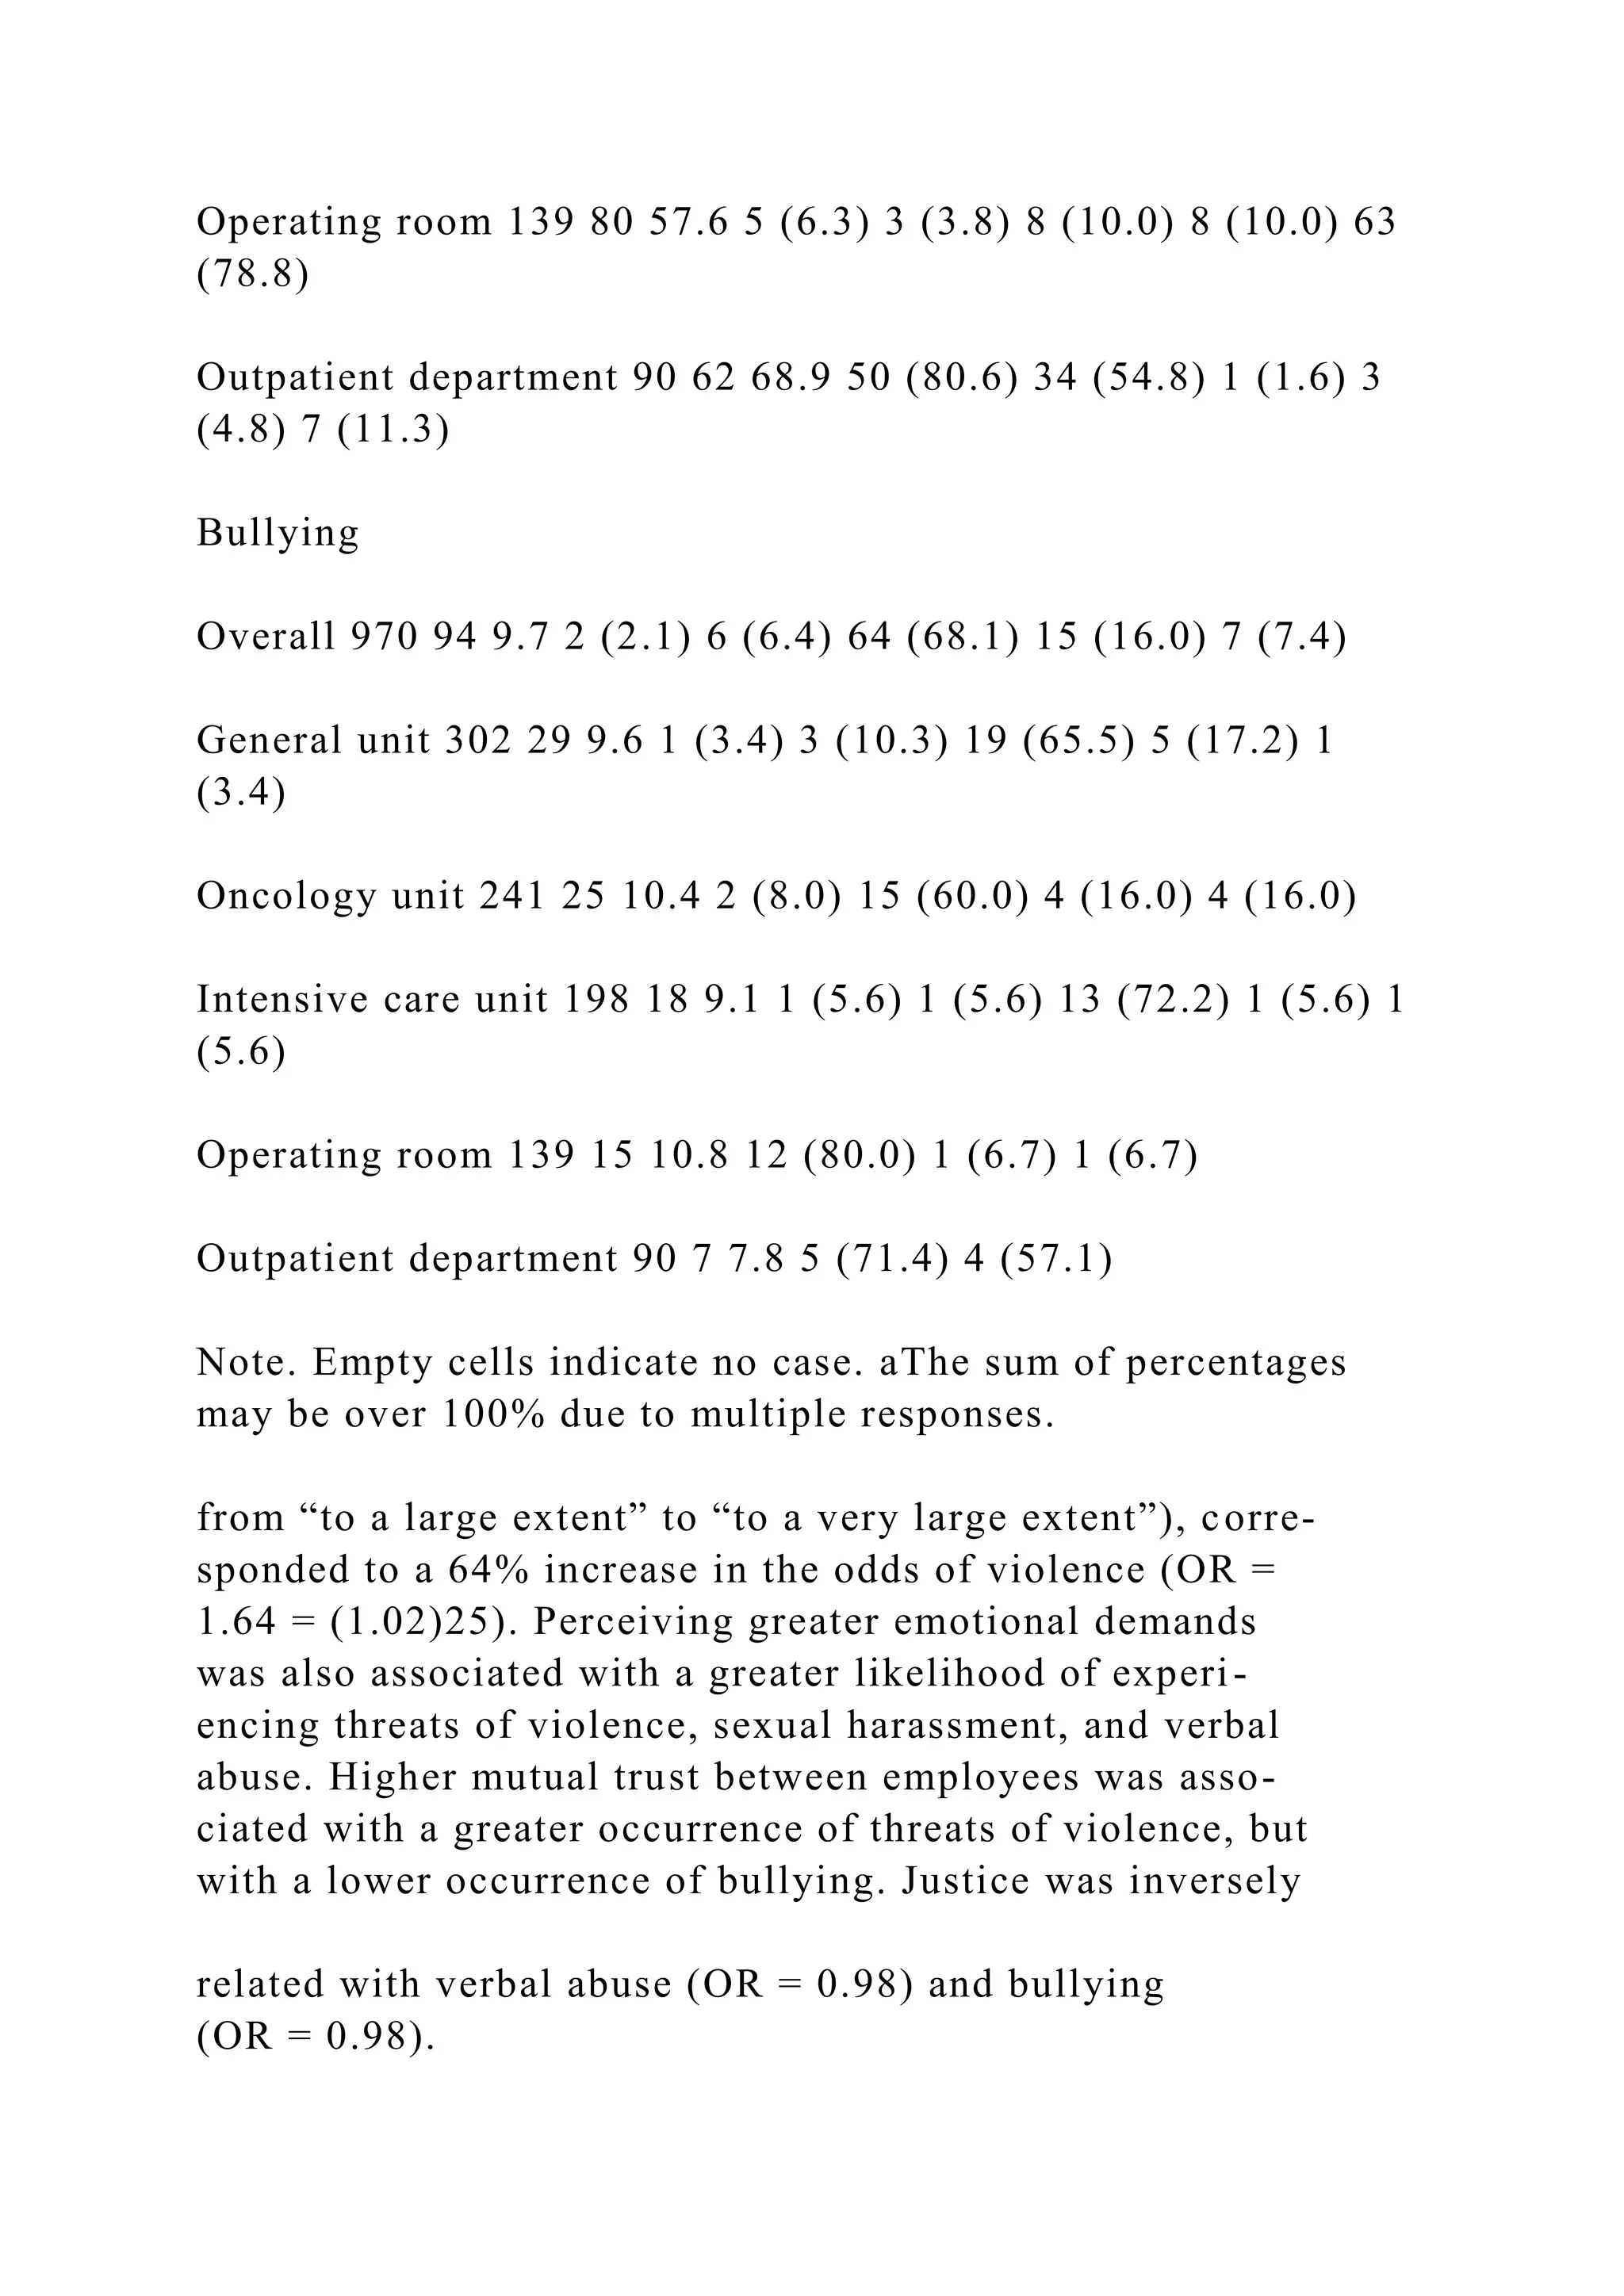
![trust, justice, Korea, Copenhagen Psychosocial
Questionnaire II
Correspondence
Sung-Hyun Cho, College of Nursing, Research
Institute of Nursing Science, Seoul National
University, 101 Daehak-ro, Jongno-gu, Seoul
110–799, South Korea.
E-mail: [email protected]
Accepted: September 13, 2014
doi: 10.1111/jnu.12112
Abstract
Aims: To identify the prevalence and perpetrators of workplace
violence
against nurses and to examine the relationship of work demands
and trust
and justice in the workplace with the occurrence of violence.
Design: This study employed cross-sectional data from a 2013
nurse survey
conducted at a university hospital in Seoul, South Korea. The
study sample
included 970 female nurses from 47 nursing units, including
general, oncol-
ogy, intensive care units (ICUs), operating rooms, and
outpatient departments.
Methods: The second version of the medium-sized Copenhagen
Psychosocial](https://image.slidesharecdn.com/nsg3036w2projectresearchtemplatenamecitebotharticlesr-221201203607-4eaf20c2/75/NSG3036-W2-ProjectResearch-Template-NameCite-both-articles-r-docx-34-2048.jpg)
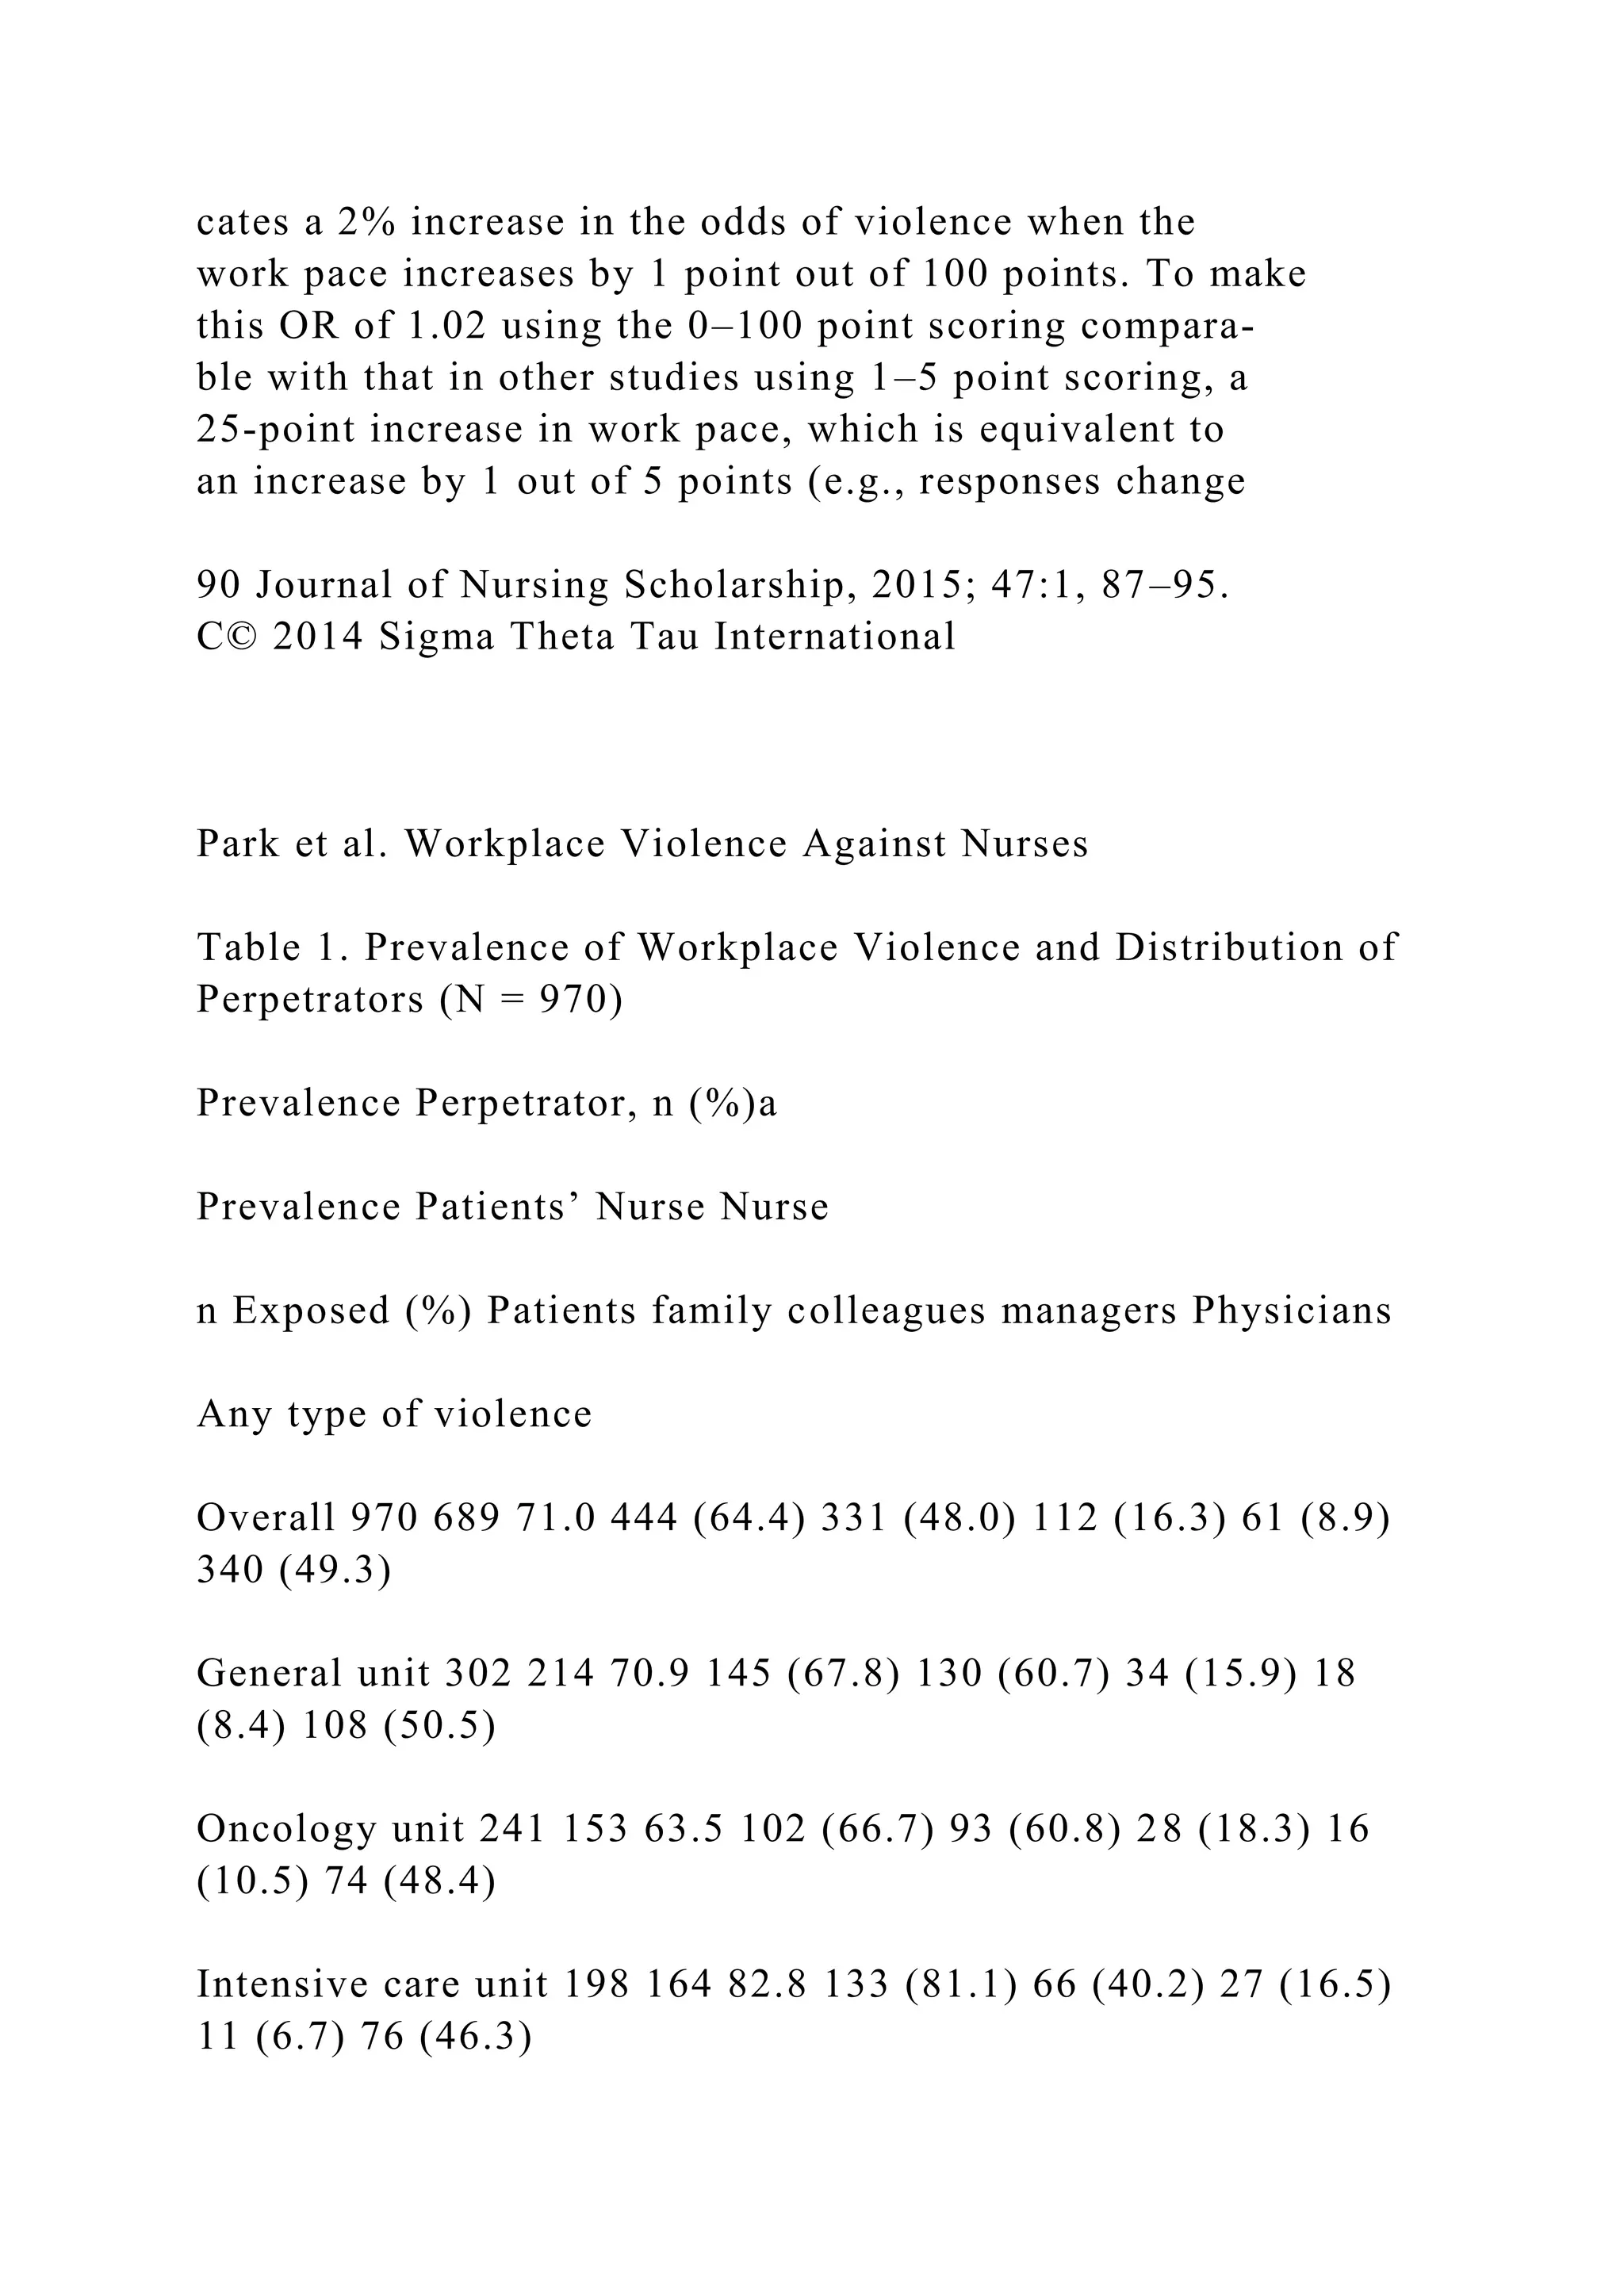

![Table 3 presents the relationships of nurse charac-
teristics, work demands, and workplace values to the
type of perpetrator. When the type of nursing unit was
controlled for, nurses holding a baccalaureate or higher
degree were more likely to experience violence by physi-
cians than were those with a diploma in nursing. Those
Journal of Nursing Scholarship, 2015; 47:1, 87–95. 91
C© 2014 Sigma Theta Tau International
Workplace Violence Against Nurses Park et al.
Table 2. Relationships of Work Demands and Workplace Values
to Violence by Type of Violence: Odds Ratio [95% Confidence
Interval]
Physical violence Threats of violence Sexual harassment Verbal
abuse Bullying
Single (vs. married) 0.84 [0.49, 1.43] 0.92 [0.59, 1.45] 1.28
[0.77, 2.13] 1.09 [0.71, 1.67] 0.69 [0.37, 1.29]
Diploma (vs. BSN or higher) 0.93 [0.60, 1.44] 0.75 [0.52, 1.09]
0.96 [0.63, 1.44] 0.74 [0.52, 1.05] 0.71 [0.39, 1.29]
Years worked as an RN (vs. <3)
3–5 1.37 [0.87, 2.16] 1.82 [1.23, 2.70]∗ ∗ 1.19 [0.77, 1.85] 0.93
[0.63, 1.36] 0.79 [0.43, 1.46]
�6 1.53 [0.88, 2.67] 2.03 [1.27, 3.26]∗ ∗ 1.60 [0.96, 2.68] 1.01
[0.65, 1.58] 1.32 [0.68, 2.56]
Work demands](https://image.slidesharecdn.com/nsg3036w2projectresearchtemplatenamecitebotharticlesr-221201203607-4eaf20c2/75/NSG3036-W2-ProjectResearch-Template-NameCite-both-articles-r-docx-50-2048.jpg)
![Quantitative demands 1.01 [0.99, 1.02] 1.00 [0.99, 1.01] 1.00
[0.99, 1.01] 1.00 [0.99, 1.01] 1.02 [0.998, 1.04]
Work pace 1.02 [1.01, 1.04]∗ ∗ 1.02 [1.01, 1.03]∗ ∗ 1.01 [0.99,
1.02] 1.02 [1.01, 1.03]∗ ∗ 1.00 [0.98, 1.02]
Emotional demands 1.01 [0.99, 1.03] 1.02 [1.00, 1.03]∗ 1.02
[1.01, 1.04]∗ ∗ 1.03 [1.01, 1.04]∗ ∗ ∗ 1.01 [0.99, 1.03]
Workplace values
Trust regarding management 1.02 [0.995, 1.04] 0.99 [0.97, 1.01]
1.02 [0.997, 1.04] 1.00 [0.98, 1.01] 1.01 [0.99, 1.04]
Mutual trust between employees 0.99 [0.98, 1.01] 1.02 [1.00,
1.03]∗ 0.99 [0.97, 1.00] 1.01 [0.999, 1.02] 0.96 [0.94,
0.98]∗ ∗ ∗
Justice 0.99 [0.97, 1.00] 0.99 [0.97, 1.00] 0.99 [0.98, 1.01] 0.98
[0.97, 0.99]∗ ∗ 0.98 [0.96, 0.99]∗
Note. ∗ p < .05, ∗ ∗ p < .01, ∗ ∗ ∗ p < .001. Effects of the type
of nursing unit were controlled for in the multiple regression
analyses.
Table 3. Relationships of Work Demands and Workplace Values
to Violence by Type of Perpetrator: Odds Ratio [95%
Confidence Interval]
Patients Patients’ family Nurse colleagues Nurse managers
Physicians
Single (vs. married) 0.77 [0.46, 1.27] 0.95 [0.60, 1.52] 0.77
[0.39, 1.51] 0.81 [0.35, 1.84] 0.96 [0.60, 1.53]
Diploma (vs. BSN or higher) 0.98 [0.66, 1.46] 1.01 [0.70, 1.46]](https://image.slidesharecdn.com/nsg3036w2projectresearchtemplatenamecitebotharticlesr-221201203607-4eaf20c2/75/NSG3036-W2-ProjectResearch-Template-NameCite-both-articles-r-docx-51-2048.jpg)
![0.62 [0.36, 1.07] 0.77 [0.37, 1.61] 0.62 [0.43, 0.91]∗
Years worked as an RN (vs. <3)
3–5 1.36 [0.89, 2.07] 1.15 [0.78, 1.70] 0.57 [0.34, 0.96]∗ 0.78
[0.37, 1.66] 1.64 [1.11, 2.44]∗
�6 1.19 [0.71, 1.98] 1.44 [0.90, 2.31] 0.41 [0.21, 0.81]∗ 0.80
[0.33, 1.93] 1.65 [1.02, 2.66]∗
Work demands
Quantitative demands 1.00 [0.99, 1.02] 1.01 [0.99, 1.02] 1.01
[0.99, 1.03] 1.03 [1.00, 1.05]∗ 1.01 [0.99, 1.02]
Work pace 1.02 [1.00, 1.03]∗ 1.01 [0.99, 1.02] 0.99 [0.98,
1.01] 0.98 [0.96, 1.01] 1.01 [0.99, 1.02]
Emotional demands 1.02 [1.00, 1.03]∗ 1.03 [1.01, 1.04]∗ ∗ ∗
1.03 [1.01, 1.04]∗ ∗ 1.01 [0.99, 1.04] 1.03 [1.01, 1.04]∗ ∗ ∗
Workplace values
Trust regarding management 1.01 [0.99, 1.02] 0.99 [0.98, 1.01]
1.02 [0.997, 1.04] 0.97 [0.94, 1.00] 0.99 [0.98, 1.01]
Mutual trust between employees 1.01 [0.99, 1.02] 1.01 [0.99,
1.03] 0.98 [0.96, 0.99]∗ 0.99 [0.96, 1.01] 1.01 [0.99, 1.02]
Justice 0.98 [0.97, 0.99]∗ 0.99 [0.98, 1.01] 0.97 [0.95, 0.99]∗ ∗
0.98 [0.95, 1.01] 0.98 [0.97, 0.99]∗
Note. ∗ p < .05, ∗ ∗ p < .01, ∗ ∗ ∗ p < .001. Effects of the type
of nursing unit were controlled for in the multiple regression
analyses.
with 3 or more years of experience as an RN were less
likely to experience violence by nurse colleagues, but
more likely to by physicians than were nurses with less](https://image.slidesharecdn.com/nsg3036w2projectresearchtemplatenamecitebotharticlesr-221201203607-4eaf20c2/75/NSG3036-W2-ProjectResearch-Template-NameCite-both-articles-r-docx-52-2048.jpg)