
Recommended
More Related Content
What's hot
What's hot (20)
Similar to $SPGI Stock Pitch - Aashish Chaturvedi at University of Chicago Booth School of Business
Similar to $SPGI Stock Pitch - Aashish Chaturvedi at University of Chicago Booth School of Business (20)
Recently uploaded
Recently uploaded (20)
$SPGI Stock Pitch - Aashish Chaturvedi at University of Chicago Booth School of Business
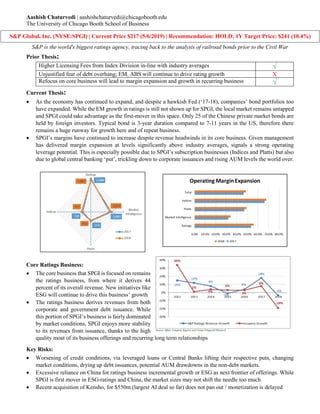
- 1. Aashish Chaturvedi | aashishchaturvedi@chicagobooth.edu The University of Chicago Booth School of Business S&P is the world's biggest ratings agency, tracing back to the analysis of railroad bonds prior to the Civil War Prior Thesis: Higher Licensing Fees from Index Division in-line with industry averages √ Unjustified fear of debt overhang; EM, ABS will continue to drive rating growth X Refocus on core business will lead to margin expansion and growth in recurring business √ Current Thesis: • As the economy has continued to expand, and despite a hawkish Fed (‘17-18), companies’ bond portfolios too have expanded. While the EM growth in ratings is still not shown up for SPGI, the local market remains untapped and SPGI could take advantage as the first-mover in this space. Only 25 of the Chinese private market bonds are held by foreign investors. Typical bond is 3-year duration compared to 7-11 years in the US, therefore there remains a huge runway for growth here and of repeat business. • SPGI’s margins have continued to increase despite revenue headwinds in its core business. Given management has delivered margin expansion at levels significantly above industry averages, signals a strong operating leverage potential. This is especially possible due to SPGI’s subscription businesses (Indices and Platts) but also due to global central banking ‘put’, trickling down to corporate issuances and rising AUM levels the world over. Core Ratings Business: • The core business that SPGI is focused on remains the ratings business, from where it derives 44 percent of its overall revenue. New initiatives like ESG will continue to drive this business’ growth • The ratings business derives revenues from both corporate and government debt issuance. While this portion of SPGI’s business is fairly dominated by market conditions, SPGI enjoys more stability to its revenues from issuance, thanks to the high quality moat of its business offerings and recurring long term relationships Key Risks: • Worsening of credit conditions, via leveraged loans or Central Banks lifting their respective puts, changing market conditions, drying up debt issuances, potential AUM drawdowns in the non-debt markets. • Excessive reliance on China for ratings business incremental growth or ESG as next frontier of offerings. While SPGI is first mover in ESG-ratings and China, the market sizes may not shift the needle too much. • Recent acquisition of Kensho, for $550m (largest AI deal so far) does not pan out / monetization is delayed S&P Global, Inc. (NYSE:SPGI) | Current Price $217 (5/6/2019) | Recommendation: HOLD; 1Y Target Price: $241 (10.4%)
- 2. Aashish Chaturvedi | aashishchaturvedi@chicagobooth.edu The University of Chicago Booth School of Business Valuation: • SOTP valuation was performed to attribute different multiples to different business groupings (Ratings 27x; Market Intell. 25x; Platts 20x; Indices 20x), in line with their respective comparables and stage of business within the company. Using a weighted average multiple of 25.6x implies 1 year target share price of $241, giving a 10.4% upside. And a 5-year target share price of $287, giving a 31.6% upside. • SPGI is trading at fair value, especially when compared to its historical range, however when compared to the market and its peers, SPGI remains undervalued and a decent way to enjoy upside in the financial technology space. • Premium to Self: o SPGI trades at a premium to its historic valuations across all valuation multiples, but not vs. the market. • Discount to Peers: o SPGI trades at a discount to its peers and industry averages across most valuation multiples. • Base Model: Current vs 5Yr Average Historical Multiple Implied @ Hist Avg Metric Current(x) Hist Avg(x) Diff(%) # SD Price(USD) BF P/E 23.43 21.06 11.24 1.50 197.43 BF EV/EBITD 17.30 13.26 30.50 2.20 163.99 BF EV/EBIT 18.00 13.87 29.79 2.20 164.98 BF EV/Rev 8.77 6.03 45.56 2.00 145.12 LF P/BV 139.35 58.53 138.08 2.60 92.24 Pro Forma Income Statement 2014A 2015A 2016A 2017A 2018A 2019E 5/7/2020 2020E 2021E 2022E 2023E Total Revenue 5,051 5,313 5,661 6,063 6,258 6,534 6,743 6,952 7,409 7,612 7,990 Growth YoY 5.2% 6.5% 7.1% 3.2% 4.4% 3.2% 6.4% 6.6% 2.7% 5.0% Operating Profit 1,808 2,053 2,289 2,751 2,961 2,851 2,990 3,128 3,334 3,425 3,596 Operating Margin 35.8% 38.6% 40.4% 45.4% 47.3% 43.6% 44.3% 45.0% 45.0% 45.0% 45.0% EBITDA 1,942 2,210 2,470 2,931 3,167 3,294 3,416 3,539 3,757 3,985 4,215 EBITDA Margin 38.4% 41.6% 43.6% 48.3% 50.6% 50.4% 50.7% 50.9% 50.7% 52.4% 52.8% Interest, Tax, Other (2,057) (1,054) (364) (1,435) (1,209) (1,077) (1,104) (1,131) (1,110) (1,278) (1,345) Net Income (115) 1,156 2,106 1,496 1,958 2,217 2,313 2,408 2,647 2,707 2,870 Net Income Margin 24.7% 31.3% 33.9% 34.3% 34.6% 35.7% 35.6% 35.9% Growth YoY 82.2% -29.0% 30.9% 13.2% 4.3% 8.6% 9.9% 2.3% 6.0% Diluted EPS 4.21 7.94 6.23 8.19 9.05 9.39 9.73 10.74 10.64 11.19 Growth YoY 88.6% -21.6% 31.5% 10.5% 3.8% 7.5% 10.3% -0.9% 5.2% Weighted PE Multiple 25.6x 25.6x 25.6x 25.6x 25.6x 25.6x SOTP Implied Share Price (Base Case) 217.88$ 231.83$ 240.58$ 249.32$ 275.11$ 272.55$ 286.76$ Implied Return (Base Case) 6.4% 10.4% 14.4% 26.3% 25.1% 31.6% Ticker P/E EV/ EBITDA EV/Rev Mean Comps 33.86 22.15 7.93 U.S Fin Tech Index 36.80 SPGI US 23.43 17.30 8.77 MSCI US 35.05 24.57 13.48 INFO US 21.14 15.40 6.16 VRSK US 31.31 20.82 9.96 FICO US 35.84 24.29 7.48 FDS US 27.79 21.52 7.52 TRU US 24.44 15.42 6.13 TRI CN 45.09 19.96 5.24 EXPN LN 25.78 16.60 5.72 MKTX US 54.49 37.83 21.03 IRE AU 27.94 18.57 5.29 Discount to Comps P/E EV/EBITDA EV/EBIT EV/Rev -30.8% -21.9% -27.4% 10.6% S&P Global, Inc. (NYSE:SPGI) | Current Price $217 (5/6/2019) | Recommendation: HOLD; 1Y Target Price: $241 (10.4%)