

Recommended
More Related Content
What's hot
What's hot (20)
Similar to Indexed Universal Life Insurance
Similar to Indexed Universal Life Insurance (20)
Recently uploaded
Recently uploaded (20)
Indexed Universal Life Insurance
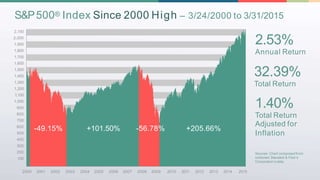
- 1. 32.39% Total Return 1.40% Total Return Adjusted for Inflation Sources: Chart composed from collected Standard & Poor’s Corporation’s data 2,100 2,000 1,900 1,800 1,700 1,600 1,500 1,400 1,300 1,200 1,100 1,000 900 800 700 600 500 400 300 200 100 2000 2001 2002 2003 2004 2005 2006 2007 2008 2009 2010 2011 2012 2013 2014 2015 S&P500® Index Since 2000 High – 3/24/2000 to 3/31/2015 2.53% Annual Return -49.15% +101.50% -56.78% +205.66%
- 2. Upside Potential Safety of Principal Risk of Principal Fixed Products Investment Products < 1%-3% Indexed Products The Tic-Tac-Toeof Financial Products
- 3. Upside Potential Safety of Principal Risk of Principal Fixed Products Investment Products < 1%-3% Indexed Products The Tic-Tac-Toeof Financial Products
- 4. Upside Potential Safety of Principal Risk of Principal Fixed Products Investment Products < 1%-3% Indexed Products The Tic-Tac-Toeof Financial Products 15.00% Cap 0.75% Floor
- 5. How do you avoid losses? 1,700 - 1,600 - 1,500 - 1,400 - 1,300 - 1,200 - 1,100 - 1,000 - 900 - AccountValue 8 9 10 - - - - - - - - - - 990 980 1,078 970 960 1,067 1,058 951 Normal Account 1,100 If the Market went up 10% then down -10% for 10 years 1,089 800 - Year 1 2 3 4 5 6 7 This is a hypothetical scenario for illustration purposes only and does not present an actual investment for any specific product or service. There is no assurance that these results can or will be achieved.
- 6. 1,210 1,210 1,331 1,331 1,464 1,464 1,610 How do you avoid losses? 1,700 - 1,600 - 1,500 - 1,400 - 1,300 - 1,200 - 1,100 - 1,000 - 900 - AccountValue 8 9 10 - - - - - - - - - - 990 980 1,078 970 960 1,067 1,058 951 Normal Account 1,100 If the Market went up 10% then down -10% for 10 years 1,100 1,610 1,089 Account with a Floor 800 - Year 1 2 3 4 5 6 7 This is a hypothetical scenario for illustration purposes only and does not present an actual investment for any specific product or service. There is no assurance that these results can or will be achieved.
- 7. Pay taxes on your penny seeds? • Reduced tax burden • No taxes at retirement • The benefit of tax deductions (home mortgage interest deduction or dependent children deduction) Pay taxes on your harvest? • Greater tax burden • Taxes delayed until retirement • Potential to be in higher tax bracket • Required minimum distributions of retirement savings 1¢ $1MIf you were a farmer, Would you rather pay taxes on your penny seedsor million-dollar harvest?
- 8. Fill in the blank What do qualified plans do?
- 9. What do qualified plans do? They defer the tax! This answer is only half correct.
- 10. What do qualified plans do? They defer the tax and the tax calculation.
- 11. IUL Indexed Universal Life Insurance Insurance Co. Minimum Premium
- 12. IUL Indexed Universal Life Insurance IRS Maximum Allowable Premium Insurance Co. Minimum Premium Makes tax-free income possible!
- 13. Age Current Year Premium AllowedYear Premium Contributed Additional Premium Allowable (example only) 1 35 $40,000 $10,000 $30,000 2 36 $40,000 $10,000 $60,000 3 37 $40,000 $10,000 $90,000 4 38 $40,000 $10,000 $120,000 5 39 $40,000 $10,000 $150,000 6 40 $40,000 $10,000 $180,000 7 41 $40,000 $10,000 $210,000 8 42 $40,000 $10,000 $240,000 9 43 $40,000 $10,000 $270,000 10 44 $40,000 $10,000 $300,000 11 45 $40,000 $10,000 $330,000 12 46 $40,000 $10,000 $360,000 13 47 $40,000 $10,000 $390,000 14 48 $40,000 $10,000 $420,000 15 49 $40,000 $10,000 $450,000 The Best Kept Secret of IUL You can catch up the allowable additional premium
- 14. GLOBAL INDEX ACCOUNT Interest Crediting Method The Company credits Excess Index Interest, if any, to this Index Account using a formula based on changes in the S&P 500® Index,excluding dividends. The index change percentage is then comparedto the Cap. Interest Crediting Method The Company credits Excess Index Interest, if any, to this Index Account based on a weightedaverage of the index change percentages of three indexes, excluding dividends. The weightedindex change percentages are added together and comparedto the Cap. to thepercentage change in the S&P 500®or the EURO STOXX50®, whichever ishigher tothepercentage change inthe S&P 500® or theEURO STOXX50®, whichever islower tothepercentage change in the Hang SengIndex 50% 20% 30% to thepercentage change in the S&P500® 100% S&P 500®INDEX Tracks 500large cap equities in leading industries of the U.S.economy,and is one of the most well-knownmarket benchmarks. EURO STOXX 50® INDEX Comprised of 50large cap stocksfromleading European blue-chip companies. HANG SENGINDEX Has a longhistory beginningin the1960sand is oneof the mostrecognized indicators of the stock market performance in HongKong. S&P 500® INDEX ACCOUNT Toarrive at the weighted index change percentage, we apply the followingfactors:
- 15. The Global Index Account Option will never be credited less than guaranteed minimuminterest rate or “floor” and has the potential tobe credited with Excess Index Interest up tothe current Cap. GLOBAL INDEX ACCOUNT CURRENT CAP GUARANTEED MINIMUM INTEREST RATE 25-YEAR 1989-2014 20-YEAR 1994-2014 15-YEAR 1999-2014 10-YEAR 2004-2014 5-YEAR 2009-2014 1-YEAR 2013-2014 8.01% 7.45% 1.35% 4.65% 7.32% 6.77% 9.35% 9.75% 8.05% 9.60% 8.57% 6.77% HISTORICAL INDEX LOOK-BACK PERIODS The look-back periods are for illustrative purposes only. The IUL policy was not available during all of the time periods shown. The Caps are subject tochange atthe discretion of the Company and will be different over different time periods. A lower or higher Cap would produce different hypothetical results. Further, index changes measured on different dates would produce different hypothetical results. The “Average Weighted Index Change” shows the geometric averages of one-year historical index changes (excluding dividends) ending December 31stfor each year during the time period shown. “Average Weighted Index Change Using Cap & Floor” shows the averages that would have resulted fromapplying the policy’s current Cap and floor tothe index changes for the same time periods. LOOK-BACKPERIOD AVERAGE WEIGHTED INDEXCHANGE AVERAGE WEIGHTED INDEX CHANGE USING CAP &FLOOR 15.00%0.75%
- 16. YEAR INDEXCHANGE INDEXCHANGE INDEXCHANGE INDEXCHANGE USING THE FLOOR& CALENDAR S&P 500® EURO STOXX 50® HANG SENG WEIGHTED WEIGHTED INDEXCHANGE CURRENT 15%CAP 1995 35.20% 15.88% 30.10% 28.39% 15.00% 1996 19.33% 19.52% 29.38% 21.44% 15.00% 1997 31.01% 41.13% -19.11% 26.05% 15.00% 1998 26.67% 37.60% -8.16% 25.17% 15.00% 1999 19.53% 36.86% 77.08% 39.70% 15.00% 2000 -12.66% -3.04% -14.39% -8.20% 0.75% 2001 -10.53% -20.12% -23.67% -16.04% 0.75% 2002 -23.37% -32.84% -17.49% -25.03% 0.75% 2003 26.38% 10.92% 36.69% 23.80% 15.00% 2004 8.99% 6.16% 11.22% 8.59% 8.59% 2005 4.69% 21.69% 4.97% 13.25% 13.25% 2006 11.65% 15.88% 36.59% 18.75% 15.00% 2007 3.65% 3.61% 35.01% 9.91% 9.91% 2008 -38.49% -41.55% -45.42% -40.79% 0.75% 2009 23.45% 18.98% 45.07% 26.43% 15.00% 2010 12.78% -5.91% 7.39% 6.10% 6.10% 2011 1.54% -15.83% -19.45% -7.87% 0.75% 2012 11.68% 13.45% 23.49% 14.92% 14.92% 2013 29.60% 12.86% 0.12% 18.68% 15.00% 2014 11.39% 2.83% 1.14% 6.77% 6.77% 20-YearAverage 7.79% 4.45% 5.66% 7.45% 9.75% 20 YEAR LOOK-BACKOVERVIEW
- 17. Crusades3 How would you arrange the following in order of importance to you? A. Income in Retirement B. Long Term Care C. Death Benefit