GASHA Technical Institute Statistics Module
•
1 like•47 views

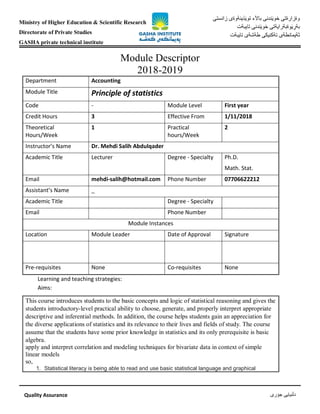
Module descriptor dr. mehdi salih abdulqader

Recommended
More Related Content
What's hot
What's hot (19)
Similar to GASHA Technical Institute Statistics Module
Similar to GASHA Technical Institute Statistics Module (20)
More from gasha technical institute
More from gasha technical institute (20)
Recently uploaded
Recently uploaded (20)
GASHA Technical Institute Statistics Module
- 1. Ministry of Higher Education & Scientific Research Directorate of Private Studies GASHA private technical institute زانستى ذينةوةىَيتو باآلء ندنىَيخو وةزارةتى ندنىَيخو وةبةرايةتىَي ِبةرتايبةت تايبةت طةشةى تةكنيكى ثةيمانطةى Quality Assurance جؤرى نيايىَلد Module Descriptor 2018-2019 Department Accounting Module Title Principle of statistics Code - Module Level First year Credit Hours 3 Effective From 1/11/2018 Theoretical Hours/Week 1 Practical hours/Week 2 Instructor’s Name Dr. Mehdi Salih Abdulqader Academic Title Lecturer Degree - Specialty Ph.D. Math. Stat. Email mehdi-salih@hotmail.com Phone Number 07706622212 Assistant’s Name _ Academic Title Degree - Specialty Email Phone Number Module Instances Location Module Leader Date of Approval Signature Pre-requisites None Co-requisites None Learning and teaching strategies: Aims: This course introduces students to the basic concepts and logic of statistical reasoning and gives the students introductory-level practical ability to choose, generate, and properly interpret appropriate descriptive and inferential methods. In addition, the course helps students gain an appreciation for the diverse applications of statistics and its relevance to their lives and fields of study. The course assume that the students have some prior knowledge in statistics and its only prerequisite is basic algebra. apply and interpret correlation and modeling techniques for bivariate data in context of simple linear models so, 1. Statistical literacy is being able to read and use basic statistical language and graphical
- 2. Ministry of Higher Education & Scientific Research Directorate of Private Studies GASHA private technical institute زانستى ذينةوةىَيتو باآلء ندنىَيخو وةزارةتى ندنىَيخو وةبةرايةتىَي ِبةرتايبةت تايبةت طةشةى تةكنيكى ثةيمانطةى Quality Assurance جؤرى نيايىَلد representations to understand statistical information in the media and in daily life. 2. Statistical reasoning is being able to reason about and connect different statistical concepts and ideas, such as knowing how and why outliers affect statistical measures of center and variability. 3. Statistical thinking is the type of thinking used by statisticians when they encounter a statistical problem. This involves thinking about the nature and quality of the data and, where the data came from, choosing appropriate analyses and models, and interpreting the results in the context of the problem and given the constraints of the data. Learning Outcomes: After successfully completion of the course students should be able to demonstrate: 1. Define statistics and how they lead to better business decisions 2. Analyze different types of data, apply appropriate statistical techniques to organize, summarize and display data in a meaningful way. 3. Compute various measures of center, variation and location of data 4. Apply some basic probability rules 5. Understand the concepts of probability distributions and random variables then apply these concepts to real life situations and evaluate the conclusions 6. Use appropriate probability distribution to estimate and perform a hypothesis testing about parameters of one population 7. estimate and perform hypothesis testing of a mean of a population 8. Perform and interpret a linear correlation and regression to analyze the relationships in bivariate data Contents: A. The meaning statistics and why statistics some concepts and terms of statistics 1. Variables and type of data 2. Types of statistics 3. Data and types of data 4. Level of measures 5. Data collection and sampling techniques B. Frequency Distributions and Graphs 1. Introduction 2. Organizing Data 3. Histograms, and Ogives 4. Other Types of Graphs C. Data Description 1. Measures of central Tendency (Mean, Median and Mode) 2. Measures of Variation ( Range, Variance and Standard Deviation) 3. Measure of Position (Quartiles) 4. Exploratory Data Analysis
- 3. Ministry of Higher Education & Scientific Research Directorate of Private Studies GASHA private technical institute زانستى ذينةوةىَيتو باآلء ندنىَيخو وةزارةتى ندنىَيخو وةبةرايةتىَي ِبةرتايبةت تايبةت طةشةى تةكنيكى ثةيمانطةى Quality Assurance جؤرى نيايىَلد D. Correlation and Regression 1. Scatter Plots 2. Correlation analysis 3. The significance of the correlation Coefficient E. Linear Regression F. Probability and Counting Rules Sample Space and Probability Rules of Probability G. Discrete and continuous Probability distributions H. Normal Distribution and its applications Assessments: The weight (%) of each assessment must be predetermined and the total = 100 Exams two exam one in each semester (30%) and Final (50%) Quizzes Minimum 2/semester or 4/year (5%) Assignments (X) (5%) Presentations (5%) Attendance (5%) Feedbacks Specify the methods to be used with the distribution of marks by percentage (%): exams (mid-term), assignment, quizzes, presentation, participation, attendance, lab assignments, and field trips. 1) Two exam one in each semester each (15%) 2) Quizzes at least four quizzes (5%) 3) Assignments through the academic year (5%) 4) Students will be asked for presentation some material (5%) 5) Attendance (5%) 6) Final Exam (50%) Reading list Divide into required and recommended reading to include : Author, Year, Title, Place of Publication, Publisher Elementary Statistics – A Step by Step Approach, By Allan G. Bluman. McGraw-Hill Publishing Fundamentals of Statistics, By: Michael Sullivan III. Published by Pearson – Prentice Hall Basic Statistics for Business & Economics, by McClave, Benson, & Sincich, published by Prentice Hill. Basic Statistics for Business & Economics, by D. A. Lind, W. G. Marchal, S.A. Wathen, ninth edition, published by Mc-Graw Hill. Websites
- 4. Ministry of Higher Education & Scientific Research Directorate of Private Studies GASHA private technical institute زانستى ذينةوةىَيتو باآلء ندنىَيخو وةزارةتى ندنىَيخو وةبةرايةتىَي ِبةرتايبةت تايبةت طةشةى تةكنيكى ثةيمانطةى Quality Assurance جؤرى نيايىَلد Course time table: Week 1: Theoretical: Orientation Practical: Introduction and knowing data Week 2: Theoretical: The meaning statistics and why statistics some concepts and terms of statistics Practical: Application of the above concepts Week 3: Theoretical: Variables and type of data, Types of statistics , Data and types of data Practical: collecting data Week 4: Theoretical: Level of measures, Data collection and sampling techniques Practical: Week 5: Theoretical: Frequency Distributions and Graphs, Introduction, Organizing Data Practical: Construction of frequency table Week 6: Theoretical: Histograms, and Ogives, and some other types of graphs Practical: Construction of frequency table Week 7: Theoretical: Data Description, measures of central tendency (Mean, Median and Mode) Practical: Construction of frequency table Week 8: Theoretical: Data Description, measures of central tendency (Mean, Median and Mode) Practical: Graphical representation of numerical data Week 9: Theoretical: Measures of Variation ( Range, Variance and Standard Deviation) Practical: Measures of central tendency Week 10: Theoretical: Measures of Variation ( Range, Variance and Standard Deviation) Practical: Measures of central tendency Week 11: Theoretical: Measure of Position (Quartiles) Practical: Measures of central tendency Week 12: Theoretical: Measure of Position (Quartiles) Practical: measures of position Week 13: Theoretical: Exploratory Data Analysis Practical: exploratory data Week 14: Theoretical: Correlation and Regression, Scatter Plots Practical: concepts of correlation between of two variables Week 15: Theoretical: Correlation analysis Practical: Scatter diagram Week 16: Theoretical: The significance of the correlation Coefficient Practical: Examples and Problems Week 17: Theoretical: Linear Regression
- 5. Ministry of Higher Education & Scientific Research Directorate of Private Studies GASHA private technical institute زانستى ذينةوةىَيتو باآلء ندنىَيخو وةزارةتى ندنىَيخو وةبةرايةتىَي ِبةرتايبةت تايبةت طةشةى تةكنيكى ثةيمانطةى Quality Assurance جؤرى نيايىَلد Practical: concepts of regression, fitting of lines of regression Week 18: Theoretical: Coefficient of Determination and Standard Error of the Estimate Practical: Linear regression review, Model assessment, Some practical issues Week 19: Theoretical: Probability, Sample Space and Probability, Rules of Probability Practical: Examples and problems Week 20: Theoretical: Rules of Probability Practical: Examples and problems Week 21: Theoretical: Rules of Probability Practical: Examples and problems Week 22: Theoretical: Discrete Random Variables, and Probability Distribution of Discrete r. v., Mean and Variance of Discrete r. v. Practical: Random experiment, trial, sample point and sample space, events, operations of events, concepts of equally likely, mutually exclusive and exhaustive events. Week 23: Theoretical: Discrete Probability distributions, Binomial distribution Practical: Random variables discrete, probability mass function (pmf) Week 24: Theoretical: Continuous Random Variables 1. Continuous r. v. 2. Probability density functions Practical: Random variables continuous, probability density function (pdf) Week 25: Theoretical: Continuous Random Variables 3. Mean and Variance of continuous r. v. Practical: Random variables continuous, probability density function (pdf) Week 26: Theoretical: Normal Distribution Practical: use of normal distribution table Week 27: Theoretical: Applications of Normal Distribution Practical: Applications of Normal Distribution Week 28: Theoretical: Applications of Normal Distribution Practical: some problems Week 29: Theoretical: Revision and preparing for the final exam Practical: Practical based on analysis of data collected by students Week 30: Theoretical: Revision and preparing for the final exam Practical: Practical based on analysis of data collected by students