
Recommended
Recommended
More Related Content
Similar to Syllabus- Decision Science.docx
Similar to Syllabus- Decision Science.docx (20)
More from DikshaGandhi20
More from DikshaGandhi20 (11)
Recently uploaded
Recently uploaded (20)
Syllabus- Decision Science.docx
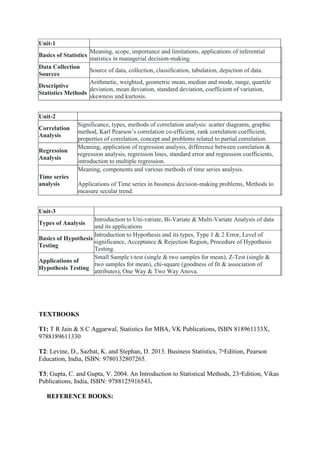
- 1. Unit-1 Basics of Statistics Meaning, scope, importance and limitations, applications of inferential statistics in managerial decision-making. Data Collection Sources Source of data, collection, classification, tabulation, depiction of data. Descriptive Statistics Methods Arithmetic, weighted, geometric mean, median and mode, range, quartile deviation, mean deviation, standard deviation, coefficient of variation, skewness and kurtosis. Unit-2 Correlation Analysis Significance, types, methods of correlation analysis: scatter diagrams, graphic method, Karl Pearson’s correlation co-efficient, rank correlation coefficient, properties of correlation, concept and problems related to partial correlation. Regression Analysis Meaning, application of regression analysis, difference between correlation & regression analysis, regression lines, standard error and regression coefficients, introduction to multiple regression. Time series analysis Meaning, components and various methods of time series analysis. Applications of Time series in business decision-making problems, Methods to measure secular trend. Unit-3 Types of Analysis Introduction to Uni-variate, Bi-Variate & Multi-Variate Analysis of data and its applications Basics of Hypothesis Testing Introduction to Hypothesis and its types, Type 1 & 2 Error, Level of significance, Acceptance & Rejection Region, Procedure of Hypothesis Testing. Applications of Hypothesis Testing Small Sample t-test (single & two samples for mean), Z-Test (single & two samples for mean), chi-square (goodness of fit & association of attributes), One Way & Two Way Anova. TEXTBOOKS T1: T R Jain & S C Aggarwal, Statistics for MBA, VK Publications, ISBN 818961133X, 9788189611330 T2: Levine, D., Sazbat, K. and Stephan, D. 2013. Business Statistics, 7th Edition, Pearson Education, India, ISBN: 9780132807265. T3; Gupta, C. and Gupta, V. 2004. An Introduction to Statistical Methods, 23rd Edition, Vikas Publications, India, ISBN: 9788125916543. REFERENCE BOOKS:
- 2. R1:Croucher, J. 2011. Statistics: Making Business Decisions, 13th Edition, Tata McGraw Hill, ISBN: 9780074710419. R2:Gupta, S. 2011. Statistical Methods, 4th Edition, Sultan Chand & Sons, ISBN: 8180548627. SN Course Code: 22BAT-605 Decision Science L T P S C CH Course Type PC 5 4 0 0 0 4 4 Program Code MB301 PRE-REQUISITE Basic of Mathematics, Algebraic Calculations CO-REQUISITE Data based Decision Making, Reasoning Skills ANTE-REQUISITE None a. Course Objectives 1. The objective of this course is to acquaint the students with various statistical tools and techniques used in business decision making.
- 3. 2. The course aims at providing fundamental knowledge and exposure to the students to use various statistical methods in order to understand, analyze and interpret data for decision making. 3. The course has universal utility in terms of making students future ready for corporate jobs and entrepreneurial ventures. b. Course Outcomes The students will be able: CO1 To understand the various concepts of descriptive and inferential statistics. CO2 To apply the concepts studied in solving academic and industry problems. CO3 To analyze the different situations and develop ability to take a well-informed decision. CO4 To justify the decisions performed with sound reasoning and logical bent of mind. CO5 To develop the forecasting models based on historical data available on a variety of components. c. Syllabus Unit-1 Contact Hours: 20 Basics of Statistics Meaning, scope, importance and limitations, applications of inferential statistics in managerial decision-making. Data Collection Sources Source of data, collection, classification, tabulation, depiction of data. Descriptive Statistics Methods Arithmetic, weighted, geometric mean, median and mode, range, quartile deviation, mean deviation, standard deviation, coefficient of variation, skewness and kurtosis. Unit-2 Contact Hours: 20 Correlation Analysis Significance, types, methods of correlation analysis: scatter diagrams, graphic method, Karl Pearson’s correlation co-efficient, rank correlation coefficient, properties of correlation, concept and problems related to partial correlation. Regression Analysis Meaning, application of regression analysis, difference between correlation & regression analysis, regression lines, standard error and regression coefficients, introduction to multiple regression. Time series analysis Meaning, components and various methods of time series analysis. Applications of Time series in business decision-making problems, Methods to measure secular trend. Unit-3 Contact Hours: 20 Types of Analysis Introduction to Uni-variate, Bi-Variate & Multi-Variate Analysis of data and its applications Basics of Hypothesis Testing Introduction to Hypothesis and its types, Type 1 & 2 Error, Level of significance, Acceptance & Rejection Region, Procedure of Hypothesis Testing. Applications of Hypothesis Testing Small Sample t-test (single & two samples for mean), Z-Test (single & two samples for mean), chi-square (goodness of fit & association of attributes), One Way & Two Way Anova. d. Textbooks / Reference Books TEXTBOOKS
- 4. T1: T R Jain & S C Aggarwal, Statistics for MBA, VK Publications, ISBN 818961133X, 9788189611330 T2: Levine, D., Sazbat, K. and Stephan, D. 2013. Business Statistics, 7th Edition, Pearson Education, India, ISBN: 9780132807265. T3; Gupta, C. and Gupta, V. 2004. An Introduction to Statistical Methods, 23rd Edition, Vikas Publications, India, ISBN: 9788125916543. REFERENCE BOOKS: R1:Croucher, J. 2011. Statistics: Making Business Decisions, 13th Edition, Tata McGraw Hill, ISBN: 9780074710419. R2:Gupta, S. 2011. Statistical Methods, 4th Edition, Sultan Chand & Sons, ISBN: 8180548627. e. Assessment Pattern - Internal and External The performance of students is evaluated as follows: Theory Components Continuous Internal Assessment (CAE) Semester End Examination (SEE) Marks 40 60 Total Marks 100 f. Internal Evaluation S. No. Type of Assessment Weightage of actual conduct Frequency of Task Final Weightage in Internal Assessment Remarks (Graded/Non- Graded) 1 Assignment in form of Case Study/Project based on Data Analytics. 12 marks of each assignment designed with rubrics One Per Unit 6 marks Graded 2 Exam 20 marks for one MST 2 per semester 20 marks Graded 3 Quiz/Test 12 marks for each test One per Unit 4 marks Graded 4 Homework NA One per lecture topic (of 2 questions) Non-Graded: Engagement Task Non graded 5 Discussion Forum NA One per Chapter 4 marks Graded 6 Presentation NA NA NA Non graded 7 Attendance and NA NA 2 marks Graded
- 5. Engagement Score on BB 8 Analysis of Business School 4 marks of each analysis 1 per Unit 4 marks As applicable to course types depicted above g. CO-PO Mapping Course Outcome PO1 PO2 PO3 PO4 PO5 PO6 CO1 1 2 CO2 2 3 CO3 3 3 1 CO4 2 3 2 CO5 2 2 2 CO PO correlation matrix of each subject to be mapped with High correlation (3) Medium correlation (2) Low correlation (1)