WBS is Paramount
•Download as PPTX, PDF•
1 like•422 views

The WBS is the touchstone of all work activities, cost, schedule, and technical performance on the program. It describes technical, process, and programmatic deliverables over the life of the program It describes how these deliverables are related through a well formed tree structure – parents and children – defined by MIL-STD-881C It describes how costs are assigned to this work and these costs roll up to their parents in Control Account and CLINS to the Performance Measurement Baseline (PMB)

Recommended
Recommended
More Related Content
What's hot
What's hot (20)
Similar to WBS is Paramount
Similar to WBS is Paramount (20)
More from Glen Alleman
More from Glen Alleman (20)
Recently uploaded
Recently uploaded (20)
WBS is Paramount
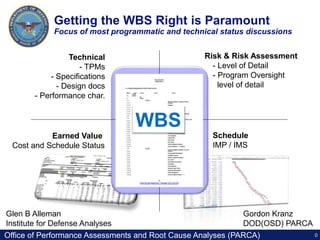
- 1. 0Office of Performance Assessments and Root Cause Analyses (PARCA) Risk & Risk Assessment - Level of Detail - Program Oversight level of detail Technical - TPMs - Specifications - Design docs - Performance char. Earned Value Cost and Schedule Status WBS Schedule IMP / IMS Getting the WBS Right is Paramount Focus of most programmatic and technical status discussions Glen B Alleman Institute for Defense Analyses Gordon Kranz DOD(OSD) PARCA
- 2. 1Office of Performance Assessments and Root Cause Analyses (PARCA) WBS is Paramount The WBS is the touchstone of all work activities, cost, schedule, and technical performance on the program It describes technical, process, and programmatic deliverables over the life of the program It describes how these deliverables are related through a well formed tree structure – parents and children – defined by MIL-STD-881C It describes how costs are assigned to this work and these costs roll up to their parents in Control Account and CLINS to the Performance Measurement Baseline (PMB)
- 3. 2Office of Performance Assessments and Root Cause Analyses (PARCA) Risk & Risk Assessment - Level of Detail - Program Oversight level of detail Schedule IMP / IMS Technical - TPMs - Specifications - Design docs - Performance char. Earned Value Cost and Schedule Status Getting the WBS Right is Paramount Focus of most programmatic and technical status discussions WBS
- 4. 3Office of Performance Assessments and Root Cause Analyses (PARCA) Technical Performance Measures (TPM) Attributes that determine how well a system or system element is satisfying or expected to satisfy a technical requirement or goal Assess design progress, Track compliance to performance requirements, Include projected performance. Are allocated across elements of the system (WBS components)
- 5. 4Office of Performance Assessments and Root Cause Analyses (PARCA) TPMs Allocated and Tracked by Relevant WBS Element All TSAS equipment fits in a single C-130J aircraft Weight budget allocated to WBS element(s) Lvl 1 Lvl 2 Lvl 4 Transportability Size Weight (T) TSAS 19 1.1 Unmanned Air Vehicle Airframe, Propulsion, Avionics 7 1.2 Unmanned Ground Vehicle Vehicle, Sensors 4 1.3 UAV Payload Electronics, support, calibration 1.5 1.4 Ground System(s) Power generation, huts, support 2.5 1.10 Special Support Equipment 0.5 1.11 Standard Support facilities Shelters, hangers, towing, storage 0.5 1.14 Spares, Repair Parts Electronics, propulsion, airframe 1 1.15 Surface sensor(s) Housings, power, communications 1.5
- 6. 5Office of Performance Assessments and Root Cause Analyses (PARCA) TSAS Program Performance Measures TSAS Element Measures Answers the Question Example SOW, SOO, ConOps Measures of Effectiveness (MoE) Are We Accomplishing The Mission? We need the capability to: Increase IED Placement search capabilities by 50% WBS Technical Performance Measure (TPM) What are we building and how do we know it meets the specifications? Systems, subsystems, and supporting processes for each deliverable IMP – PE and SA MoE from CBA, ICD, and CDD How can we measure the increasing maturity of the deliverables in the narratives in the CBA, ICD, and CDD Sensor payloads capable of IR and UV detectors within the avionics bay IMP – AC MoP Technical Performance of the deliverables derived from the MoEs 100 square miles per hours search capabilities IMS TPM How does the work increase the maturity of the deliverables? Sensor platform TPMs inside the bounds, on-time, on-schedule? Tasks CPI, SPI, TCPI What work is needed to increase the maturity of the deliverables? Cost and schedule matching TPM progress? Risk Register Identified risks, with handling strategies What are the Epistemic risks and how are they represented in the IMS? All variance risks included in duration and cost. Event based risk retirement handled in IMS, others contained in MR
- 7. 6Office of Performance Assessments and Root Cause Analyses (PARCA) TPM Trends and Responses at each Program Event for total TSAS weight target EV Taken, planned values met, tolerances kept, etc. 19T 16T 28T 23T PDRSRRSFRCA TRRCDR ROM in Proposal Design Model Mock Up Scale Model Measurement Detailed System Model Prototype Measurement 1st Article TechnicalPerformanceMeasure TSASSoSWeight
- 8. 7Office of Performance Assessments and Root Cause Analyses (PARCA) TPM Adjusted Program Performance TPMs are correlated to WBS elements and their cost and schedule performance TPM performance impacts CPI and SPI with burdened cost and schedule to get back to green.
- 9. 8Office of Performance Assessments and Root Cause Analyses (PARCA) Merging TPMs and EV Data EV measures quantity TPMs measures quality Both are needed
- 10. 9Office of Performance Assessments and Root Cause Analyses (PARCA) Risk & Risk Assessment - Level of Detail - Program Oversight level of detail Schedule IMP / IMS Technical - TPMs - Specifications - Design docs - Performance char. Earned Value Cost and Schedule Status Getting the WBS Right is Paramount Focus of most programmatic and technical status discussions WBS
- 11. 10Office of Performance Assessments and Root Cause Analyses (PARCA) Risk Processes start with WBS WBS level of detail is driven by technical and program risk, needed to identify – WBS provides framework for joint situational awareness between Government and contractor – MIL-STD-881C used as starting point and individual WBS elements driven to level of detail required for program oversight Work Packages from the WBS, linked to form the Tier 3 and Tier 2 IMS (per DI-MGMT-81861) must have risk assigned and margin and mitigation strategies – Natural variance of cost and schedule handled by margin – Event based risk handled through mitigations or Management Reserve
- 12. 11Office of Performance Assessments and Root Cause Analyses (PARCA) Generic UAV WBS guides the elicitation of risks in the Risk Register 11 Event based risks for each subsystem with impacts on cost, schedule, and technical performance. Each risk held in the Risk Register, marked with WBS. WBS number used to trace the risk to the IMS, PE, SA, AC, CA, WP. Risk retirement plans can then be shown by PE or Milestone in a risk waterfall Variance based uncertainties handled in cost and schedule margin
- 13. 12Office of Performance Assessments and Root Cause Analyses (PARCA) DAG Definition of Risk Risk is a measure of future uncertainties in achieving program performance goals and objectives within defined cost, schedule, and performance constraints. Risk can be associated with all aspects of a program (e.g., threat environment, hardware, software, human interface, technology maturity, supplier capability, design maturation, performance against plan,) as these aspects relate across the work breakdown structure and Integrated Master Schedule.
- 14. 13Office of Performance Assessments and Root Cause Analyses (PARCA) Both risk and uncertainty must be addressed on the program Uncertainty Naturally occurring variance in the work efforts or cost Like the weather, these variances are always there and are always changing Uncertainty can be modeled with a Monte Carlo Simulation tool and Reference Class Forecasting based on past performance Event Based Risk Probability of an event occurring in the future that results in an unfavorable outcome When this event occurs the consequential may be probabilistic as well. Probability of occurrence and impact are used to model the cost and schedule. Also uses Monte Carlo Simulation tool The natural variation of the project activities. Variance and impacts need cost and schedule margin The probability that something will happen to impact cost, schedule, and technical performance of deliverables
- 15. 14Office of Performance Assessments and Root Cause Analyses (PARCA) Risks Identified with WBS elements Each risk identified in the elicitation process WBS contained deliverables assigned to risk retirement processes Risk water fall defined by Program Event ID Risk Title Initial Risk Risk at IBR Risk at PDR Risk Type WBS 038 Center-of-Gravity Limits 16 15 10 Technical 2.1.5 006 Gross Liftoff Weight 16 15 10 Technical 2.1.5 090 Flight & Mission-Critical Software Development Effort 16 11 10 Schedule 2.1.4 101 Unattended launch system design 16 12 8 Schedule 6.2.14 082 Achieving Component, Subsystem- & System Quals 15 14 11 Schedule 2.1.7 244 Vehicle Production timing 12 12 10 Schedule 6.5 095 Autonomous Rendezvous flight pattern design 12 10 9 Schedule 6.2.12 017 EMI Anti-Jam Protection System Development 12 10 7 Technical 6.2.5 243 Landing and Impact Attenuation 12 12 6 Technical 6.2.11 098 Recover/Landing System (RLS) Rigging Complexity 12 12 6 Technical 6.2.11 088 Qualification of EEE Parts 12 10 4 Schedule 2.1.9.3 091 Uncertain To Achieve Payload Mounting Limits 12 8 3 Schedule 2.1.8
- 16. 15Office of Performance Assessments and Root Cause Analyses (PARCA) Risk chart for TPM variance improvement as the program matures Target launch mass is 27 Metric Tons for the WBS element 3.0 – launch ready spacecraft Baseline Mass plan 80% Mean Too heavy to launch Target Mass of spacecraft 23T 24T 25T 25T 26T 27T 28T 29T 30T Margin Risk Margin Current plan with probabilistic margin model CDR PDR SRR FRR ATLO 20% Aug 05 Jan 06 Aug 06 Mar 07 Dec 07 Feb 08 Current mass plan with deterministic margin Plan Title Probability distribution varies as time passes
- 17. 16Office of Performance Assessments and Root Cause Analyses (PARCA) Risk Management Processes for Program Management An approach to programmatic and technical risk
- 18. 17Office of Performance Assessments and Root Cause Analyses (PARCA) Risk Mitigation Activities in IMS “Buying down” risk is planned in the IMS. MoE, MoP, and KPP defined in the work package for the critical measure – weight. If we can’t verify we’ve succeeded, then the risk did not get reduced. The risk may have gotten worse Risk: CEV-037 - Loss of Critical Functions During Descent Planned Risk Level Planned (Solid=Linked, Hollow =Unlinked, Filled=Complete) RiskScore 24 22 20 18 16 14 12 10 8 6 4 2 0 Conduct Force and Moment Wind Develop analytical model to de Conduct focus splinter review Conduct Block 1 w ind tunnel te Correlate the analytical model Conduct w ind tunnel testing of Conduct w ind tunnel testing of Flight Application of Spacecra CEV block 5 w ind tunnel testin In-Flight development tests of Damaged TPS flight test 31.Mar.05 5.Oct.05 3.Apr.06 3.Jul.06 15.Sep.06 1.Jun.07 1.Apr.08 1.Aug.08 1.Apr.09 1.Jan.10 16.Dec.10 1.Jul.11 Weight risk reduced from RED to Yellow Weight confirmed ready to fly – it’s GREEN at this point
- 19. 18Office of Performance Assessments and Root Cause Analyses (PARCA) Risks in Risk Register connected to WBS elements provide cost impact analysis Risk ID traceable to and from IMS with schedule impacts defined by probabilistic impact WBS elements collect cost impact of risk from the IMS Risk handling strategies connected to IMP, IMS, WBS, SOW, and TPM measures
- 20. 19Office of Performance Assessments and Root Cause Analyses (PARCA) Management Reserve Log (MRL) provides the integrity for all changes to the PMB All changes authorized through the BCR process All impacts recorded with BCR and in Management Reserve impacts (ups and downs) captured in the same meeting
- 21. 20Office of Performance Assessments and Root Cause Analyses (PARCA) Risk & Risk Assessment - Level of Detail - Program Oversight level of detail Schedule IMP / IMS Technical - TPMs - Specifications - Design docs - Performance char. Earned Value Cost and Schedule Status Getting the WBS Right is Paramount Focus of most programmatic and technical status discussions WBS
- 22. 21Office of Performance Assessments and Root Cause Analyses (PARCA) Earned Value Management is the ‘best tool’ for managing large, complex acquisition programs. – Ashton Carter (USD, AT&L) 26 November 2009
- 23. 22Office of Performance Assessments and Root Cause Analyses (PARCA) Standard ANSI-748B Earned Value Management Measures program performance against plan by comparing the: – Planned Value (Budgeted Cost of Work Scheduled) – the budget for the planned work and period of performance for that budget – Earned Value (Budgeted Cost of Work Performed) – the measure physical percent complete x Planned Value BCWP = BCWS x Physical Percent Complete With the Actual Cost collected, Earned Value can determine both Cost Variance and Schedule Variance
- 24. 23Office of Performance Assessments and Root Cause Analyses (PARCA) Earned Value Management 23
- 25. 24Office of Performance Assessments and Root Cause Analyses (PARCA) Control Accounts are formed at the Intersection of the WBS and OBS
- 26. 25Office of Performance Assessments and Root Cause Analyses (PARCA) Format 1 shows program performance by WBS element against planned cost
- 27. 26Office of Performance Assessments and Root Cause Analyses (PARCA) Connecting the EVM Elements with Technical Performance Measures Integrating Cost, Schedulele, and Technical Performance Assures Program Management has the needed performance information to deliver on‒time, on‒budget, and on‒specification Technical Performance Measures Cost Schedule Conventional Earned Value + = Master Schedule is used to derive Basis of Estimate (BOE) not the other way around. Probabilistic cost estimating uses past performance and cost risk modeling. Labor, Materiel, and other direct costs accounted for in Work Packages. Risk adjustments for all elements of cost. Cost Baseline Earned Value is diluted by missing technical performance. Earned Value is diluted by postponed features. Earned Value is diluted by non compliant quality. All these dilutions require adjustments to the Estimate at Complete (EAC) and the To Complete Performance Index (TCPI). Technical Performance Requirements are decomposed into physical deliverables. Deliverables are produced through Work Packages. Work Packages are assigned to accountable manager. Work Packages are sequenced to form the highest value stream with the lowest technical and programmatic risk. Schedule Baseline
- 28. 27Office of Performance Assessments and Root Cause Analyses (PARCA) WBS Dictionary
- 29. 28Office of Performance Assessments and Root Cause Analyses (PARCA) Control Account Plan Confirms the agreement between CAM and PM for accomplishing scope, budget, and schedule Processes – Development and assignment – identify key control points between WBS and OBS – Work Authorization – develop detail cost and schedules for Work Packages and Planning Packages
- 30. 29Office of Performance Assessments and Root Cause Analyses (PARCA) Control Account Plan Work Sheet
- 31. 30Office of Performance Assessments and Root Cause Analyses (PARCA) Risk & Risk Assessment - Level of Detail - Program Oversight level of detail Schedule IMP / IMS Technical - TPMs - Specifications - Design docs - Performance char. Earned Value Cost and Schedule Status Getting the WBS Right is Paramount Focus of most programmatic and technical status discussions WBS
- 32. 31Office of Performance Assessments and Root Cause Analyses (PARCA) IMP/IMS from RFP to Execution starts with the WBS SOW WBS SOO ConOps Objective status and views to support proactive management
- 33. 32Office of Performance Assessments and Root Cause Analyses (PARCA) IMP/IMS Structure IMS IMP Describes how program capabilities will be delivered and how these capabilities will be recognized as ready for delivery Supplemental Schedules Work Packages and Tasks Criteria Accomplishment Events or Milestones
- 34. 33Office of Performance Assessments and Root Cause Analyses (PARCA) Horizontal and Vertical Traceability of the IMP/IMS Integrated Master Schedule Work sequenced to produce outcomes for each WP. Vertical traceability AC SA PE Horizontal traceability WP WPAC Program Events Define the maturity of a Capability at a point in time. Significant Accomplishments Represent requirements that enable Capabilities. Accomplishment Criteria Exit Criteria for the Work Packages that fulfill Requirements. Work Package Work Package Work Package Work Package Work Package Work package Work Package Work Package
- 35. 34Office of Performance Assessments and Root Cause Analyses (PARCA) IMP/IMS Role During Execution Program ExecutionPMB for IBRProposal SubmittalDRFP & RFP Performance Measurement Baseline Tasks (T) BOE % Complete Statement of Work Program Deliverables IMP Accomplishments (A) Criteria (C) EVMS Events (E) Budget Spreads by CA & PackagesCAIV Capabilities Based Requirements X BCWS = Probabilistic Risk Analysis = Time keeping and ODC = Technical Performance Measure BCWP ACWP Cost & Schedule Risk Model BCWS D ecreasing techni cal and programmatic ri sk usi ng R i sk Management Methods IMS Physical % Complete Continuity and consistency from DRFP through Program Execution WBS CWBS
- 36. 35Office of Performance Assessments and Root Cause Analyses (PARCA) IMP Narrative for TSAS PDR Program Event Program Event Description Maturity Assessment measured by Significant Accomplishments PDR PDR establishes the TSAS “design- to” allocated baseline to the subsystem level, ensures this design meets the functional baseline, and system requirements have been properly allocated to the proper subsystem. PDR establishes the feasibility of the TSAS design approach to meet the technical requirements and provide acceptable interface relationships between the hardware and other interfacing items. Any changes to the requirements that have occurred since the System Requirements Review (SRR2) will be verified at the PDR. PDR assures the design is verifiable, does not pose major IMS or cost risk, and is mature enough to advance to the detailed design phase. Subsystem level operational concepts defined System level interfaces baselined Supportability plans established Software requirements finalized Subsystem requirements finalized & allocated System verification, validation & certification plans updated PDR subsystem design completed Build IMP
- 37. 36Office of Performance Assessments and Root Cause Analyses (PARCA) WBS collects costs and assures mapping to SOW and maturity measures in the IMP The product and process WBS collects costs at the deliverables level The IMP shows measures of increasing maturity against those costs
- 38. 37Office of Performance Assessments and Root Cause Analyses (PARCA) Work Packages, Planning Packages, and Rolling Waves form the IMS The planning horizon should not be beyond a distance where reliable estimated cannot be formed Rolling Waves and Planning provide this capability X3_1158_043_F Month 3 Month 4 Month 5 Month 6 Month 7 Month 8 Month 9 Mon10 Time Now WP #4 Plan and Input Next RW Period WP #5 WP #6 WP #7 WP #9 WP #8 Minimum of 1 month advance detail planning Detail planning of next rolling wave 30 Days RW #3RW #3 Rolling Wave Period #2 Rolling Wave Period #1 WP #2 WP #3 PP #9 PP #8 PP #7 PP #6 PP #5
- 39. 38Office of Performance Assessments and Root Cause Analyses (PARCA) INTEGRATED PROGRAM MANAGEMENT SYSTEM Each element of the program, anchored through the Work Breakdown Structure, contributes to increased visibility to Program Performance using all performance measures.
- 40. 39Office of Performance Assessments and Root Cause Analyses (PARCA) Integrated Program Management System
- 41. 40Office of Performance Assessments and Root Cause Analyses (PARCA) Backup
- 42. 41Office of Performance Assessments and Root Cause Analyses (PARCA) Capabilities Based Assessment DOTMLPF Analysis CBA ICD DCR MDD MSA MS A Development MS B CDD EMD MS C Production and Deployment CPD Doctrine, Organization, Training, Materiel, Leadership, Personnel, Facilities DOTMLPF Change Recommendation Capabilities Based Assessment Initial Capabilities Document Materiel Development Decision Materiel Solution Analysis Capability Development Document Engineering, Manufacturing, Deployment Capability Development Documenthttp://www.acqnotes.com/Acquisitions/JCIDS%20Overview.html
- 43. 42Office of Performance Assessments and Root Cause Analyses (PARCA) Drivers of Technical Performance Measures Start with Mission Need MoE KPP MoP TPM Mission Need Acquirer Defines the Needs and Capabilities in terms of Operational Scenarios Supplier Defines Physical Solutions that meet the needs of the Stakeholders Operational measures of success related to the achievement of the mission or operational objective being evaluated. Measures that characterize physical or functional attributes relating to the system operation. Measures used to assess design progress, compliance to performance requirements, and technical risks. Government Contractor JROC KPP’s or program specific KPP’s Loiter on station ≥ 2 hours
- 44. 43Office of Performance Assessments and Root Cause Analyses (PARCA) TPM Work Products Mandatory Key Performance Parameters (KPP) – JROC – (1) Force Protection, (2) Survivability, (3) Sustainment, (4) Net-Ready, (5) Training, (6) Energy – Program specific KPP’s Technical Performance Measures – Weight, thermal load, loiter time, serviceability Earned Value Management – CPI – SPI
- 45. 44Office of Performance Assessments and Root Cause Analyses (PARCA) Key elements to Connecting EV with TPM† Traceability – Requirements to WBS to TPMs to EV control accounts. Impact – How much WBS work, & therefore EV money, is covered by the TPM(s)? What is effect? TPM Banding/Sensitivity – What banding (R/Y/G) and sensitivity (EV impact) should be used for each TPM? Technical Readiness Level – What’s the state of the technology supporting the requirement(s) for which TPM is a metric? † Implementing Technical Performance Measurement, Mike Ferraro, PEO/SYSCOM Conference, 20-22 Nov 2002
- 46. 45Office of Performance Assessments and Root Cause Analyses (PARCA) Some Candidates for Technical Performance Measures TPM Concept Description of TPM Physical Size and Stability Useful Life Weight 25kg Volumetric capacity Functional Correctness Accuracy Power performance All the “ilities” Supportability Maintainability Dependability Reliability = Mean Time Failure Efficiency Utilization Response time Throughput Suitability for Purpose Readiness Weight
- 47. 46Office of Performance Assessments and Root Cause Analyses (PARCA) 1.1 Air Vehicle 1.1.1 Sensor Platform 1.1.2 Airframe Airframe Weight TPM The WBS for a UAV 1.1.2 Airframe CA SFR SRR PDR CDR TRR Planned Value 28.0kg 27.0kg 26.0kg 25.0kg 24.0kg 23.0kg Actual Value 30.4kg 29.0kg 27.5kg 25.5kg Assessed Risk to TRR Moderate >2.0kg off target Low 1–2 kg off target Low 1–2 kg off target Very Low (less than 1.0 kg off target) Planned Method “Similar to” Estimate ROM Program– unique design model Program– unique design model with validated data Actual measurement of bench–test components Actual measurement of prototype airframe Actual Method “Similar to” Estimate ROM ROM ROM The planned weight is 25kg. The actual weight is 25.5kg. Close to plan! So we are doing okay, right? Here’s the Problem
- 48. 47Office of Performance Assessments and Root Cause Analyses (PARCA) 1.1 Air Vehicle 1.1.1 Sensor Platform 1.1.2 Airframe 1.1.3 Propulsion 1.1.4 On Board Comm 1.1.5 Auxiliary Equipment 1.1.6 Survivability Modules 1.1.7 Electronic Warfare Module 1.1.8 On Board Application & System SW 1.3 Mission Control / Ground Station SW 1.3.1 Signal Processing SW 1.3.2 Station Display 1.3.3 Operating System 1.3.4 ROE Simulations 1.3.5 Mission Commands The WBS for a UAV 1.1.2 Airframe TPMs start with the WBS Dictionary
Editor's Notes
- The target weight for the UAV is 25kg. At contract award that target was the “awarded goal.” At System Functional Review (SFR) the CATIA 3D model showed that the “all in” weight of the vehicle is around 28kgs. Systems engineering, sensors, and propulsion design efforts focused on scrubbing the vehicle to keep under the upper bound of allowable weight. At Systems Requirements Review (SRR) they had had not succeeded with the stringent requirements for the sensor array, loiter time for fuel on board and the newly discovered reduction of thrust in the ducted fan assembly requiring addition vanes. By PDR those issues had been addressed, and alternative materials had been identified from the build from “same as” model used for SFR and SRR. With the new materials, reduction of sensor standby power, and other “lightening” effort, the vehicle came in under the max weight allowable for the thrust available. Changes to the control system to account for addition momentum induced guidance loops allowed this new weight to meet the flight performance KPPs.
- Risk retirement activity address know