Bacterial Numbers, Biomass and Productivity within the KwaZulu-Natal Bight: ACEP 11
•
0 likes•142 views

Travis Kunnen, Ursula Scharler, David Muir. Presented at the ninth Scientific Symposium of the Western Indian Ocean Marine Science Association (WIOMSA) 2015.
Recommended

Recommended
More Related Content
What's hot
What's hot (20)
Viewers also liked
Similar to Bacterial Numbers, Biomass and Productivity within the KwaZulu-Natal Bight: ACEP 11
Similar to Bacterial Numbers, Biomass and Productivity within the KwaZulu-Natal Bight: ACEP 11 (20)
More from MACE Lab
More from MACE Lab (20)
Recently uploaded
Recently uploaded (20)
Bacterial Numbers, Biomass and Productivity within the KwaZulu-Natal Bight: ACEP 11
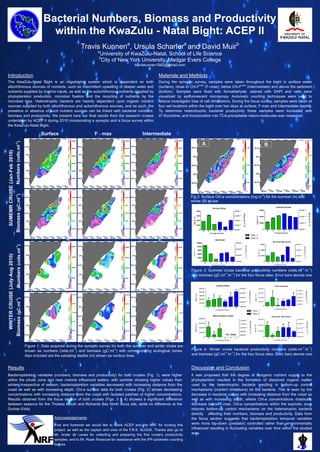
- 1. Travis Kunnena , Ursula Scharlera and David Muirb a University of KwaZulu-Natal, School of Life Science b City of New York University, Medgar Evers College traviskunnen1982@gmail.com Bacterial Numbers, Biomass and Productivity within the KwaZulu - Natal Bight: ACEP II Introduction The KwaZulu-Natal Bight is an oligotrophic system which is dependent on both allochthonous sources of nutrients, such as intermittent upwelling of deeper water and nutrients supplied by riverine inputs, as well as the autochthonous nutrients supplied by phytoplankton production, microbial fixation and the recycling of nutrients by the microbial loop. Heterotrophic bacteria are heavily dependent upon organic nutrient sources supplied by both allochthonous and autochthonous sources, and as such, the presence or absence of such nutrient sources can be linked with bacterial numbers, biomass and productivity. We present here our final results from the research cruises undertaken by ACEP II during 2010 incorporating a synoptic and a focus survey within the KwaZulu-Natal Bight. Materials and Methods During the synoptic survey, samples were taken throughout the bight in surface water (surface), close to Chl-Fmax (F–max), below Chl-Fmax (intermediate) and above the sediment (bottom). Samples were fixed with formaldehyde, stained with DAPI and cells were visualized by epifluorescent microscopy. Automatic counting techniques were used to reduce investigator bias of cell dimensions. During the focus survey, samples were taken at four set locations within the bight over two days at surface, F-max and intermediate depths. To determine heterotrophic bacterial productivity these samples were incubated with H3 -thymidine, and incorporation into TCA-precipitable macro-molecules was measured. Numbers(cells.ml-1 ) Surface F - max Intermediate Figure 1: Data acquired during the synoptic survey for both the summer and winter cruise are shown as numbers (cells.ml-1 ) and biomass (gC.ml-1 ) with corresponding ecological zones. Also included are the sampling depths (m) shown as contour lines. Biomass(gC.ml-1 ) Discussion and Conclusion It was proposed that the degree of inorganic nutrient supply to the phytoplankton resulted in the formation of dissolved organic matter used by the heterotrophic bacteria resulting in bottom-up control mechanisms (nutrient limitations) on the bacteria. This is seen by the decrease in bacterial values with increasing distance from the coast as well as with increasing depth, where Chl-a concentrations drastically decrease below F-max. Chl-a concentrations within the euphotic zone induces bottom-up control mechanisms on the heterotrophic bacteria directly affecting their numbers, biomass and productivity. Data from the focus section suggests that bacterioplankton temporal variables were more top-down (predator) controlled rather than environmentally influenced resulting in fluctuating variables over time within the studied area. Acknowledgements First and foremost we would like to thank ACEP and the NRF for funding this project, as well as the captain and crew of the F.R.S. ALGOA. Thanks also go to Mr. Ander de Lecea for collecting and preparing the first cruise’s productivity samples, and to Mr. Riaan Rossouw for assistance with the IPP automatic counting feature. SUMEMRCRUISE(Jan-Feb2010)WINTERCRUISE(July-Aug2010) Numbers(cells.ml-1 )Biomass(gC.ml-1 ) Figure 3: Summer cruise bacterial productivity numbers (cells.ml-1 .hr-1 ) and biomass (gC.ml-1 .hr-1 ) for the four focus sites. Error bars denote one Figure 4: Winter cruise bacterial productivity numbers (cells.ml-1 .hr-1 ) and biomass (gC.ml-1 .hr-1 ) for the four focus sites. Error bars denote one Results Bacterioplankton variables (numbers, biomass and productivity) for both cruises (Fig. 1), were higher within the photic zone and near riverine influenced waters, with summer showing higher values than winter. Irrespective of season, bacterioplankton variables decreased with increasing distance from the coast as well as with increasing depth. Chl-a surface data for both cruises (Fig. 2) shows decreasing concentrations with increasing distance from the coast with isolated patches of higher concentrations. Results obtained from the focus section of both cruises (Figs. 3 & 4) showed a significant difference between seasons for the Thukela Mouth and Richards Bay North focus site, while no difference at the Durban Eddy. Fig 2: Surface Chl-a concentrations (mg.m-3 ) for the summer (A) and winter (B) cruise. A B