Downloaded 325 times


![Water Sustainability
56
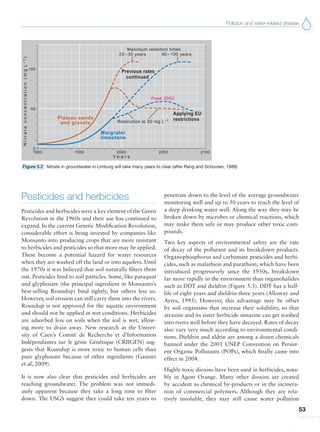
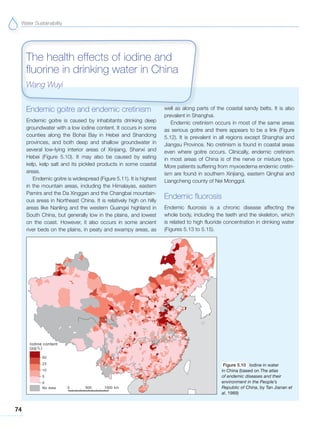
(Moriarty, 1988). However, birds that eat fish from the
lake showed levels of 1600 ppb in their fatty tissues.
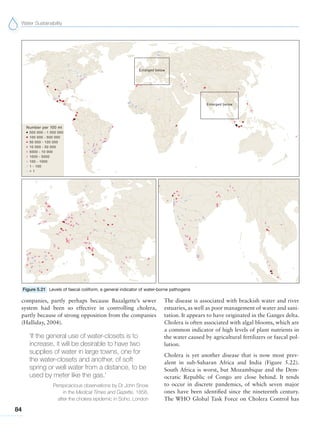
Endocrine disrupters – a
sea of oestrogens
Research over the last two decades has revealed the dan-
gers of many man-made substances now in common
use that act as ‘endocrine disputers’, causing the body’s
endocrine or hormone release system to malfunction.
These compounds affect the sexual development of ani-
mals and humans and they tend to bio-accumulate in the
body. Endocrine disrupters may either act like female sex
hormones, mimicking oestrogens; they may block the
normal receptors for the sex hormones, effectively turn-
ing off the hormonal activity; or they might activate the
receptors in a different way, perhaps stimulating some
activity.
Many everyday products act as endocrine disrupters,
either in their original state or in the secondary sub-
stances they produce as they degrade. They are by no
means restricted to agricultural use, although it was pes-
ticides that first alerted biologists to the dangers. The
problem chemicals include many chlorinated hydro-
carbons, DDT and its breakdown product DDE, DES
(diethyl stilbestrol), some PCBs, parabens used in cos-
metics, dioxins, several pesticides such as atrazine, and
fungicides. Many of these substances are resistant to
biodegradation. But some substances that are non-toxic
or have low toxicity may nevertheless break down into
other substances in the environment that are unstable
and more toxic. Members of one major class of plas-
ticizer, called phthalates, used for example to make
plastics flexible and to improve the flow of paints, are
known to be endocrine disrupters in animals.
Although research in the early 1990s first alerted medi-
cal and environmental science to the dangers, manu-
facturers have mounted strong opposition to legislative
controls. Only now are governments beginning to intro-
duce controls, more than a decade since expert scientists
presented their findings to the US Congress and called
for legislation. Around 200 million tonnes of plasticizers
are produced in North America annually. The American
Chemistry Council – which represents the industry and
is not as might appear a scientific organization – claims
that there is no sound evidence that these chemicals
affect the endocrine system and points out that they play
many valuable roles, including producing flexible tubing
for medicine and coatings for pills.
The International Programme on Chemical Safety (IPCS),
run by the WHO, the International Labour Organiza-
tion and UNEP, was asked to investigate the claims and
present evidence to the contrary (Damstra et al, 2002).
There is very strong evidence for effects on wildlife, even
though the exact mechanisms are often poorly under-
stood. The evidence for effects on humans is less clear,
partly because obtaining experimental evidence with
humans is more difficult than with laboratory-control-
led experiments on animals. Even so, strong statistical
evidence was produced in the early 1990s for effects
on humans as well as animals. Sharpe and Skakkebaek
(1993) and Dibb (1995) stated that at least 37 differ-
ent chemicals had been identified that disrupt hormone
operations and appear to be linked to testicular cancer
and other sexual abnormalities in humans and animals.
The IPCS report concluded that although the evidence
for effects on humans in ‘weak’, this only means that
more rigorous studies are urgently needed. Recently,
Swan et al (2005) published meticulous research that
establishes a link between genital abnormalities in boys
and their prenatal exposure to phthalates as measured in
the mother’s urine.
‘Despite an overall lack of knowledge
of mechanisms of action of EDCs
[endocrine-disrupting chemicals], there are
several examples where the mechanism
of action is clearly related to direct
perturbations of endocrine function … The
evidence that high-level exposure may
impact both humans and wildlife indicates
that this potential mechanism of toxicity
warrants our attention.’
WHO/ILO/UNEP International Programme on Chemical
Safety, Damstra et al (2002)
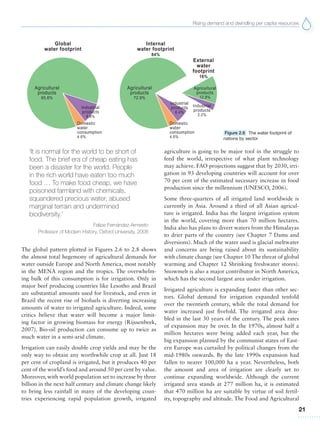
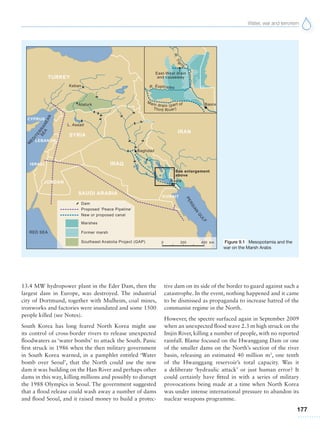
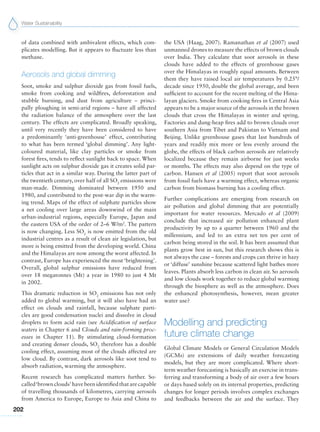
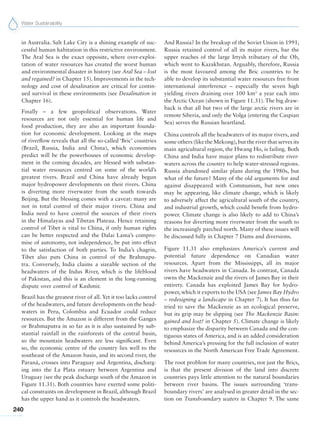
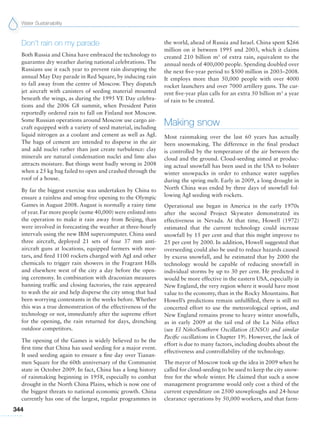
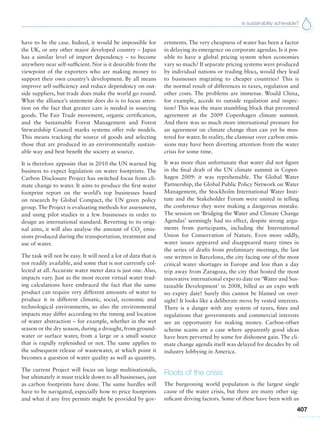
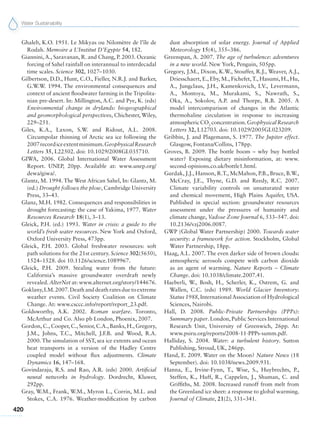
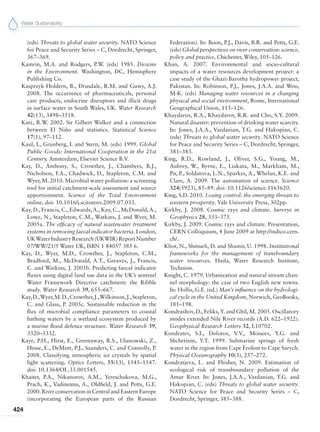
Research in the Great Lakes in the 1990s revealed major
problems with the development of fish in Lake Erie
(exploding thyroids and trans-sexual development) even
though the lakes have been largely cleaned up. Scien-
tists recently identified the ‘Great Lakes Embryo Mor-
tality, Edema (or oedema) and Deformity Syndrome’
among fish-eating birds, which has been directly related
to PCBs. At the 2009 Annual Conference on Great
Lakes Research held in Toledo, Ohio, Parrott and col-
leagues from Environment Canada presented evidence
of a link between the synthetic oestrogen used in birth](https://image.slidesharecdn.com/watertextbook-130918222901-phpapp02/85/Water-textbook-69-320.jpg)
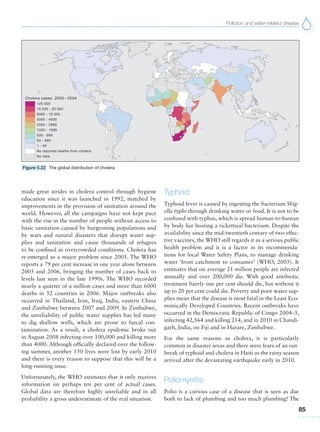
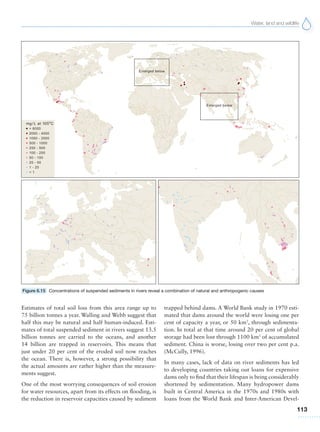
![Pollution and water-related disease
79
appears to imply a major effect on the environment
due to increased human influence, most likely related to
modern water management. In the Indian subcontinent,
the problem was exacerbated by three factors which led
to a dramatic increase in the use of groundwater as a
supposedly safer source of drinking water and a major
resource for expanding irrigated agriculture: 1) the
worsening biological contamination of surface waters in
the mid-twentieth century; 2) the Green Revolution in
agriculture; and 3) the severe cholera outbreak in south
Bengal in the 1960s. The World Bank was a principal
promoter of the switch to groundwater and funded
thousands of tubewells for irrigation from the 1960s
onwards.
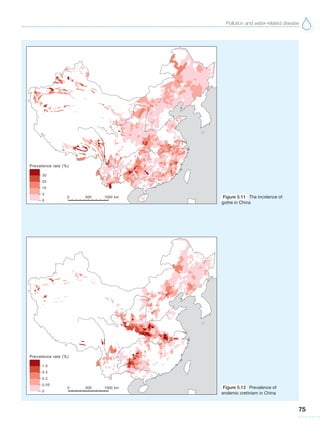
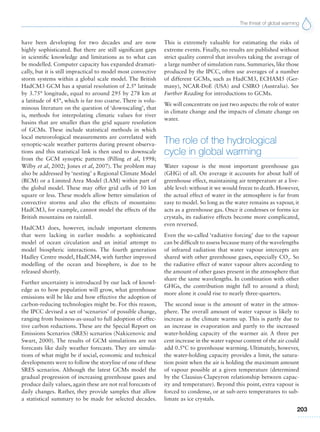
Arsenic may be released by oxidation of pyrite, arse-
nopyrite and clay minerals, which have arsenic
adsorbed on their surface. Oxygen enters aquifers when
the water table is lowered; the arsenic is then free to
pollute the groundwater when the rocks are reflooded.
Arsenic pollution may thus result from groundwater
overdraft.
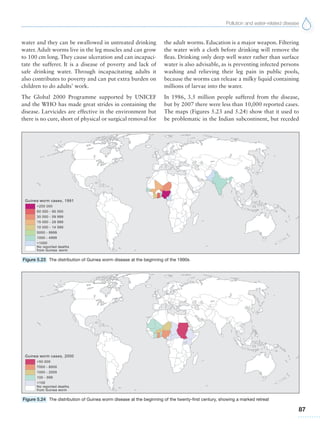
It has even been suggested that reducing surface water
discharges can have a similar effect: diversion of the
Ganges, the Tisha and 28 other transboundary rivers in
India may have contributed to the problem in Bangla-
desh by reducing groundwater recharge. Even though
millions of tubewells were installed in Bangladesh before
the 1970s, medical records only show a significant rise in
pathological symptoms during the 1980s in West Bengal
and 1990s in Bangladesh. Some observers have linked
this with the completion of the Farraka barrage in 1975,
which diverted Ganges water to Calcutta and reduced
the discharge entering Bangladesh.
A second hypothesis focuses on the opposite situation:
excess water. In organic-rich clayey sediments, satu-
rated, anaerobic conditions create a chemically reduc-
ing environment, which leads to the dissolution of iron
oxyhydroxides containing sorbed arsenic. Iron-reducing
bacteria may also play a part. This situation is typical
of natural wetlands and could also be a dangerous by-
product of over-irrigation.
Yet a third hypothesis blames pollution from human
sources, especially from agriculture. Nitrate from ferti-
lizer can oxidize sulphate minerals and release sorbed
arsenic. And arsenical pesticides were widely used in
America for 100 years until banned in the late twenti-
eth century, although their low solubility suggests that
they are not a major source of water pollution. Cur-
rent research in Botswana’s Okavango delta is trying
to determine whether the calamitous arsenic pollution
that has affected the town of Maun is due to exces-
sive drawdown of the water table or human sewage
(Huntsman-Mapila et al, 2006, in press).
Solutions
In recent years, some communities in the Bengal basin
have begun to revert to using surface waters as the
enormity of the problem has been realized. Yet, ironi-
cally, low-cost technology is already available for
purifying well-water in the domestic environment.
One method is to mix the water with ferric chloride
and potassium permanganate to oxidize it in a plas-
tic bucket and strain it through a cloth into a second
bucket filled with sand to clarify it. Results reported
to the United Nations University show arsenic concen-
trations reduced to less than 20 μg/L, even with water
containing up to 500 μg/L (Ali et al, 2001). Many other
sorbents can be used, especially laterite, a clay soil rich
in iron and aluminium, providentially common in trop-
ical regions. Education and government help are the
keys to encouraging adoption.
‘Reversion to surface water-based supply
… will involve enormous financial outlay
and would nullify the investment of around
Rs 10,000 crores [100 billion rupees or
around $2 billion] already made in West
Bengal alone over the last 30 years. It
is necessary that such major policy shift
should not be ad hoc, but a science-
driven decision.’
S.K. Acharyya, former Director General
in the Geological Survey of India, 2002
Better still would be expansion of the public water
supply systems in which filtration and coagulation meth-
ods are applied centrally. However, the best solution is to
identify the specific causes responsible in each area and
either to manage water usage appropriately or else to
clean up at source. Considerable research effort is cur-
rently being devoted to this end, especially in India and
Bangladesh. One promising approach is bio-remediation
within the aquifer, introducing microbes to precipitate
iron sulphide that will sorb arsenic.](https://image.slidesharecdn.com/watertextbook-130918222901-phpapp02/85/Water-textbook-92-320.jpg)

![Water Sustainability
166
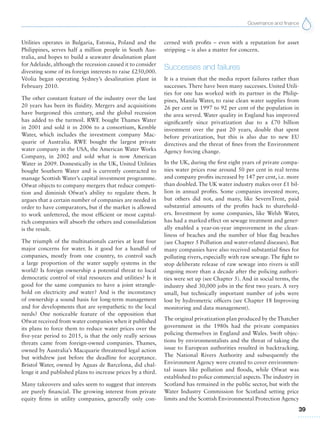
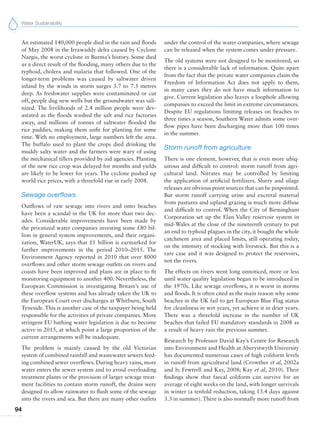
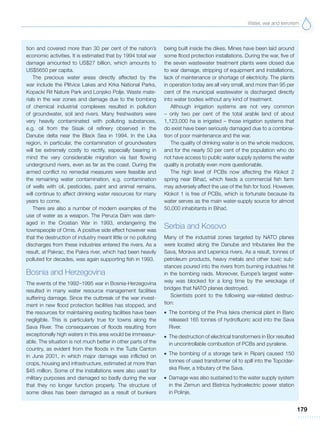
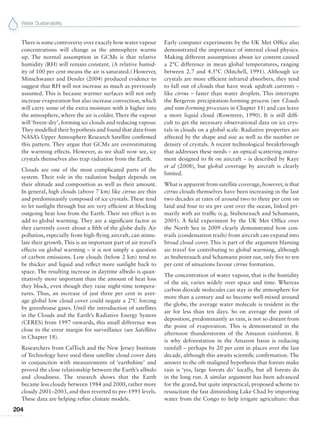
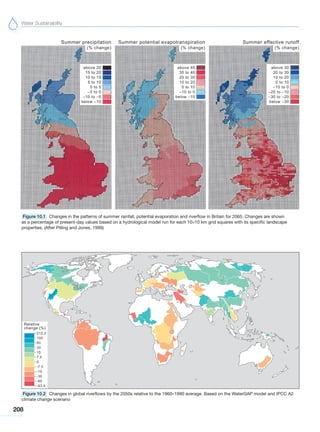
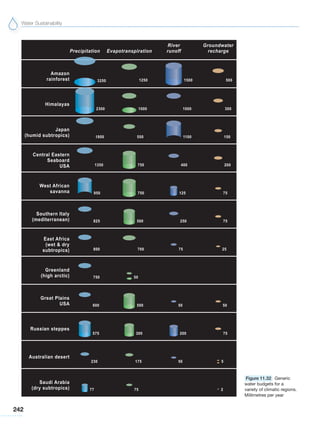
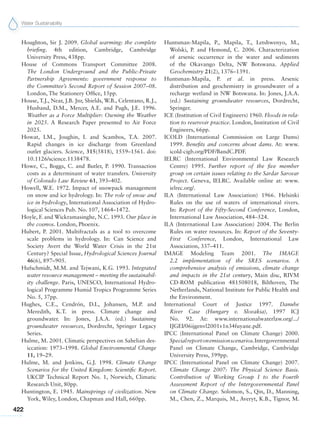
some average values. In general, water consumption is
greater in drier climates. The latest crop calculations
take into consideration the differences in the water
requirements for similar products produced in different
environments using the FAO’s CROPWAT program to
calculate crop water requirements and FAO statistics on
yields and world trade (Hoekstra and Hung, 2005).
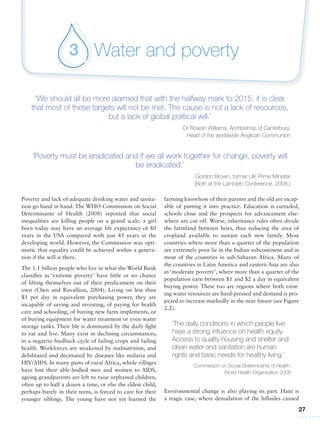
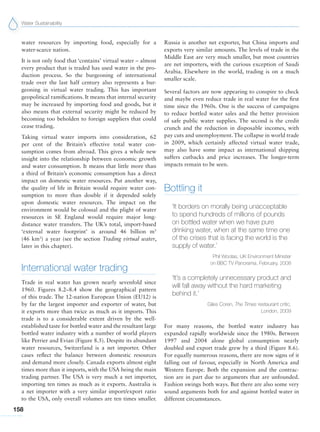
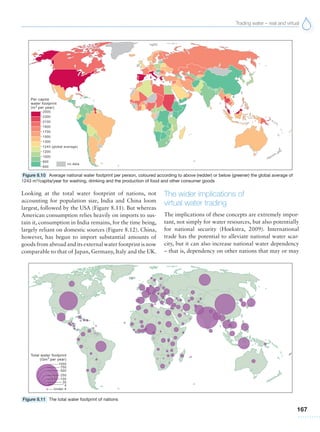
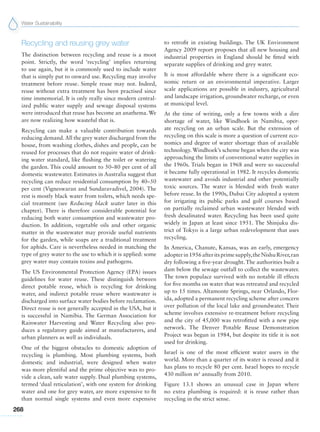
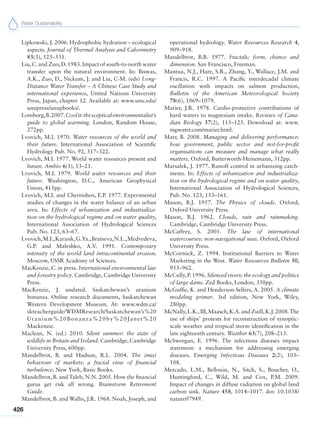
The team have also developed the idea of a ‘water
footprint’, which is the total amount of water used in
the production of goods and services (Chapagain and
Hoekstra, 2004). This can be applied nationally or for
individual producers. Warner (2003) argues that it could
usefully be applied to individual regions or river basins
as well. The national water footprint can be divided
between internal or domestic and external or interna-
tional trade footprints. The concept is analogous to
the carbon footprint calculations being introduced as
part of the fight against greenhouse gas emissions. The
team provide short instructional courses in the method
and have recently produced a Water Footprint Manual
for use by individuals and companies. The article ‘The
globalization of water’ by Arjen Hoekstra, later in this
chapter, summarizes the concept and its implications.
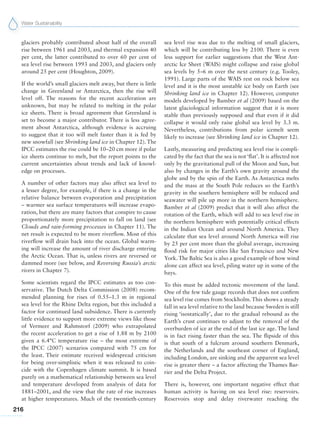
The water footprint concept reveals the wide differences
in consumption around the world and also the extent
to which consumption in one nation has an impact on
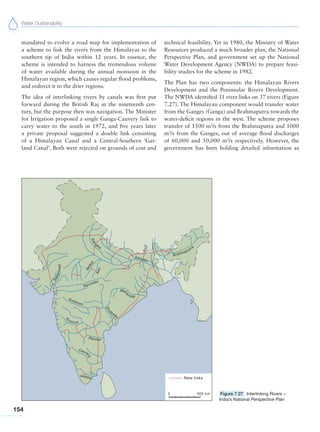
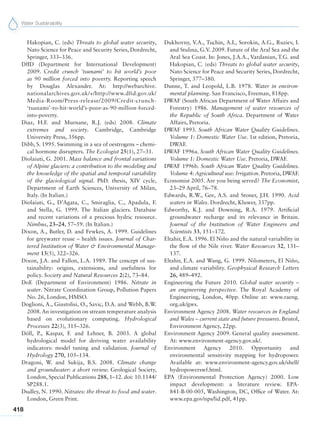
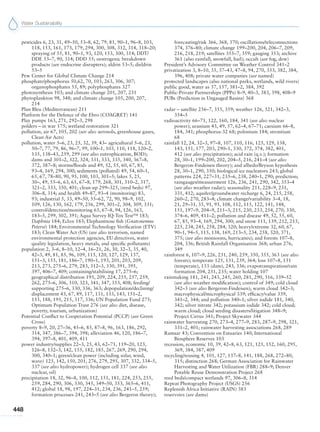
the water resources of another. While the average world
citizen consumes around 1240 m3
a year through drink-
ing, washing, food and other goods, Americans consume
twice as much and Chinese presently consume a little
over half as much, although this is rising rapidly (Figure
8.10). In more everyday terms, people in America con-
sume over 6000 litres of virtual water daily, compared
with less than 2000 in China.
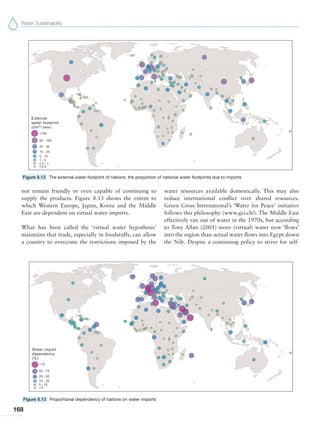
World trade means that all countries are to some degree
dependent on others. Consumers of imported goods in
Europe, Japan and the USA have impacts, sometimes
serious ones, on water resources in the developing world
and emerging economies, especially in Latin America,
where Brazil and Argentina are major exporters. Africa
is a net exporter, particularly to Europe, yet much of
the continent suffers water shortages and more people
are starving in Africa than on any other continent (see
Róisín Murray-William’s article ‘Valentine flowers from
Kenya – a perverse trade?’, later in this chapter). The
USA, Canada and Australia are also major exporters,
but their domestic resources can generally sustain the
trade with backing from reciprocal imports.
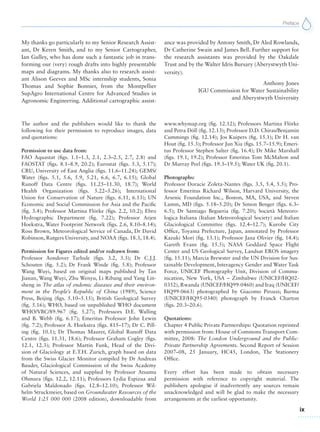
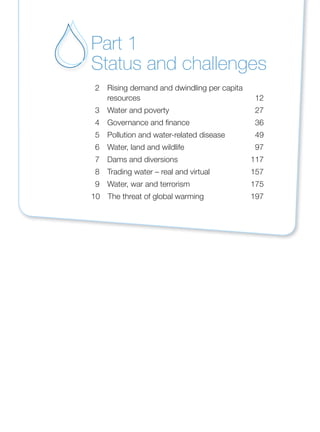
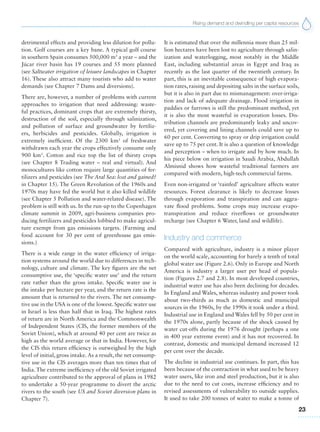
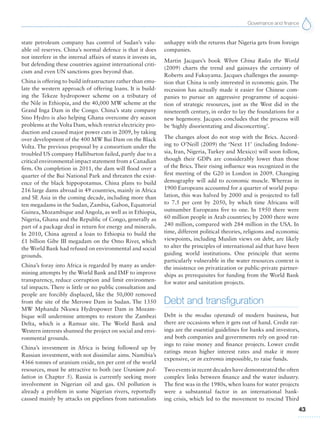
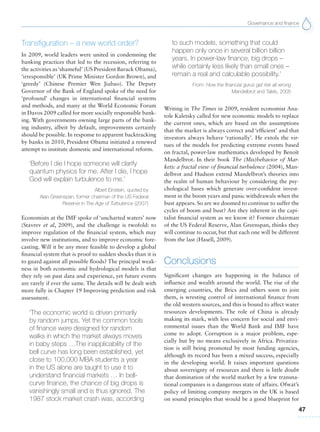
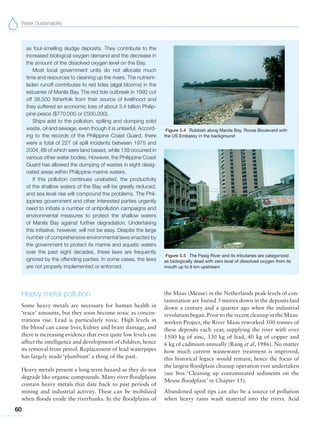
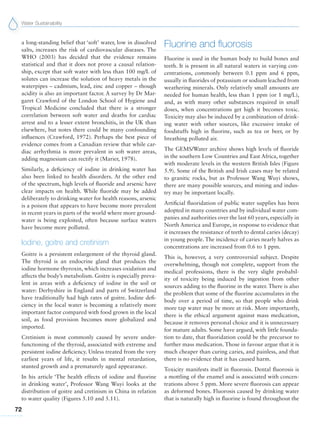
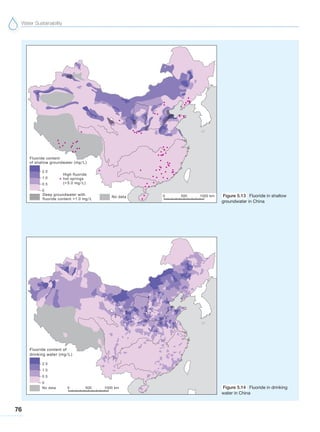
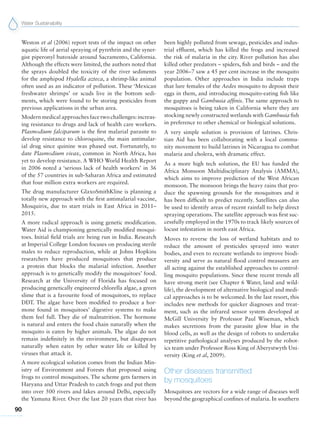
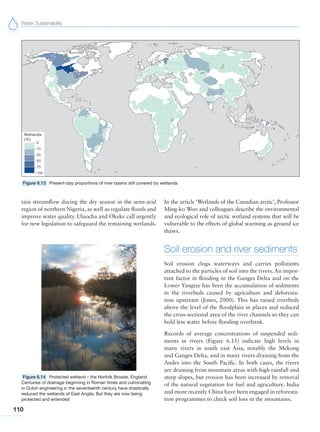
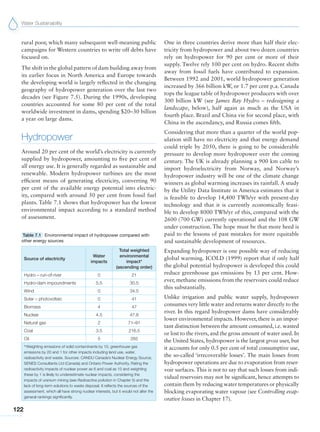
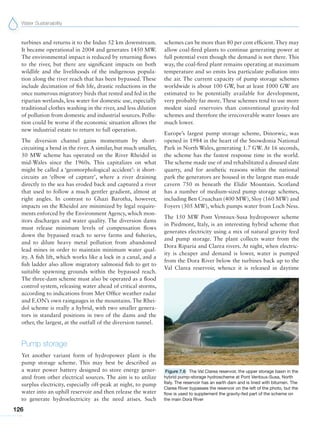
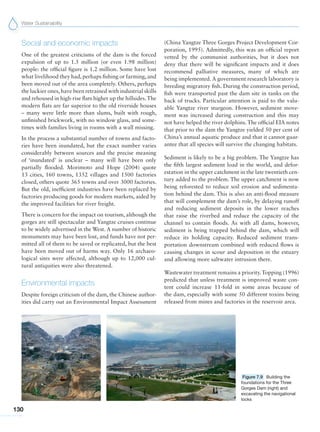
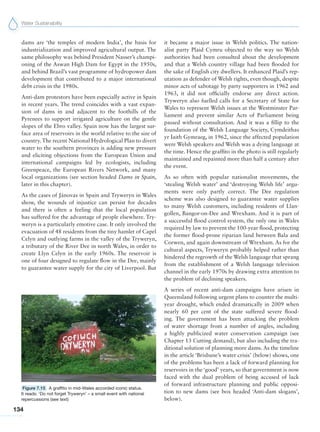
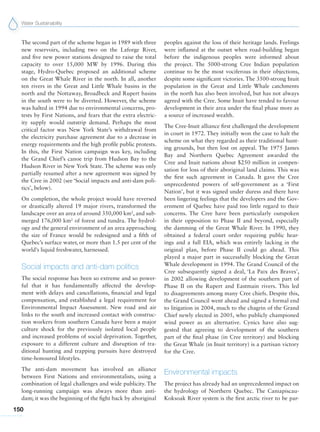
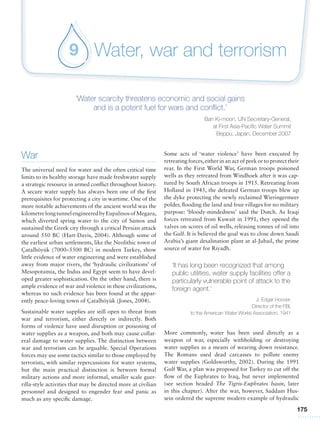
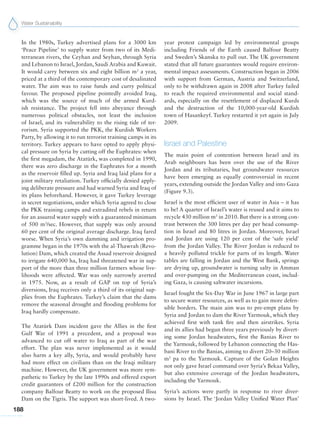
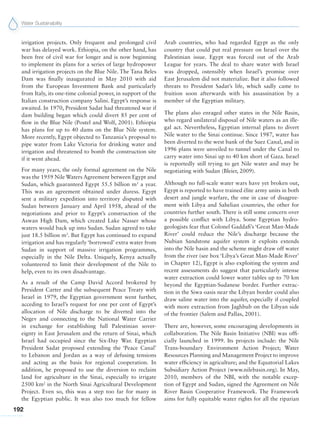
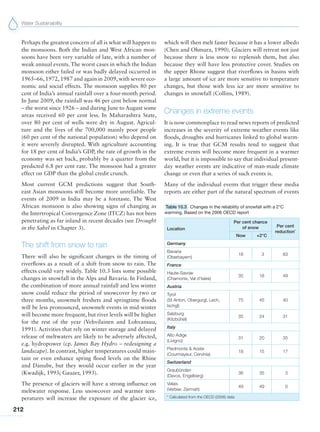
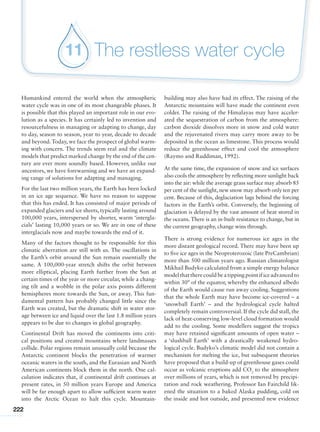
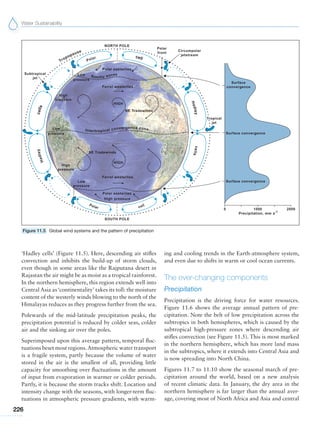
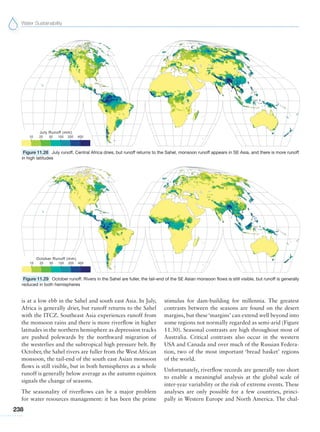
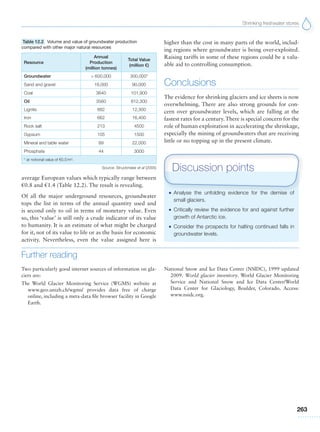
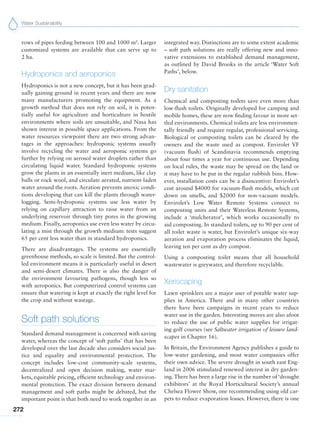
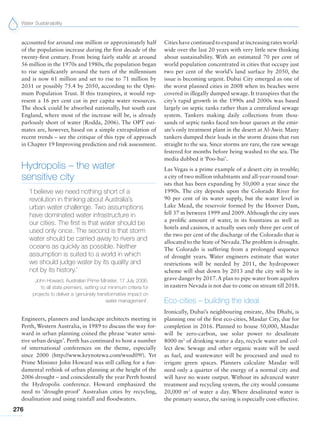
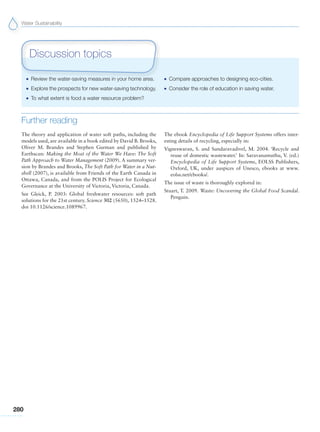
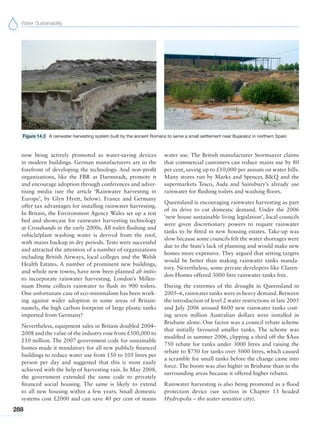
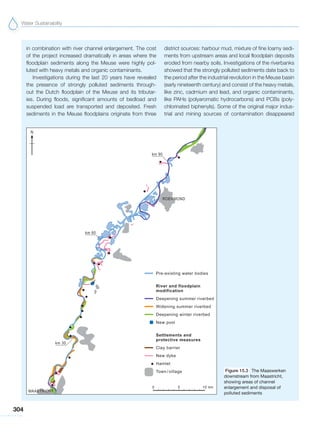
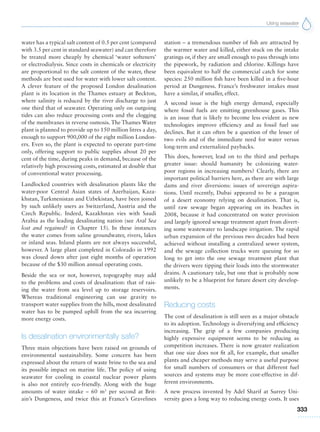
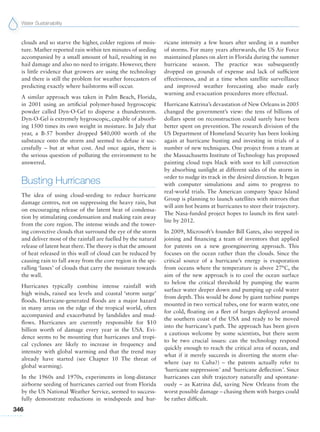
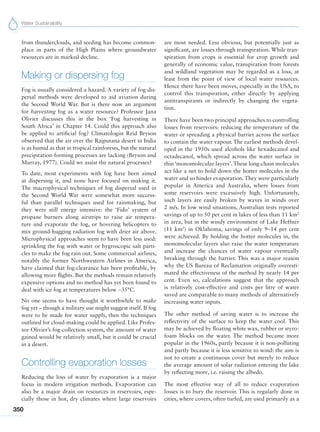
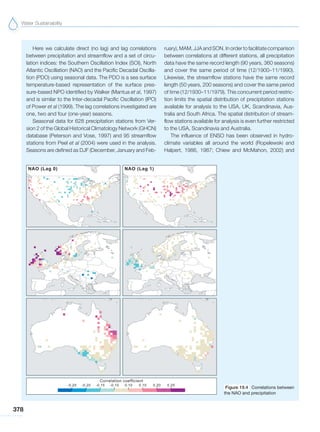
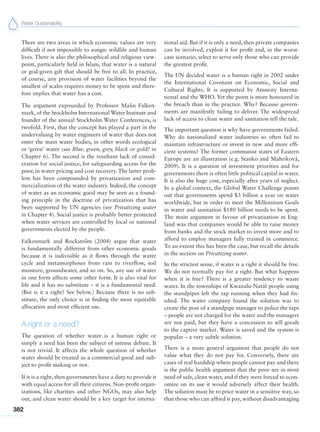
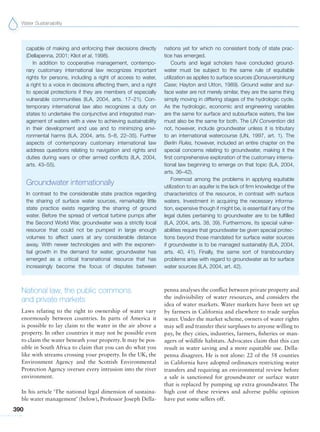
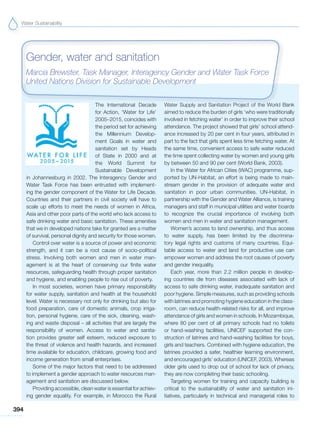
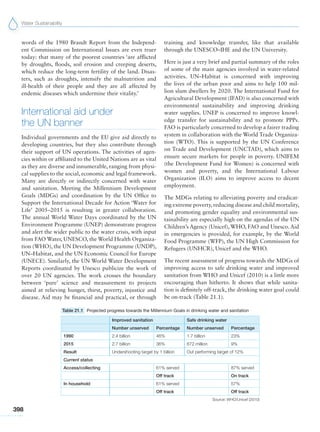
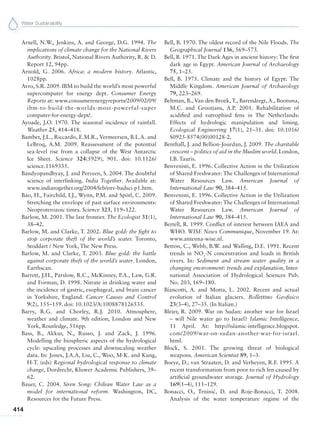
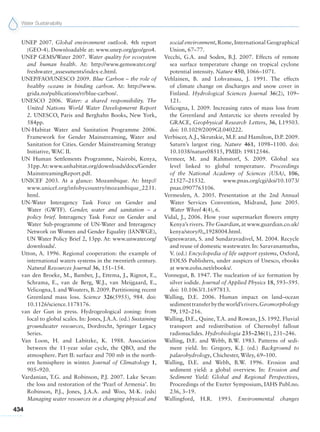
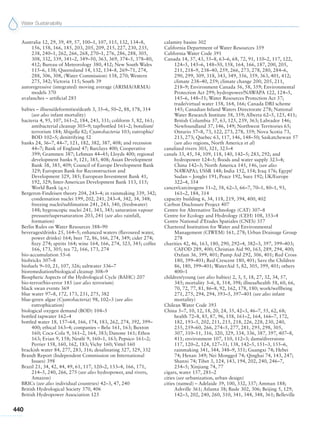
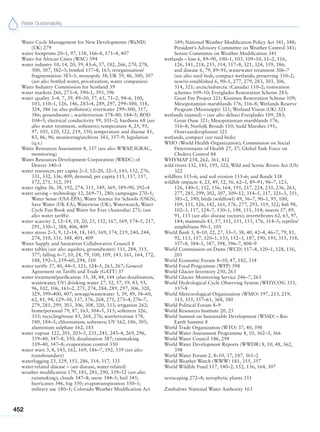
Table 8.1 Virtual water needed to produce some common
products
Product Litres of water
Manufactured goods
Car (steel only in average car) 32,000
Microchips 1 kg
(for cleaning during production)
16,000
Bio-diesel 1 litre (from soybean) 14,000
Leather shoes – pair 8,000
Cotton T-shirt 4,000
Bio-ethanol (sugar beet [lowest] to sugar cane
and maize [greatest])
1,400–2,600
Synthetic rubber 1 kg 460
Copper 1 kg 440
Steel 1 kg 260
Plastic 1 kg 41
Cereals, fruit and vegetables
Bananas 1 kg 850
Rice 1 kg 3,400
Sugar (cane) 1 kg 1,500
Wheat 1 kg 1,350
Maize 1 kg 900
Apples/pears 1 kg (single 100g = 70 litres) 700
Cabbage 1 kg 200
Potatoes 1kg 160–250
Tomatoes 1 kg (single 70 g = 13 litres) 180
Lettuce 1 kg 130
Animal products
Beef 1 kg 15,500
Pork 1 kg 4,800
Eggs 1 kg (single 60 g = 200 litres) 3,330–4,700
Chicken 1 kg 3,900
Processed food
Chocolate 1 kg 24,000
Hamburgers 1 kg (single 150 g = 2400 litres) 16,000
Cheese 1 kg 5,000
Bread (from wheat) 1 kg 1,300
Drinks
Coffee, large 250 mL cup
(to grow, package and ship the coffee)
280
Milk 250 mL glass 250
Orange juice 250 mL glass 210–250
Wine 250 mL glass 240
Apple juice 250 mL glass 240
Beer (from barley) 250 mL glass 75
Tea 250 mL cup 30
Bottled water 250 mL (processing and plastic) 0.75–1
Sources: Hoekstra and Chapagain (2008); Rijssenbeek (2007); Gleick (1993);
www.h20conserve.org](https://image.slidesharecdn.com/watertextbook-130918222901-phpapp02/85/Water-textbook-179-320.jpg)
![Water, war and terrorism
183
They may have a philosophy or simply a grudge. Devis-
ing effective counter-measures is complicated by the
fact that the impacts may not be immediate. Immediate
impacts might be spectacular, but long-term fallout, for
example, continuing to affect public health could be a
greater threat: anthrax could cause widespread deaths
and persist for years.
Following 9/11, many US water companies immedi-
ately began to remove potentially sensitive information
from their websites and Congress set up a Directorate of
Homeland Security to oversee protective measures. Fol-
lowing the discovery of a computer in Afghanistan con-
taining structural analysis programs for dams, the FBI’s
National Infrastructure Protection Center issued a bulle-
tin in 2002 warning of‘Terrorist Interest in Water Supply
and SCADA [Supervisory Control And Data Acquisi-
tion] Systems’ (Shea, 2003). The National Infrastructure
Protection Center now sends warning messages to the
Association of Metropolitan Water Agencies’ Informa-
tion Sharing and Analysis Center (ISAC). ISAC then
delivers early-warnings to water officials throughout the
country.
One ineluctable geographical problem is the extreme
concentration of possible targets: just 15 per cent of
all large drinking water and sewage plants in the USA
supply more than 75 per cent of the population. There
are big hydropower plants as well. The Grand Coulee
Dam on the Columbia River alone produces 25 per cent
of US hydropower. The Hoover Dam on the Colorado
River provides seven per cent of all public electricity in
the west USA. A bypass was completed in 2007 to divert
traffic away from the Hoover Dam and public tours
inside the dam have been stopped – as they have in many
dams in the USA, Britain and elsewhere.
Although these represent the largest targets and would
cause maximum disruption, they will be best protected.
On the other hand, there are hundreds of smaller water
targets that could be less protected. They would not
have the same physical effect, but they could have a dis-
proportionately high scare effect.
The task of providing effective protection is complicated
by the very large range of possible aims and methods of
attack: whether toxins are chemical, biological or radio-
logical; where and how the toxins might be introduced
into water systems; whether the terrorists’ aim is to kill,
infect or simply create fear and panic; whether the aim
is to poison or to physically disrupt the water supply
system by breaching pipelines to cut off supplies or by
breaching dams to cause a flood; whether the attack is
physical or cyber; or whether the attack is indeed aimed
at the water system itself or just using the distribution
network to attack other buildings, as in the possible case
of using sewers to plant bombs beneath key buildings.
Sewage plants and sewer networks are also theoretical
targets. Such attacks may not be so spectacular, but they
could lead to widespread infection.
The list of vulnerable activities also extends well beyond
municipal drinking water supplies. It includes bottled
water production and food and beverage manufac-
ture. Companies using their own private water sources
could be especially vulnerable to commercial terrorism:
the recall of thousands of bottles of Perrier Water after
some were found to contain traces of benzene in 1990
illustrates the potential commercial damage that can be
done, whether this is intentional or accidental. In that
particular case, Perrier attributed the problem to filters
designed to remove the natural benzene that had not
been renewed.
Prevention of waterborne disease has been hindered by
ageing infrastructure and outmoded analysers in many
water plants.The USA Environmental Protection Agency
(EPA) established a water protection task force in 2001,
charged with helping federal, state and local partners
to improve protection of drinking water supplies from
terrorist attack. And the EPA’s National Homeland
Security Research Center initiated the Environmental
Technology Verification (ETV) programme to examine
rapid screening tests that could detect water terrorist
acts as early as possible. The ETV study shows that the
Aqua Survey IQ-Tox Test™ performed extremely well
for the detection of toxic agents or ‘threat contaminants’
in drinking water. The tests focus on both chemical and
biological toxins, such as aldicarb, colchicine, cyanide,
dicrotophos, thallium sulphate, Botulinum toxin, ricin,
soman and VX. Britain has also spent tens of thousands
of pounds on improving the security of water systems,
and the Severn Trent Eclox system performed well in
EPA tests. The international Bentley Institute is market-
ing a wide range of software to help design more secure
water systems, including WaterCAD, WaterGEMS and
WaterSAFE™, offering a full detection, prediction and
response system developed by Haestad. Starodub (2009)
gives a detailed up-to-date review of progress with
instrumental systems to detect threat contaminants in
water. He notes that despite the 1972 Biological Weap-
ons Convention, many countries continue to produce
agents of biological warfare, ranging from biochemical](https://image.slidesharecdn.com/watertextbook-130918222901-phpapp02/85/Water-textbook-196-320.jpg)


This book provides a global perspective on water sustainability issues. It begins with an introduction noting the looming global water crisis and rising demand for water resources. The book is divided into three parts. Part 1 discusses current status and challenges related to water, including rising demand, water and poverty, governance and financing, pollution and health issues, conflicts over water resources, and the impacts of climate change. Part 2 examines nature's water resources including the water cycle and shrinking freshwater stores. Part 3 considers approaches toward achieving sustainability, such as reducing demand, increasing supplies, improving water quality, managing seawater and weather, and improving monitoring, management or aid to developing nations. The book concludes by assessing whether global water sustainability is achievable.


![Resident Evil Archives [Castellano]](https://cdn.slidesharecdn.com/ss_thumbnails/residentevilarchivescastellanopdf-150ppp-140729163132-phpapp01-thumbnail.jpg?width=640&height=640&fit=bounds)


![[Scholar.geology physical geography-botany] fundamentals of soil science (hen...](https://cdn.slidesharecdn.com/ss_thumbnails/scholar-geology-physicalgeography-botanyfundamentalsofsoilsciencehenryfoth-1990-8ed-380pp-ebook-121119041700-phpapp01-thumbnail.jpg?width=640&height=640&fit=bounds)


