1. 12 Upper Grosvenor Street, London, W1K 2ND ~ Tel +44 (20) 7208-1400 Fax: +44 (20) 7208-1401 ~ www.odey.com
Authorised and Regulated by the Financial Conduct Authority
■ The fund returned +1.3% in April ’13 against an MSCI Daily TR Net
Europe (€) return of +1.6%.
■ Positive performance for the month was predominantly due to our
long equity book (+2.1%), with Sports Direct (+53bps), Man Group
(+48bps) and Carphone Warehouse (+26bps) providing the biggest
contributions. The main detractors were Tesoro (-56bps) and British
Sky Broadcasting (-39bps).
■ The short book returned -0.4% after gains achieved on positions such
as ArcelorMittal (+14bps) and ThyssenKrupp (+13bps) were
outweighed by negative contributors such as Petrobas Petroleo
Brasileiro (-20bps), Fiat (-19bps) and Peugeot (-17bps).
■ Elsewhere, government bonds gave a positive contribution of +0.1%
whilst our commodities returned -0.1%.
Events are moving quickly. The US economy continues to show the robustness
that we are expecting. Talking to company managements reveal still careful
planning rather than any expectation of the boom to come. The stock market is
hitting new highs but leadership, until only recently, was with the defensives.
There is still little new money coming into the equity market. None of this is
consistent with anything other than the very beginning of this bull market.
However, when you’re in it, daily, prices are rising and the excitement is literally
breathtaking.
Meanwhile, the emerging markets grow more dangerous by the day. The news
out of China shows good lending bailing out bad loans, rising inflation and rising
inventories. Brazil looks bad too. Australian interest rates now are falling to
world levels and the fall in the Aussie dollar is to follow.
These are the days that make an old investor smile with excitement. “Let glory be
virtue’s shadow”, as Cicero said. Payback time for all those years of pain,
holding equities.
That is if you’re still there?
Source for above 3 tables: Internal unaudited figures. All
performance figures quoted are net of fees. Past performance is
not a reliable indicator of future performance.
Source for above table and chart: Daiwa Europe Fund
Managers & MSCI. *Calculation on a NAV basis as at
30-Apr-13.
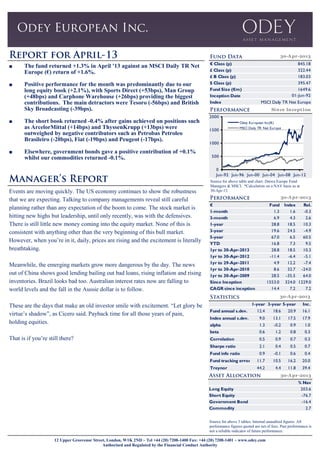
Since Inception
0
500
1000
1500
2000
Jun-92 Jun-96 Jun-00 Jun-04 Jun-08 Jun-12
Odey European Inc(€)
MSCI Daily TR Net Europe
30-Apr-2013
% Nav
Long Equity 203.6
Short Equity -76.7
Government Bond -16.4
Commodity 2.7
€ Fund Index Rel.
1-month 1.3 1.6 -0.3
3-month 6.9 4.3 2.6
1-year 28.8 18.5 10.3
3-year 19.6 24.5 -4.9
5-year 67.0 6.5 60.5
YTD 16.8 7.3 9.5
1yr to 30-Apr-2013 28.8 18.5 10.3
1yr to 30-Apr-2012 -11.4 -6.4 -5.1
1yr to 29-Apr-2011 4.9 12.2 -7.4
1yr to 30-Apr-2010 8.6 32.7 -24.0
1yr to 30-Apr-2009 28.5 -35.5 64.0
Since Inception 1553.0 324.0 1229.0
CAGR since inception 14.4 7.2 7.2
30-A pr-2013
1-year 3-year 5-year Inc.
Fund annual s.dev. 12.4 18.6 20.9 16.1
Index annual s.dev. 9.0 13.1 17.5 17.9
alpha 1.3 -0.2 0.9 1.0
beta 0.6 1.2 0.8 0.3
Correlation 0.5 0.9 0.7 0.3
Sharpe ratio 2.1 0.4 0.5 0.7
Fund info ratio 0.9 -0.1 0.6 0.4
Fund tracking error 11.7 10.5 16.2 20.0
Treynor 44.2 4.4 11.8 39.4
30-Apr-2013
€ Class (p) 845.18
£ Class (p) 322.44
£ B Class (p) 183.03
$ Class (p) 395.47
Fund Size (€m) 1649.6
Inception Date
Index MSCI Daily TR Net Europe
30-Apr-2013
01-Jun-92